
- Contact Us:
-

-

-

-


Daily Market Updates
25 May 2023
USDJPY
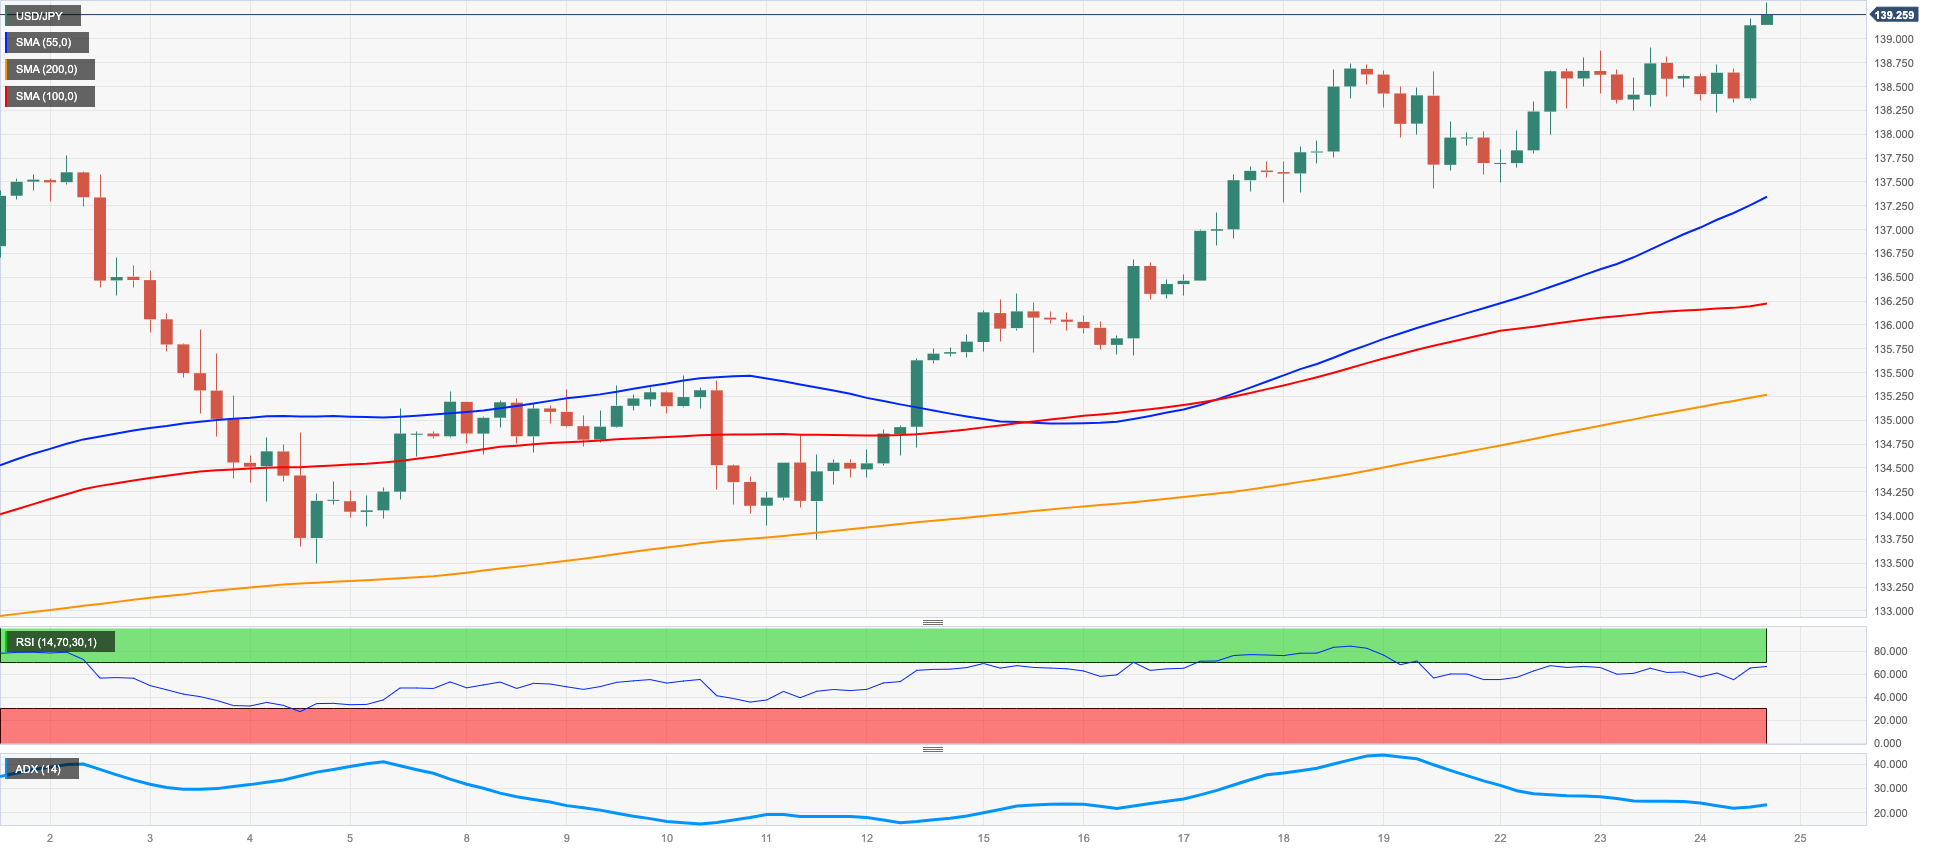
USD/JPY kept the positive weekly bias well in place and rose to levels last seen in late November 2022 beyond 139.00 the figure on Wednesday.
The positive price action in the greenback and the mixed note in US yields across the curve were enough to spark another spell of strength in the pair, which has maintained the bullish view for the third week in a row so far.
In the Japanese money market, the JGB 10-year yields rose for the second session in a row, now leaving behind the 0.41% level, although the broader consolidative phase stayed unchanged.
In the Japanese data space, the Reuters Tankan Index improved to 6 in May (from -3) in what was the sole release in the calendar midweek.
The next resistance for USD/JPY is at the 2023 top of 139.04 (May 24), with the potential for further upside. If the pair continues to appreciate, it could retest the weekly highs of 139.89 (November 30 2022) and 142.25 (November 21 2022). On the downside, the first support is at the important 200-day SMA at 137.17, ahead of the provisional 55-day and 100-day SMAs at 134.17 and 133.33, respectively. On the way down, we encounter the weekly low of 133.01 (April 26), followed by minor support at 132.01 (April 13) and the April low of 130.62 (April 5). A deeper decline could lead to a repeat of the March low at 129.63 (March 24) and the February low at 128.08 (February 8) before approaching the 2023 low at 127.21 (January 16). The daily RSI rose to the boundaries of 68
.
Resistance levels: 139.38 139.89 141.61 (4H chart)
Support levels: 137.49 135.64 135.14 (4H chart)
GBPUSD
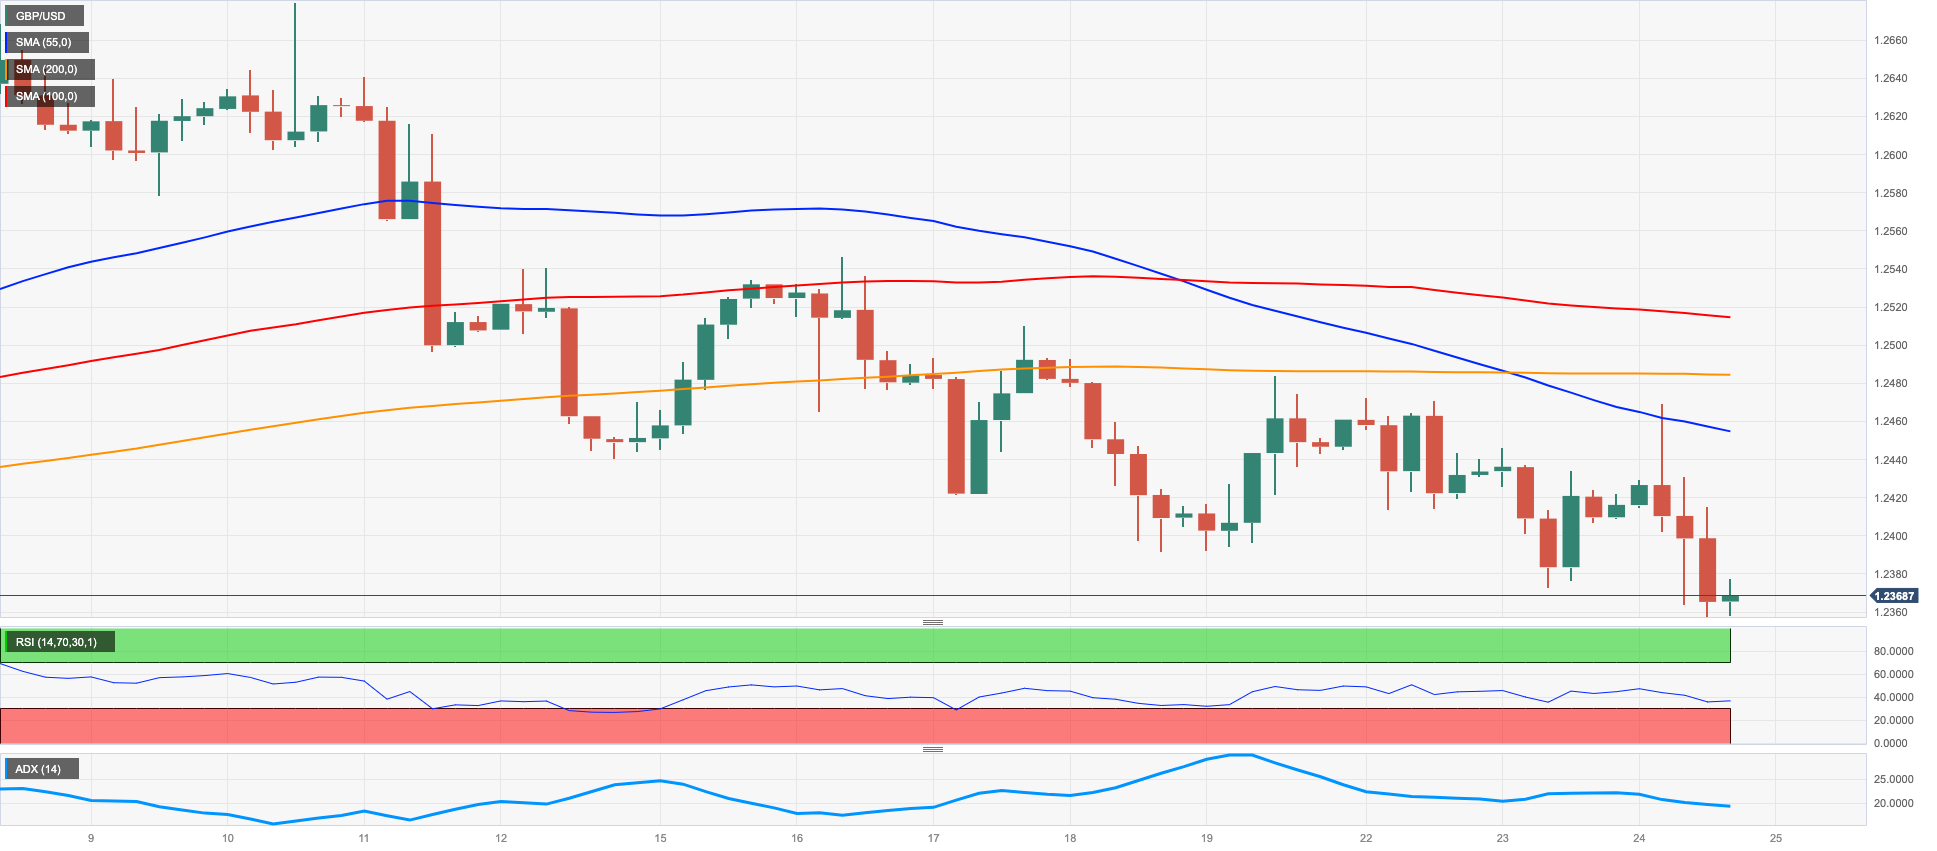
Further upside momentum in the greenback triggered another weak session in the risk-linked galaxy and forced GBP/USD to print fresh monthly lows near 1.2360 on Wednesday.
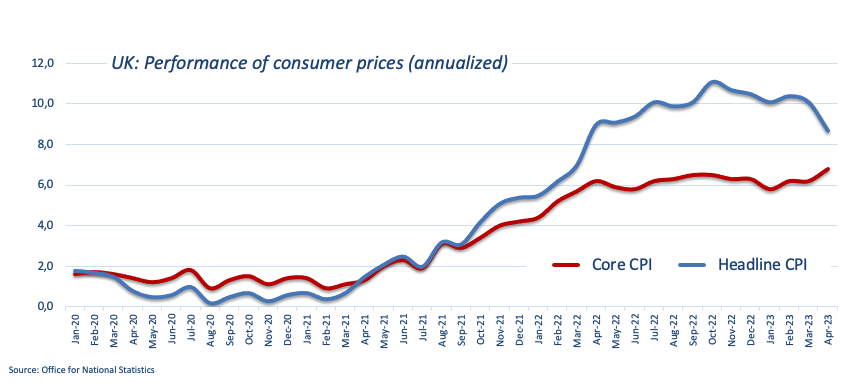
The British pound remained unable to maintain the initial bull run to the 1.2470 region soon after UK inflation figures tracked by the CPI rose more than initially estimated during April. On this, consumer prices rose at an annualized 8.7% (from 10.1%) and 6.8% YoY when it came to the Core reading (from 6.2%). These inflation prints prompted investors to start pricing in further tightening by the BoE in the next few months.
From the BoE, Governor A. Bailey stated that about one-third of the rate hikes so far have had an impact on the economy, while reiterating that the labour market remains tight and inflation expectations appear to be losing traction. Moreover, Bailey acknowledged that the main problem is how persistent and stubborn the decline in inflation will be.
The breach of the May low at 1.2359 (May 24) may compel GBP/USD to revisit the weekly low of 1.2344 (April 10), followed by the April low of 1.2274 (April 3), which gains support from the temporary 100-day SMA (1.2279). Further downward movement could lead to a retest of the significant 200-day SMA at 1.1971 before reaching the 2023 low of 1.1802 (March 8). On the contrary, if the pair moves in an upward direction, the first challenge to overcome would be the 2023 high of 1.2679 (May 10). Buyers might also target the 200-week line SMA at 1.2864, followed by the psychological level of 1.3000. The daily RSI deflated further to the proximity of 41.
Resistance levels: 1.2469 1.2483 1.2510 (4H chart)
Support levels: 1.2359 1.2344 1.2274 (4H chart)
AUDUSD
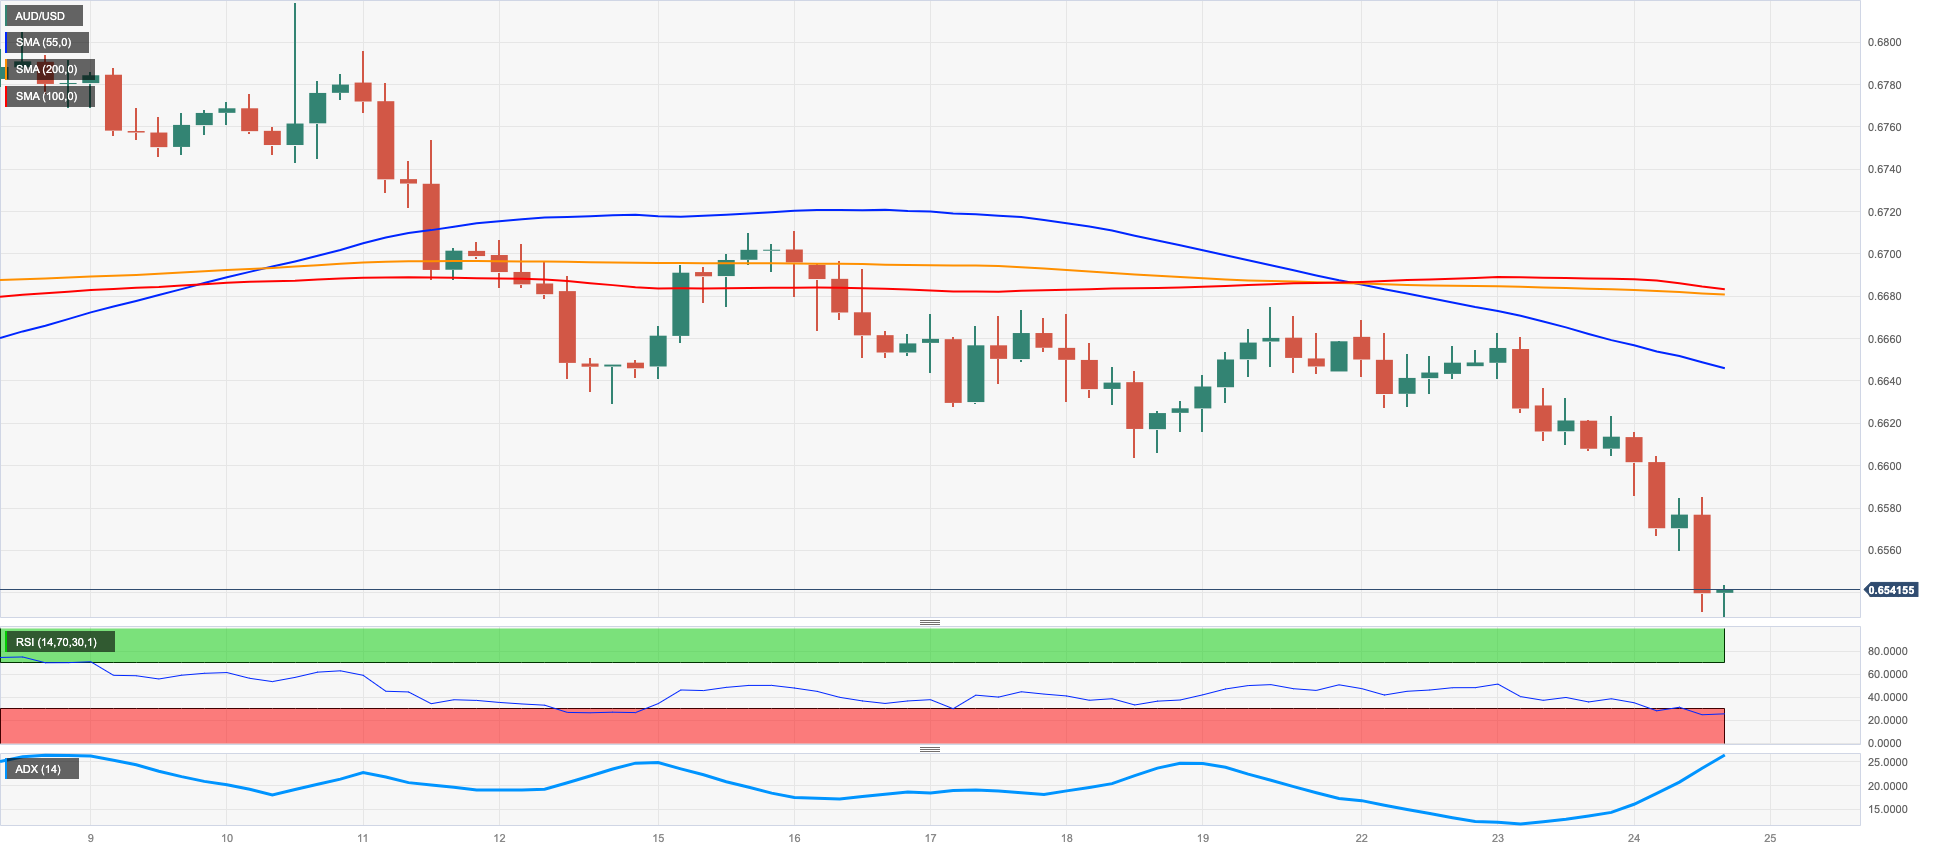
AUD/USD added to Tuesday’s pullback and retreated sharply to an area last visited back in mid-November 2022 near 0.6530 on Wednesday.
Further strength in the greenback in combination with the generalized poor performance in the commodity complex and the dovish hike from the RBNZ have all weighed on the Aussie dollar and sponsored the marked move lower.
Back to commodities, copper prices retreated to the $3.55 region for the first time since late November 2022, while iron ore remained somewhat range-bound above $105.00 per tonne.
In the calendar, the Westpac Leading Index came in flat on a monthly basis in April. In addition, RBA’s Jacobs said he expects the balance sheet unwinding process to run smoothly.
AUD/USD clocked a new 2023 low at 0.6531 on May 24. The loss of this level could open the door to the weekly lows at 0.6386 (November 10 2022) and the November 2022 low at 0.6272 (November 3). By contrast, if the pair manages to overcome the 200-day SMA at 0.6706, the next critical hurdle would be the May high of 0.6818 (May 10) ahead of the critical round level of 0.7000. Further north emerges the weekly top of 0.7029 (February 14) prior to the 2023 peak at 0.7157 (February 2). The RSI on the daily chart dropped below the 37 mark.
Resistance levels: 0.6675 0.6709 0.6818 (4H chart)
Support levels: 0.6531 0.6386 0.6272 (4H chart)
GOLD
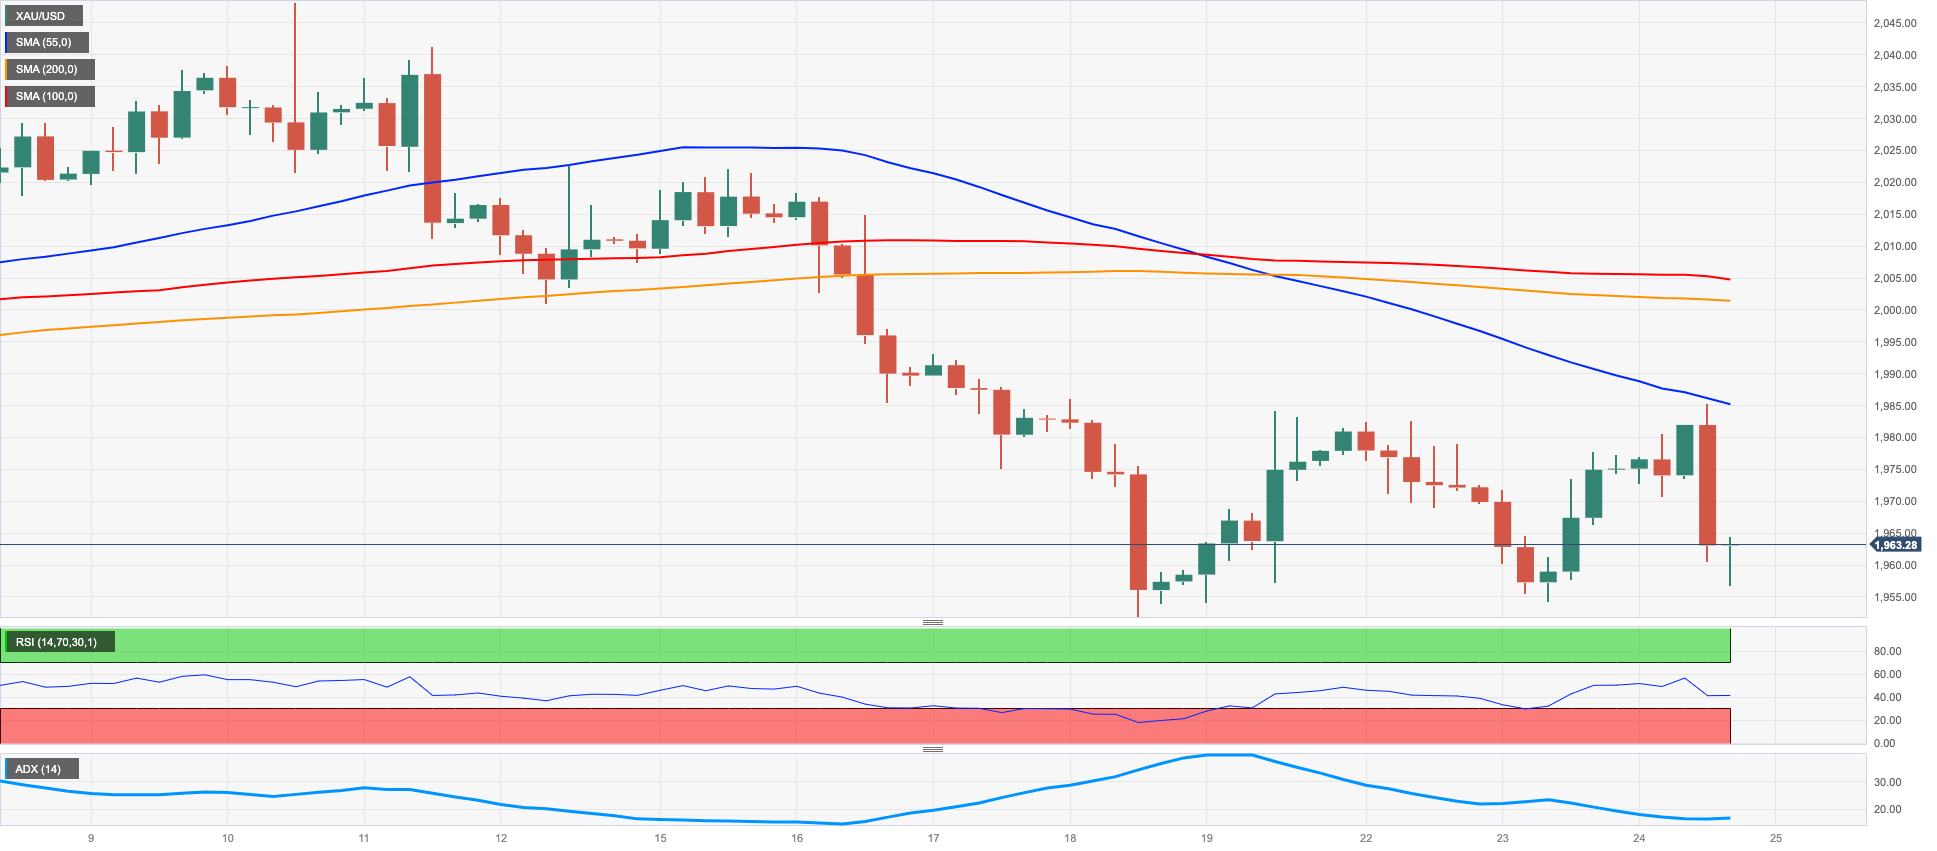
Prices of the ounce troy of gold remained choppy on Wednesday and faded Tuesday’s rebound, ending the day around the $1960 region following an earlier uptick to the $1985 zone.
Further buying pressure in the greenback and higher yields in the belly and the long end of the US curve put the yellow metal under pressure amidst the resurgence of some speculation pointing at the likelihood that the Fed might not pause its hiking cycle at the June 14 gathering.
Moving forward, bullion is expected to face some renewed volatility in light of the imminent release of US inflation figures gauged by the PCE on May 26.
By virtue of selling pressure strengthening, bullion could fall back to the May low of $1952 (May 18), which appears maintained by the April low of $1949 (April 3) and goes before the 100-day SMA at $1933. South from here emerges the key 200-day SMA at $1828, all before the 2021 low of $1804 (February 28). Assuming that it climbs, the immediate up-barrier arises at the key $2000 mark. Further up, there are no opposition levels of note until the 2023 top of $2067 (May 4), endorsed by the March 2022 high of $2070 (March 8) and the unrivaled peak of $2075 (August 7, 2020).
Resistance levels: $1985 $2003 $2022 (4H chart)
Support levels: $1952 $1934 $1885 (4H chart)
CRUDE WTI
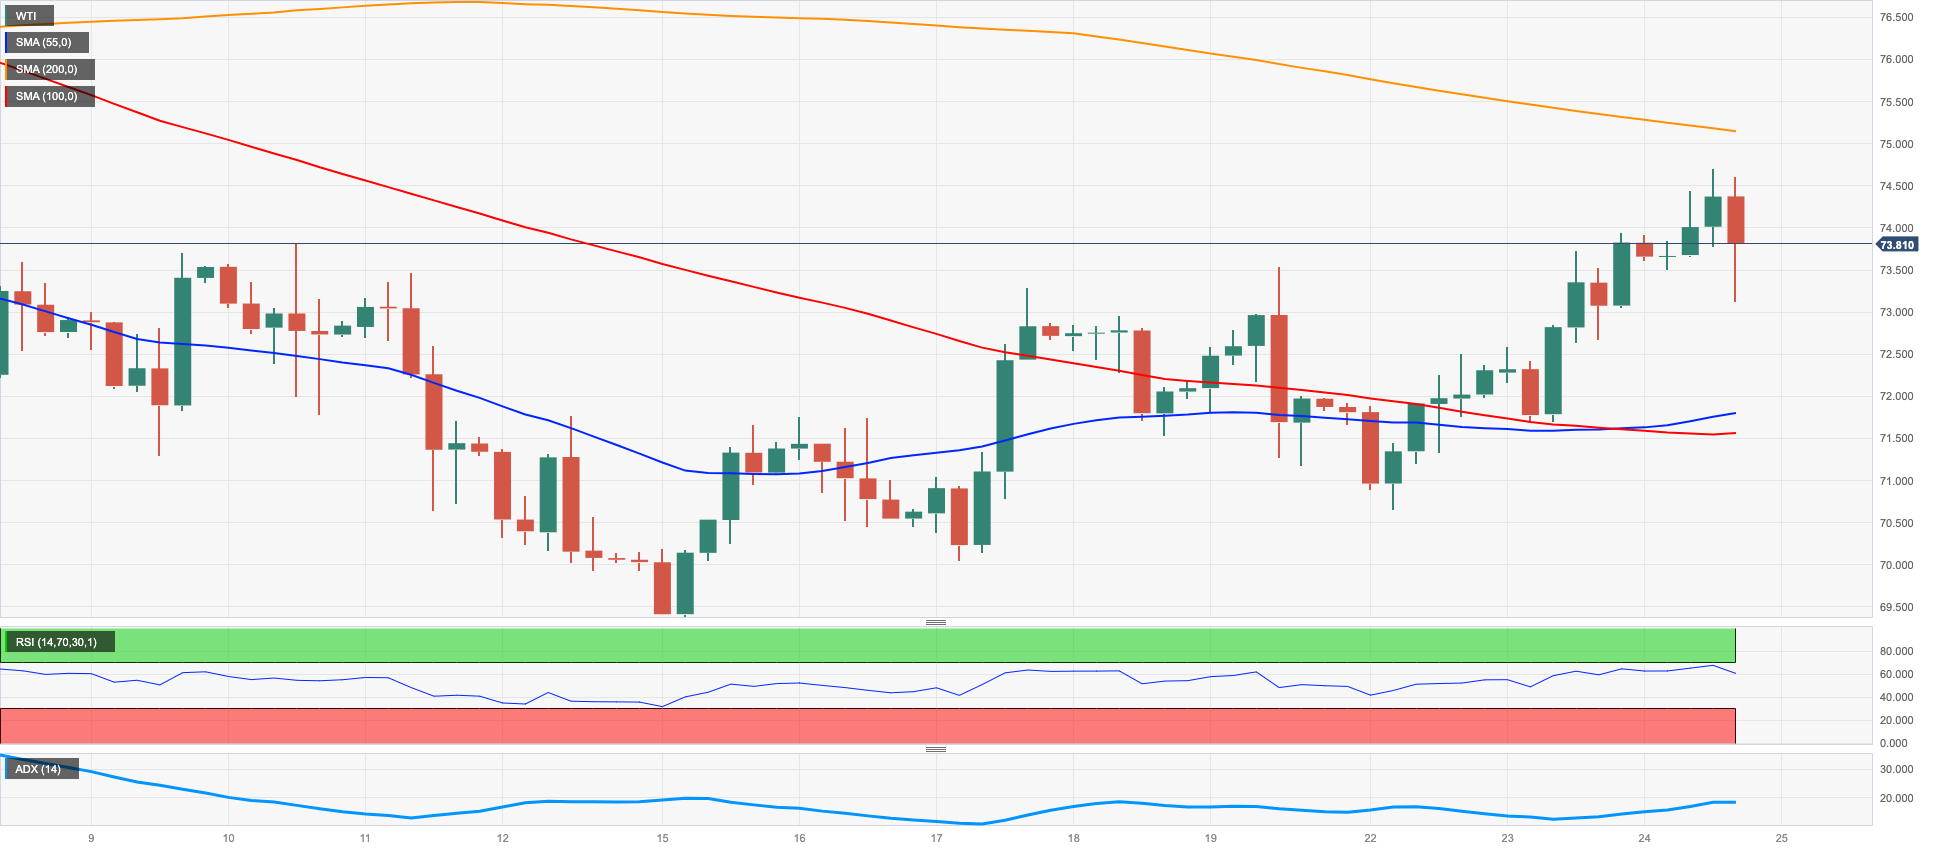
The optimism around crude oil remained well and sound for the third consecutive session on Wednesday.
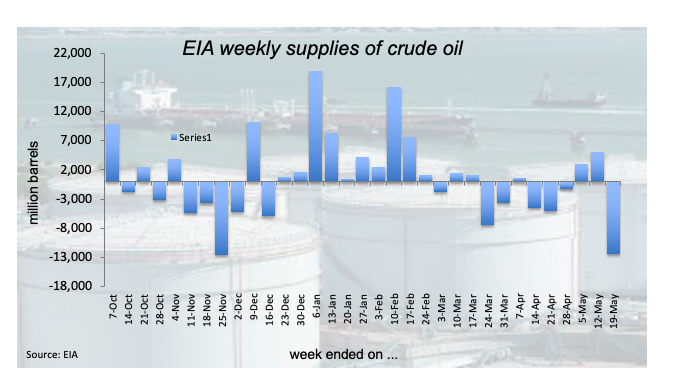
Indeed, the barrel of WTI rose to new 3-week tops north of the $74.00 mark, as investors continued to factor in the probability of further oil output cuts from the OPEC+ (as per Tuesday’s warnings from Saudi Arabia to short-sellers) and the unexpected weekly drop in crude oil inventories.
On the latter, the EIA reported that US crude oil inventories unexpectedly shrank by 12.456M barrels in the week to May 19, while supplies at Cushing rose by 1.762M barrels, Weekly Distillate Stocks declined by 0.562M barrels and gasoline stockpiles decreased more than estimated by 2.053M barrels.
Also adding to the bid bias in the commodity, gasoline futures extended the upside and flirted with the $2.730 region, up for the third week in a row.
The renewed upside in WTI appears well and sound so far this week. Against that, additional upward movement is anticipated to encounter the next challenge at the temporary 100-day SMA at $75.95 prior to the weekly high of $79.14 (April 24), followed by the important level of $80.00 and the crucial 200-day SMA at $80.04. Moreover, there are further resistance levels worth noting, such as the 2023 peak of $83.49 (April 12), as well as the November 2022 top of $93.73 (November 7). In the event that sellers regain control in the market, it is crucial to monitor significant support levels. These include the 2023 low of $63.61 (May 4), followed by the December 2021 low of $62.46 (December 2), and the critical level of $60.00 per barrel.
Resistance levels: $74.69 $75.34 $76.89 (4H chart)
Support levels: $71.85 $70.01 $69.38 (4H chart)
GER40
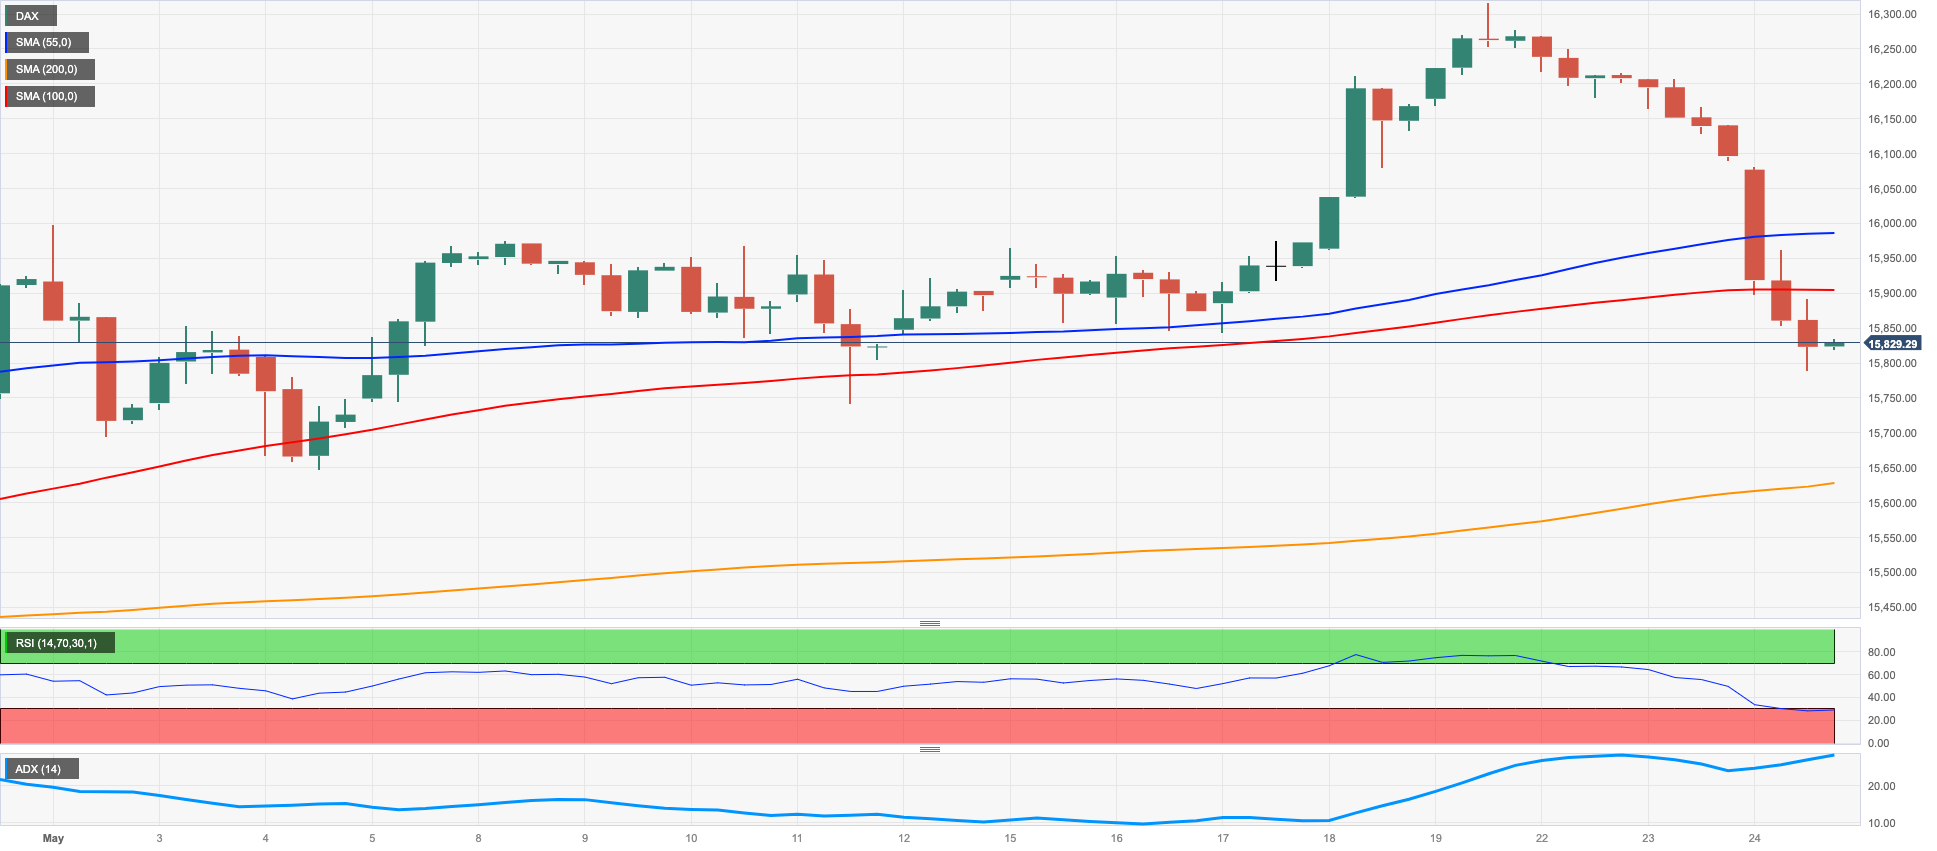
Germany’s reference DAX40 clinched the third straight session with losses on Wednesday, this time revisiting the 15800 region on the back of steady fears surrounding the US debt ceiling negotiations.
Indeed, European securities exchanges have up to this point remained somewhat quiet even with the absence of a bipartisan consent to raise/suspend the debt ceiling, however disquiet is now picking up pace among investors and is expected to put stocks under extra pressure in the very near term.
In the domestic calendar, the IFO’S Business Climate eased to 91.7 for the month of May.
Meanwhile, in the German debt market, the 10-year Bund yields looked consolidative above the 2.45% region.
On May 19, the DAX40 marked a new all-time high at 16331, but immediate support is provided by the May low of 15662 (May 4), ahead of the preliminary 55-day line SMA at 15626 and the April low of 15482 (April 5). Further down, the preliminary 100-day line SMA is at 15398, followed by minor support levels such as 14809 (March 24) and 14458 (March 20). In addition, the critical 200-day line SMA at 14395 could play an important role in a more significant retracement. The daily RSI dropped to the vicinity of 62.
Best Performers: Bayer, Deutsche Telekom AG, Hannover Rueck SE
Worst Performers: Infineon, Dr Ing hc F Porsche Pfd, Daimler Truck Holding
Resistance levels: 16331 17000? 18000? (4H chart)
Support levels: 15802 15754 15662 (4H chart)
NASDAQ
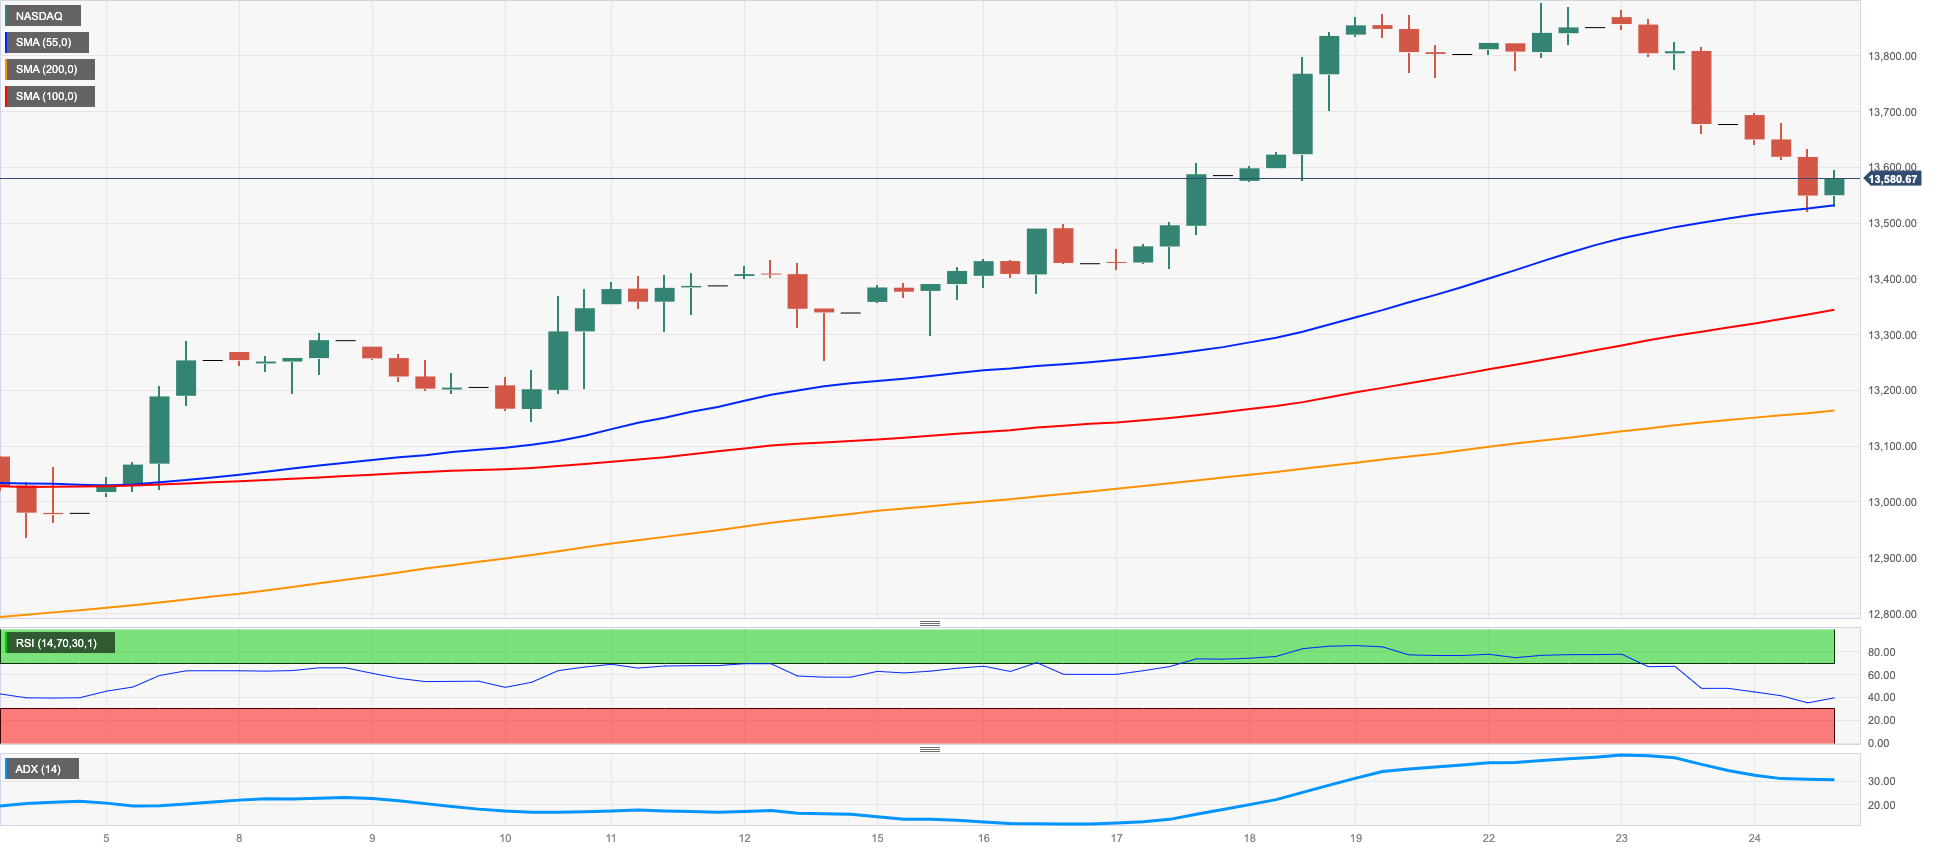
The tech reference Nasdaq 100 added to Tuesday and extended further the weekly decline on Wednesday, deflating to multi-day lows around the 13500 zone.
The tech sector, like the rest of its US counterparts, succumbed to the negative mood among traders in reaction to continuing debt ceiling fears, while the strong tone in the buck and more upward in US yields also weighed on the index midweek.
If sellers regain control of the sentiment and the Nasdaq 100 begins to fall, interim 55-day SMA at 12981 is expected to offer initial support prior to the May low of 12938 (May 4). This level is backed up by the April low of 12724 (April 25) ahead of the 200-day SMA at 12127, followed by the March low of 11695 (March 13) and the weekly lows at 11550 (January 25) and 11251 (January 19). A deeper drop could threaten the 2023 low at 10696 (January 6). On the upside, the immediate hurdle comes at the 2023 peak at 13893 (May 22). If this upward trend continues, the next target could be the March 2022 top of 15265 (March 29). On the daily chart, the RSI breached the 58 region.
Top Gainers: Palo Alto Networks, Crowdstrike Holdings, O’Reilly Automotive
Top Losers: Analog Devices, Intuit, Microchip
Resistance levels: 13893 14277 15161 (4H chart)
Support levels: 13520 13263 12938 (4H chart)
DOW JONES
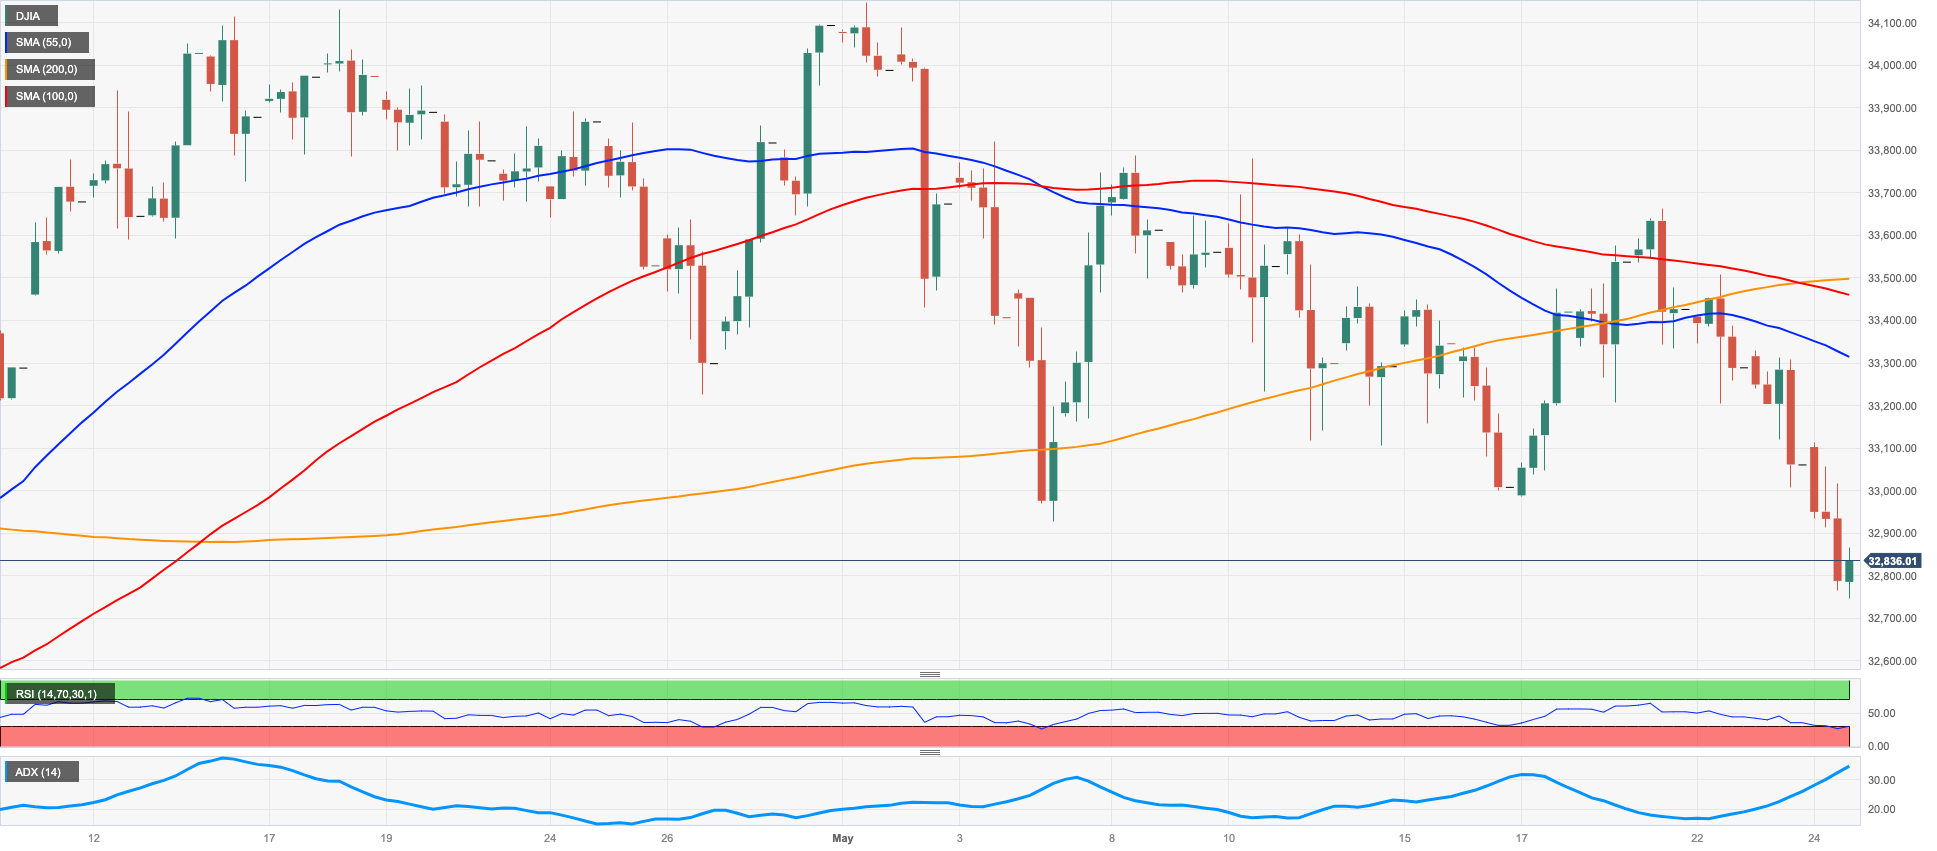
More of the same, namely, debt ceiling jitters, weighed on investors’ sentiment and sponsored the fourth consecutive daily pullback in the US stocks benchmark Dow Jones, this time breaking below the key 33000 support for the first time since late March, an area where the critical 200-day SMA also converges.
Tuesday's talks between Democrats and Republicans ended without a deal, despite the positive atmosphere of the meetings. White House officials declared that negotiations had reached an impasse, which caused concern among market participants due to the looming deadline for the government to default on its obligations (Treasury Secretary J. Yellen stated this would be in early June).
Overall, the Dow Jones deflated 0.74% to 32810, the S&P500 retreated 0.81% to 4111, and the tech-heavy Nasdaq Composite dropped 0.77% to 12463.
The Dow Jones faces the prospects of extra losses on a breakdown of the critical 200-day SMA at 32774. Further south emerges the 2023 low of 31429 (March 15) ahead of the 2022 low of 28660 (October 13). On the upside, the first conceivable goal is the weekly high at 33652 (May 19) before the May top at 34257 (May 1), followed by the 2023 peak at 34342 (January 13) and the December 2022 high at 34712 (December 13). If the index rises over this level, it may accelerate toward the April 2022 top of 35492 (April 21). The RSI grinded lower and broke below 39.
Top Performers: Salesforce Inc, UnitedHealth, Chevron
Worst Performers: 3M, Boeing, Walgreen Boots
Resistance levels: 33652 33772 34257 (4H chart)
Support levels: 32752 31805 31429 (4H chart)
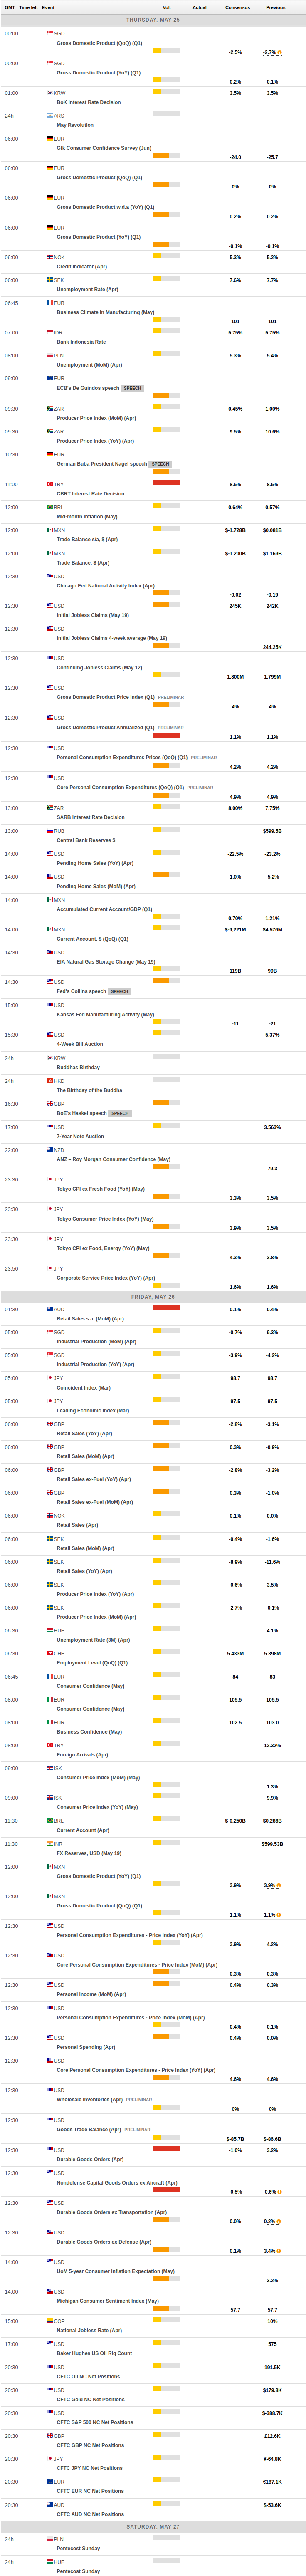
MACROECONOMIC EVENTS
All Information & Updates provided by:

All information relating to the financial markets available on this page has been prepared and issued by FXStreet (Forexstreet SL, Spain, Reg: B62498233) on the basis of publicly available information and all information believed to be reliable and does not conflict with Kuwaiti local laws, and all necessary care has been taken to before the company to ensure that the facts mentioned are correct from the source.
NCM Investment nor any of its directors or employees shall in any way be held responsible for the contents of this news, and the information contained on this page is intended only to provide clients with publicly available information and should not be construed as investment advice, report or analysis and/or constitute an offer or invitation to buy or sell financial instruments of any kind.
RISK WARNING: Forex and CFDs are highly risky leveraged products, as losses can exceed deposits. Please ensure you understand all the risks and take independent advice if necessary. NCM will segregate the clients based on the criteria of the regulator and its bylaws. NCM does not provide any advisory service; the material published does not constitute advice or a recommendation for a transaction in any financial instrument. NCM accepts no responsibility for any use of the content presented and any consequences of that use. Anyone acting on the information provided does so at their own risk.