
- Contact Us:
-

-

-

-


Daily Market Updates
26 May 2023
USDJPY
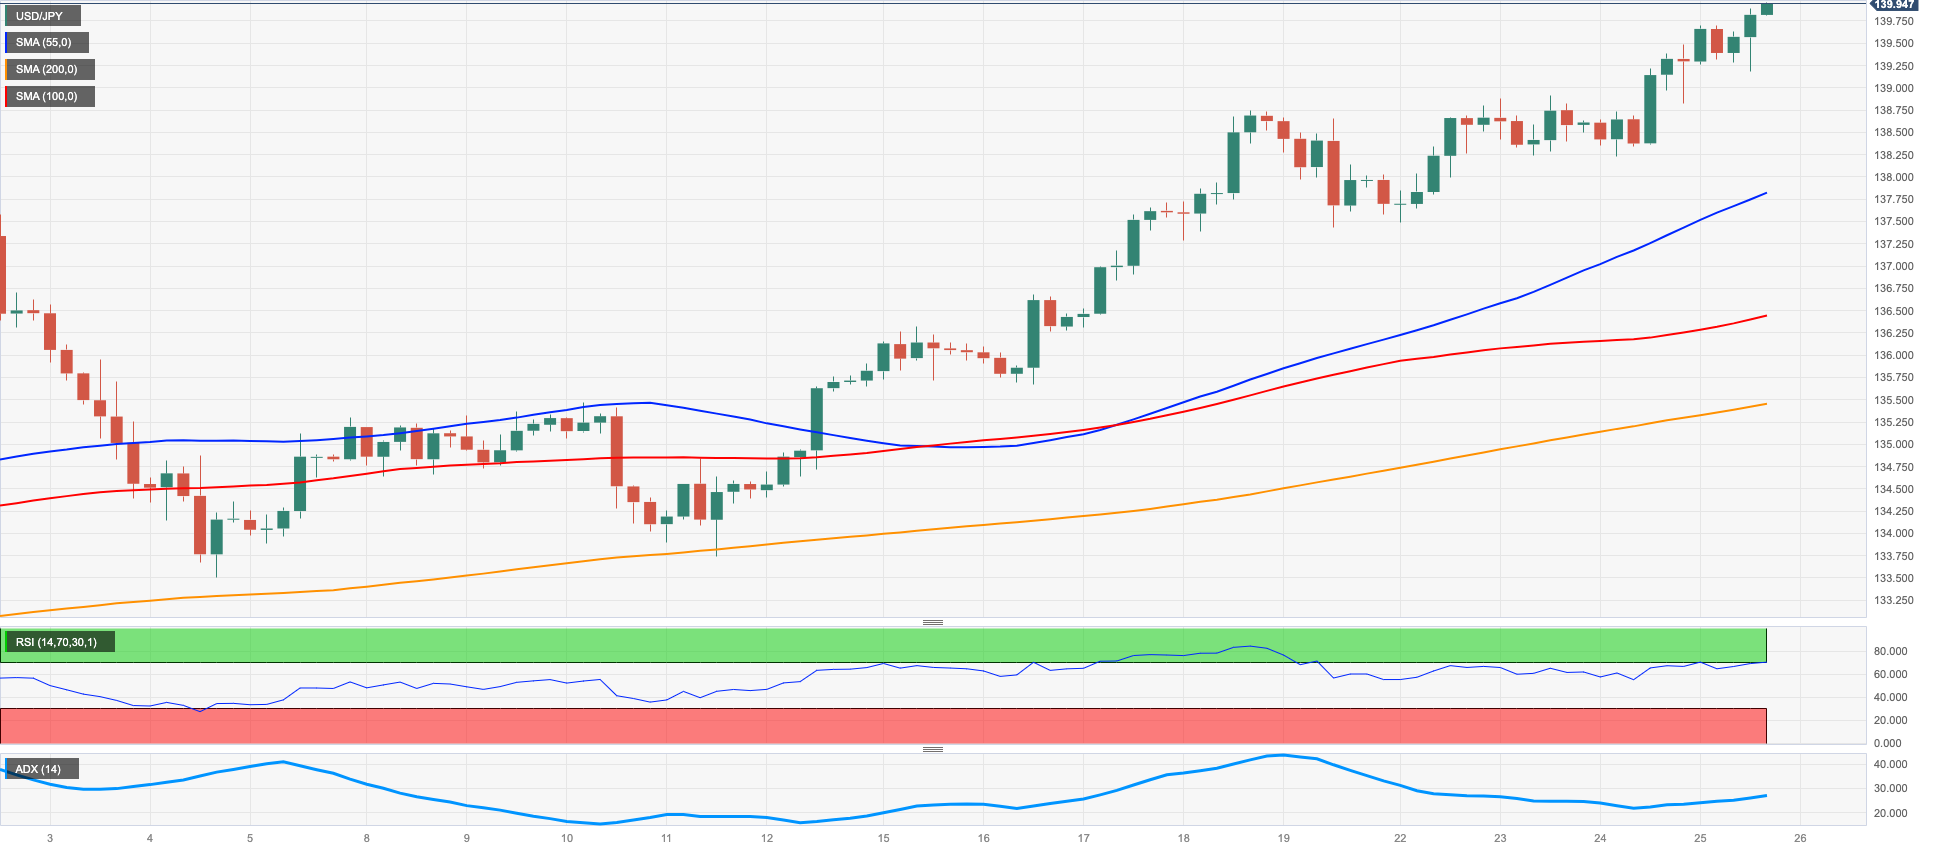
There were no changes to the upside bias in USD/JPY for yet another session on Thursday. In fact, the pair this time advanced to fresh highs in levels just shy of the key 140.00 mark for the first time since late November 2022.
The tenacious march north in the dollar catapulted the USD Index (DXY) to fresh peaks past the 104.00 barrier, while US yields across the curve advanced to new multi-week peaks.
In Japan, the bond market appears to have woken up, as the JGB 10-year yields rose for the third session in a row and approached the 0.45% region.
In the Japanese calendar, Foreign Bond Investment rose ¥964.7B in the week to May 20 in what was the sole release on Thursday.
USD/JPY's next resistance is at its 2023 peak of 139.83 (May 25), with further rally potential. If the pair continues to rise in value, it may retest the weekly highs of 139.89 (November 30 2022) and 142.25 (November 21 2022). Just the opposite, initial support is at the crucial 200-day SMA at 137.19 before the 55- and 100-day temporary SMAs at 134.24 and 133.40, respectively. Further south, the pair is expected to meet the weekly low of 133.01 (April 26), followed by a minor support at 132.01 (April 13) and the April low of 130.62 (April 5). In a deeper move, the March low of 129.63 (March 24) and the February low of 128.08 (February 8) should come to the fore seconded by the 2023 low at 127.21 (March 16) The everyday RSI entered the overbought territory past 70.
Resistance levels: 139.96 141.61 142.25 (4H chart)
Support levels: 137.73 137.49 136.39 (4H chart)
GBPUSD
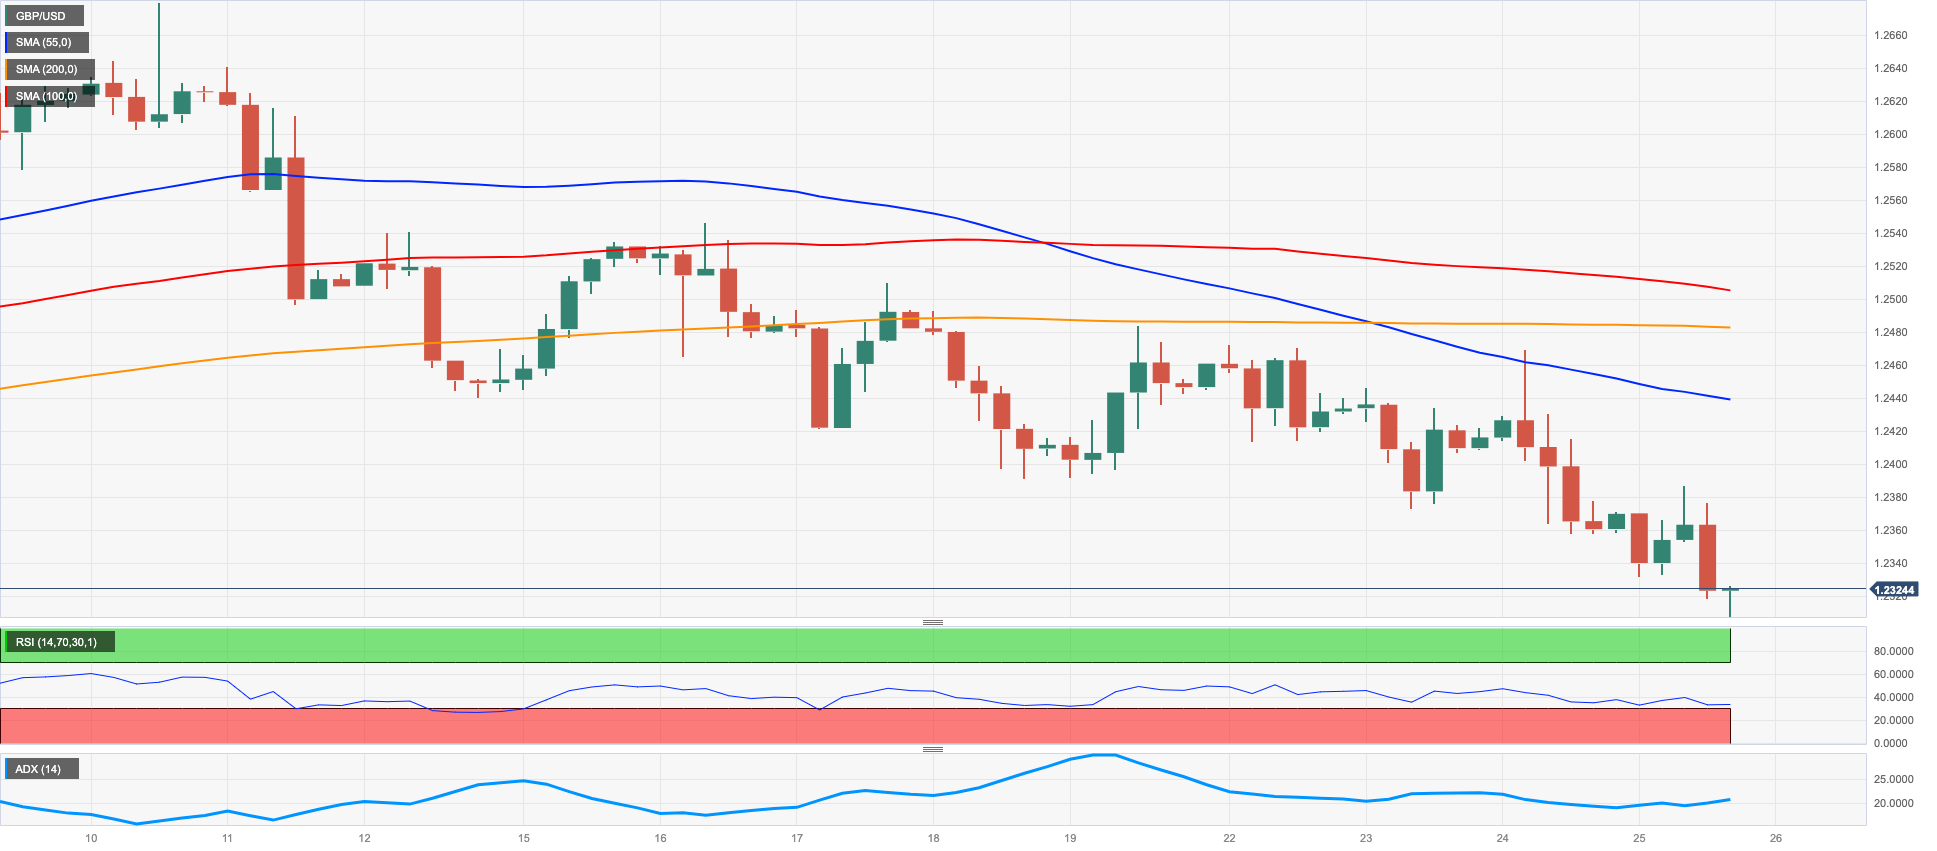
GBP/USD accelerated the decline and confronted the key 1.2300 zone, or new monthly lows, on Thursday.
Indeed, Cable dropped for the fourth session in a row amidst the intense upside momentum in the greenback and increasing cautiousness among traders in light of persistent concerns around the US debt ceiling negotiations.
From the BoE, MPC member J. Haskel did not rule out more rate hikes when he noted that increasing company profits are not driving inflation and emphasized that the UK labor market remained highly tight. Haskel also said that he is focusing more on short-term economic statistics.
In the UK calendar, Car Production expanded 9.9% in the year to April, and the CBI Distributive Trades worsened to -10 for the current month (from 5).
If the May low of 1.2308 (May 25) is broken, GBP/USD may be forced to revisit the temporary 100-day SMA at 1.2284 prior to the April low of 1.2274 (April 3). Further declines might result in a retest of the important 200-day SMA at 1.1973 before reaching the 2023 bottom of 1.1802. (March 8). On the opposite side, if the pair continues to rise, the first hurdle to conquer will be the weekly high at 1.2546 (May 16) ahead of the 2023 top of 1.2679 (May 10). Buyers may potentially aim for the 200-week SMA at 1.2864, seconded by the psychological milestone of 1.3000. The daily RSI retreated to the sub-39 region.
Resistance levels: 1.2387 1.2469 1.2510 (4H chart)
Support levels: 1.2308 1.2274 1.2189 (4H chart)
AUDUSD
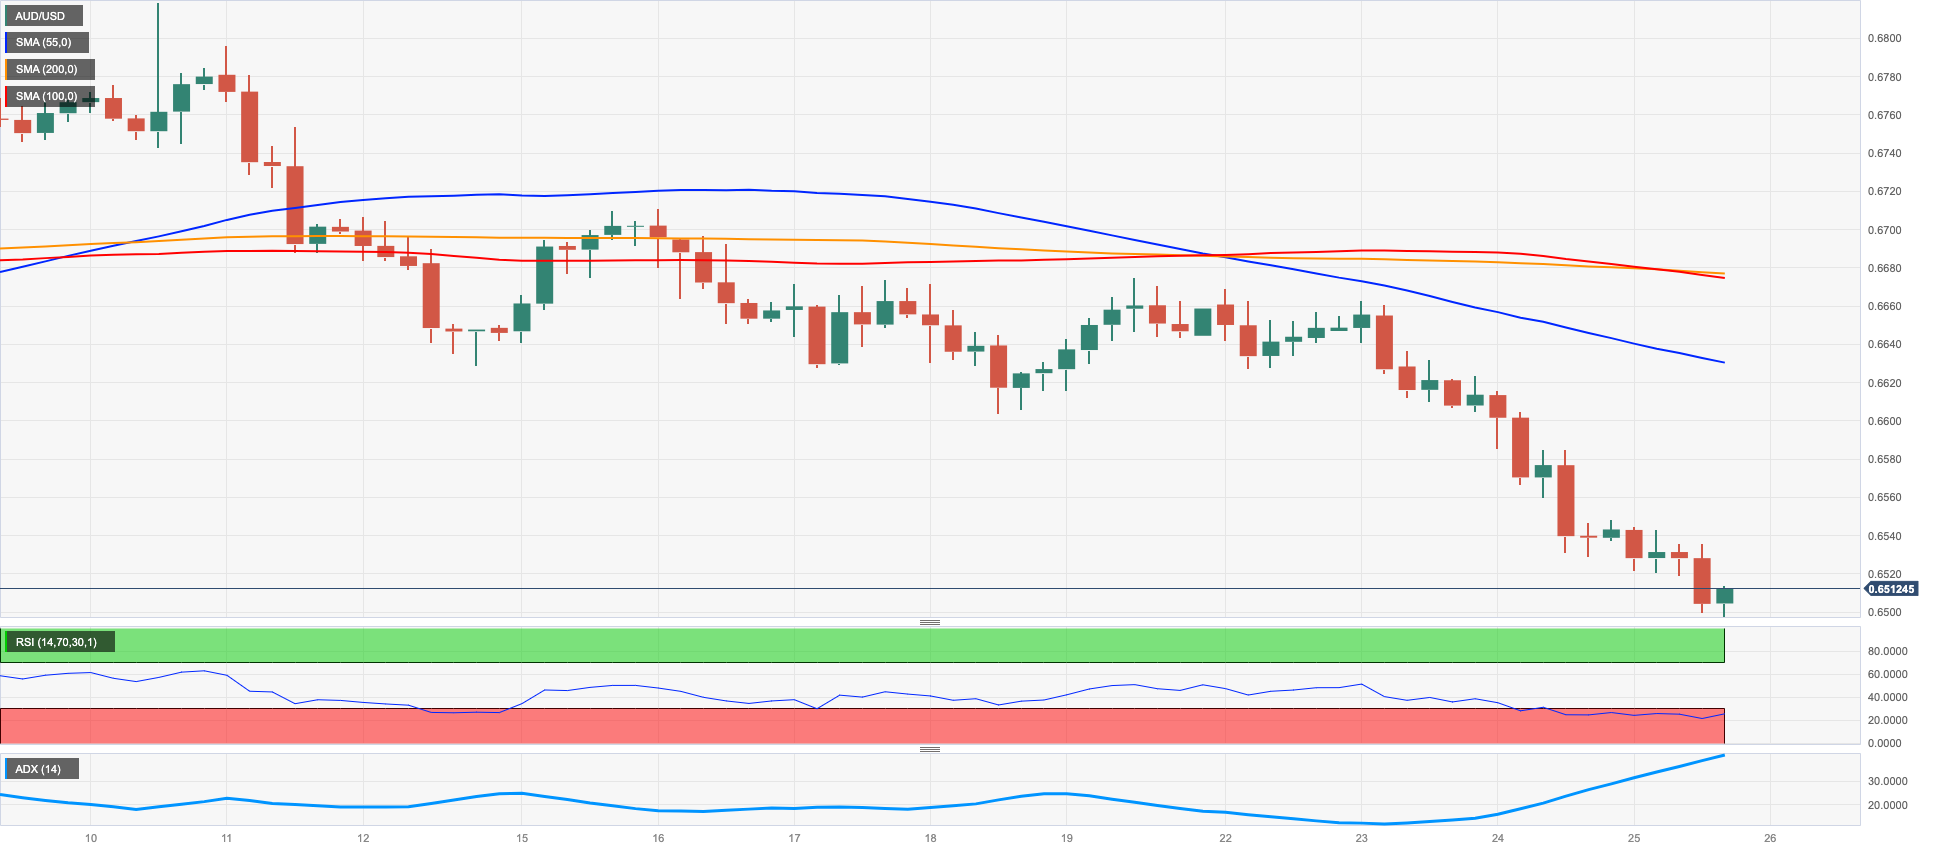
AUD/USD retreated for the third session in a row on Thursday, this time briefly piercing the 0.6500 support to record fresh 6-month lows amidst the intense rally in the greenback.
The mixed performance from the commodity complex also weighed on the Aussie dollar, as it only saw copper prices attempt a mild bounce on Thursday.
Further collaborating with the sour mood around the high-beta currency resurfaced the uneven recovery in the Chinese economy in the wake of the pandemic, as well as the dovish hike by the Reserve Bank of New Zealand (RBNZ) earlier on Thursday and the likelihood that the RBA could follow this move at its next meeting.
The Australian docket was empty on Thursday, leaving attention to the release of flash Retail Sales for the month of April on Friday.
On May 25, the AUD/USD reached a new low for 2023, hitting 0.6498. If this level is breached, it could pave the way for the weekly lows at 0.6386 (November 10, 2022) and the November 2022 low at 0.6272 (November 3). On the contrary, if the pair manages to surpass the 200-day SMA at 0.6704, the next significant obstacle would be the May top of 0.6818 (May 10), followed by the critical psychological level of 0.7000. Above this zone, the weekly peak of 0.7029 (February 14) emerges before the 2023 high at 0.7157 (February 2). The daily RSI dropped heavily to the 34 region.
Resistance levels: 0.6632 0.6675 0.6709 (4H chart)
Support levels: 0.6498 0.6386 0.6272 (4H chart)
GOLD
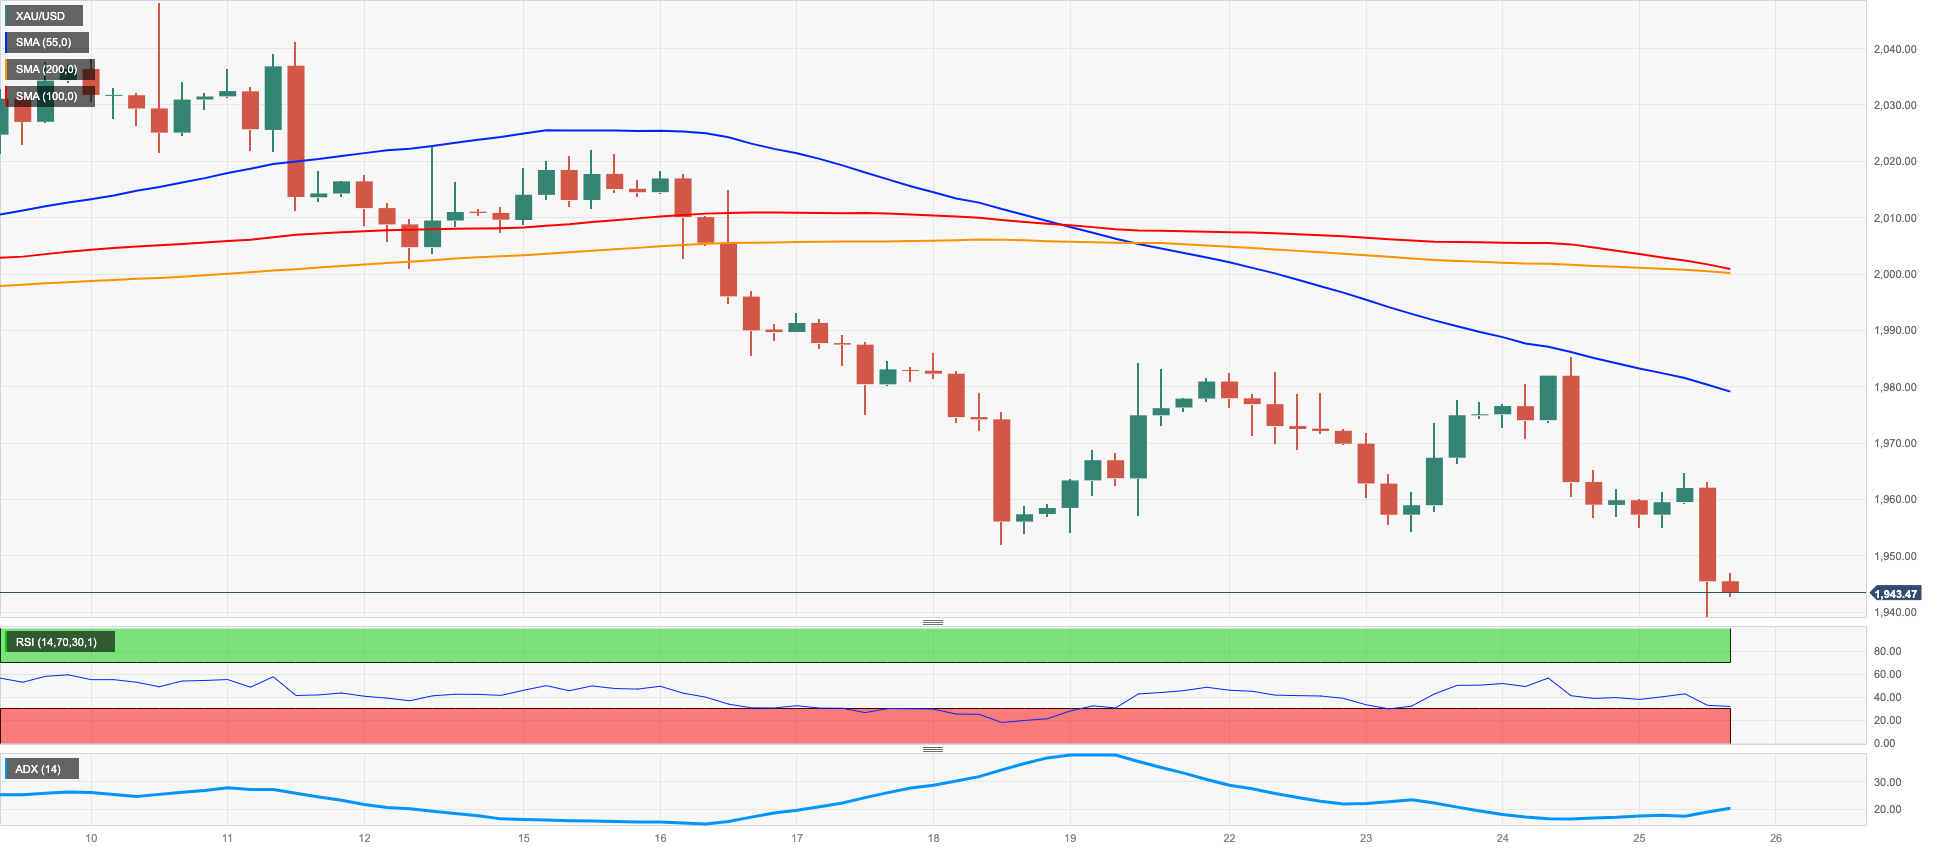
Gold prices retreated further and printed new 2-month lows near $1940 per ounce troy on Thursday.
The second session in a row with losses in the yellow metal was once again on the back of the unabated rally in the greenback, which motivated the USD Index (DXY) to trespass the 104.00 hurdle, while the relentless advance in US yields across the curve also added to the downbeat sentiment around the precious metal.
In the meantime, bullion is expected to trade on the cautious side ahead of the release of the US inflation figures gauged by the PCE/Core PCE on Friday.
Further selling pressure pulled gold to a new May low of $1939 on May 25, which currently seems to be supported by the intermediate 100-day SMA of $1933. The important 200-day SMA appears south of here at $1829, well before the 2021 bottom of $1804 (February 28). Meanwhile, sporadic recoveries might encounter interim resistance around the 55-day SMA at $1982 ahead of the critical $2000 level. There are no notable opposition levels from here until the 2023 top of $2067 (May 4), which is supported by the March 2022 high of $2070 (March 8) and the unmatched peak of $2075. (August 7, 2020).
Resistance levels: $1985 $2000 $2022 (4H chart)
Support levels: $1939 $1885 $1809 (4H chart)
CRUDE WTI
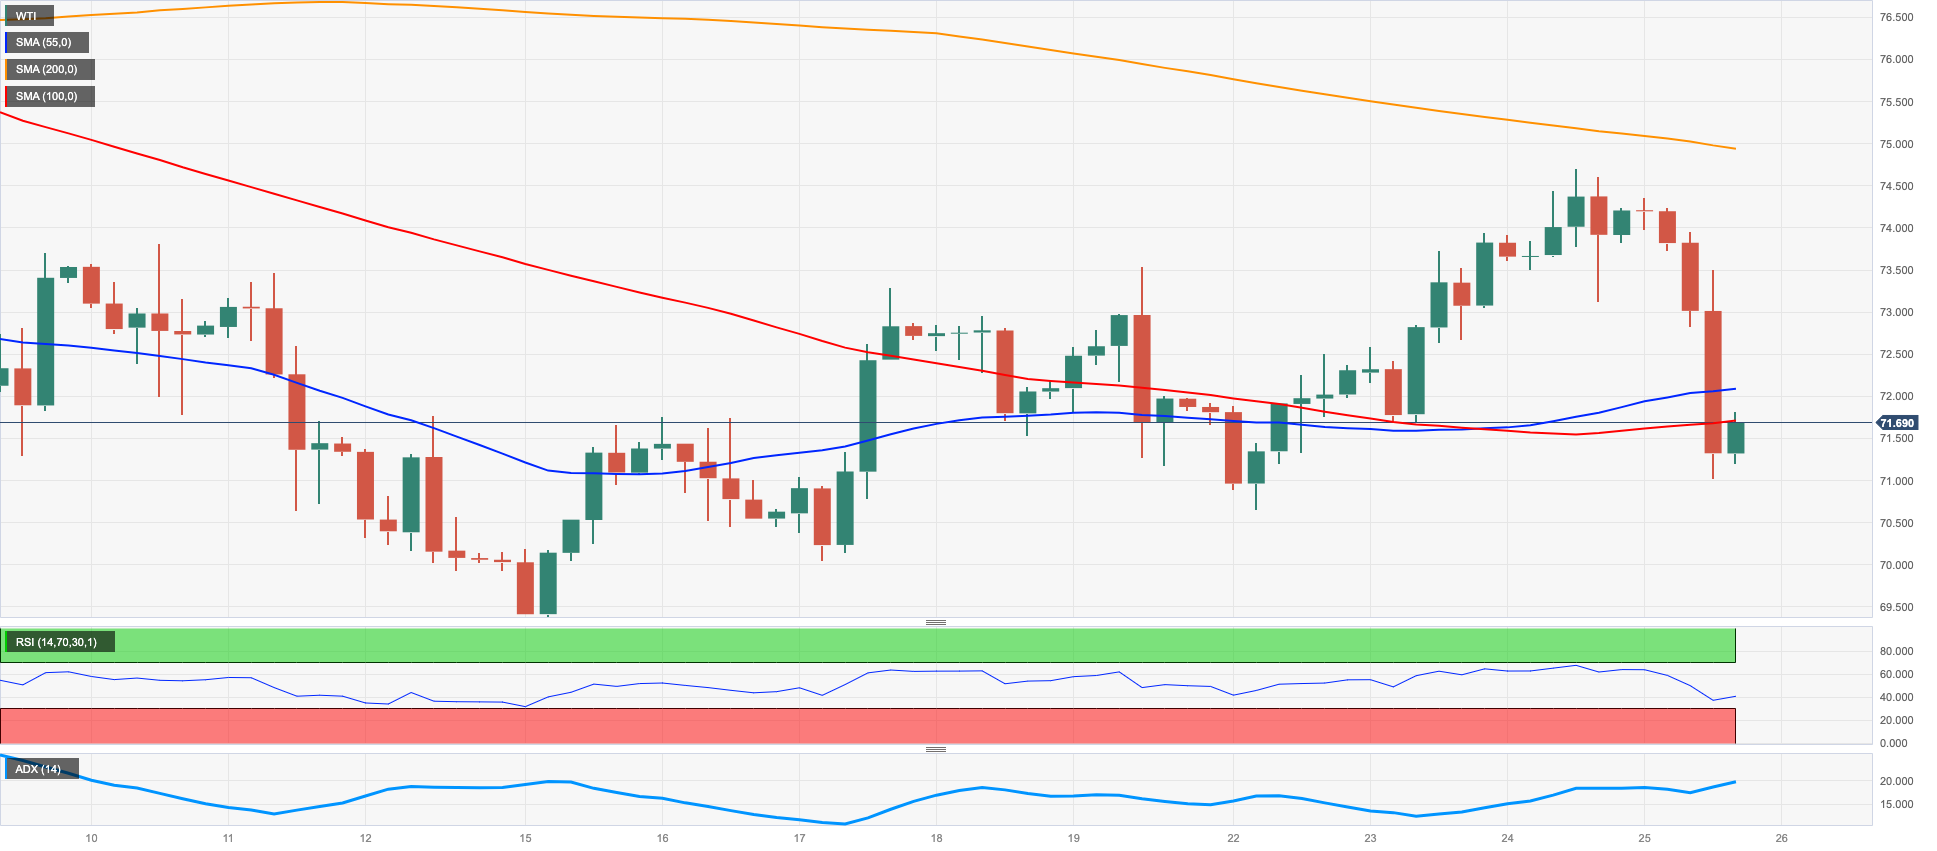
Prices of WTI abruptly reversed three consecutive daily builds and retreated to the $71.00 region on Thursday.
The sharp move lower in the commodity followed comments from Russian Deputy PM A. Novak, who talked down the probability that OPEC+ could announce extra oil output cuts at its meeting early in June.
Also helping in the daily pullback emerged the increasing unease in response to the still-absence of a deal around the US debt ceiling issue as well as the relentless march north in the US dollar.
In line with the pullback in crude oil prices, gasoline futures dropped more than 3% to the $2.62 region after four consecutive daily upticks.
It appears that the WTI has been performing well this week, and further gains are expected to meet resistance at the interim 100-day SMA at $75.90, followed by the key $80.00 barrier and the 200-day SMA at $79.9. Additionally, the 2023 peak of $83.49 (April 12) and the November 2022 top of $93.73 (November 7) are worth noting. If sellers retake control, it is essential to watch for key support levels, including the 2023 low of $63.61 (May 4), the December 2021 low of $62.46 (December 2), and the critical $60.00 per barrel.
Resistance levels: $74.69 $75.12 $76.89 (4H chart)
Support levels: $71.03 $70.01 $69.38 (4H chart)
GER40
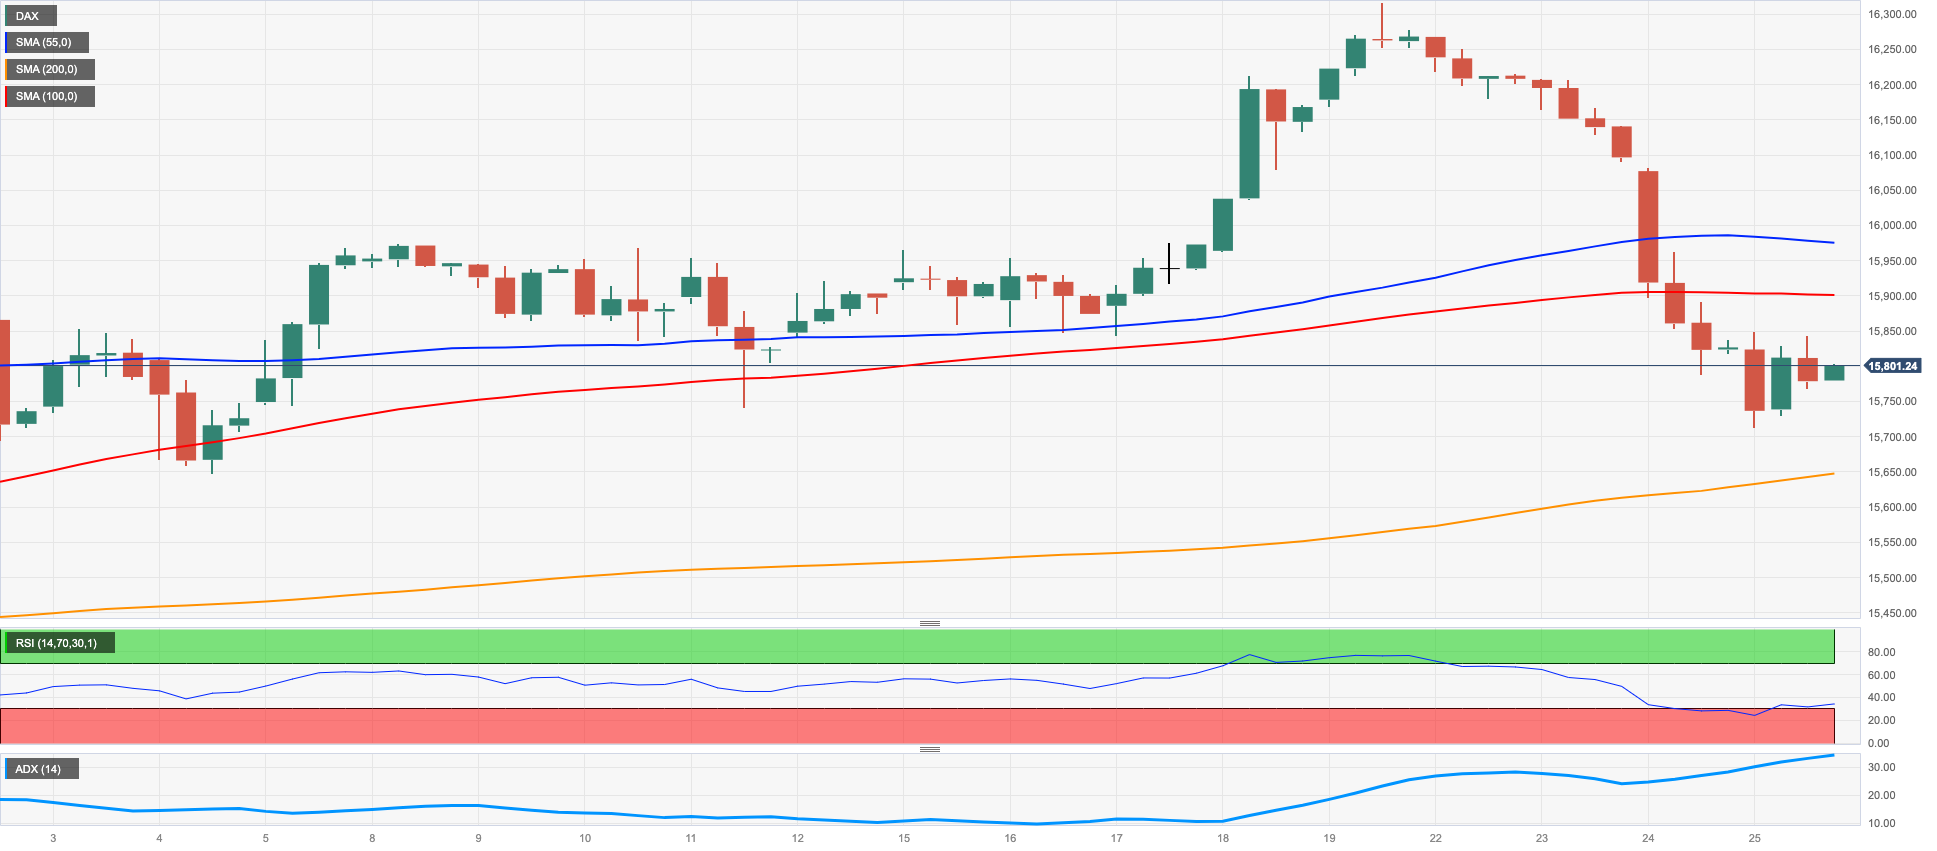
Unabated debt ceiling unease and discouraging prints from Germany’s GDP figures in the January-March period were enough to spark another negative session in the German DAX40, this time receding to multi-day lows near 15700 on Thursday.
Indeed, the German economy contracted 0.3% QoQ in Q1 and 0.5% over the last twelve months. Further domestic results saw Consumer Confidence gauged by GfK improve marginally to -24.2 for the month of June.
Further strength, in the meantime, lifted the 10-year Bund yields to the vicinity of the 2.55% level, or monthly highs.
The continuation of the move lower in the DAX40 could challenge the weekly low at 15726 (May 25) ahead of the May low at 15662 May 4). The latter appears underpinned by the temporary 55-day SMA at 15634 prior to the April low at 15482 (April 5), which also seems propped up by the 100-day SMA at 15434. Further down comes smaller support levels such as 14809 (March 24) and 14458 (March 20). Additionally, the significant 200-day SMA at 14415 could play an important role in more significant retracements. On the upside, there are no hurdles of note until the all-time high at 16331 (May 19). The daily RSI retreated to the 46 region.
Best Performers: Siemens Energy AG, Merck, Siemens AG
Worst Performers: Deutsche Telekom AG, RWE AG ST, Infineon
Resistance levels: 15948 16331 17000? (4H chart)
Support levels: 15726 15662 15596 (4H chart)
NASDAQ
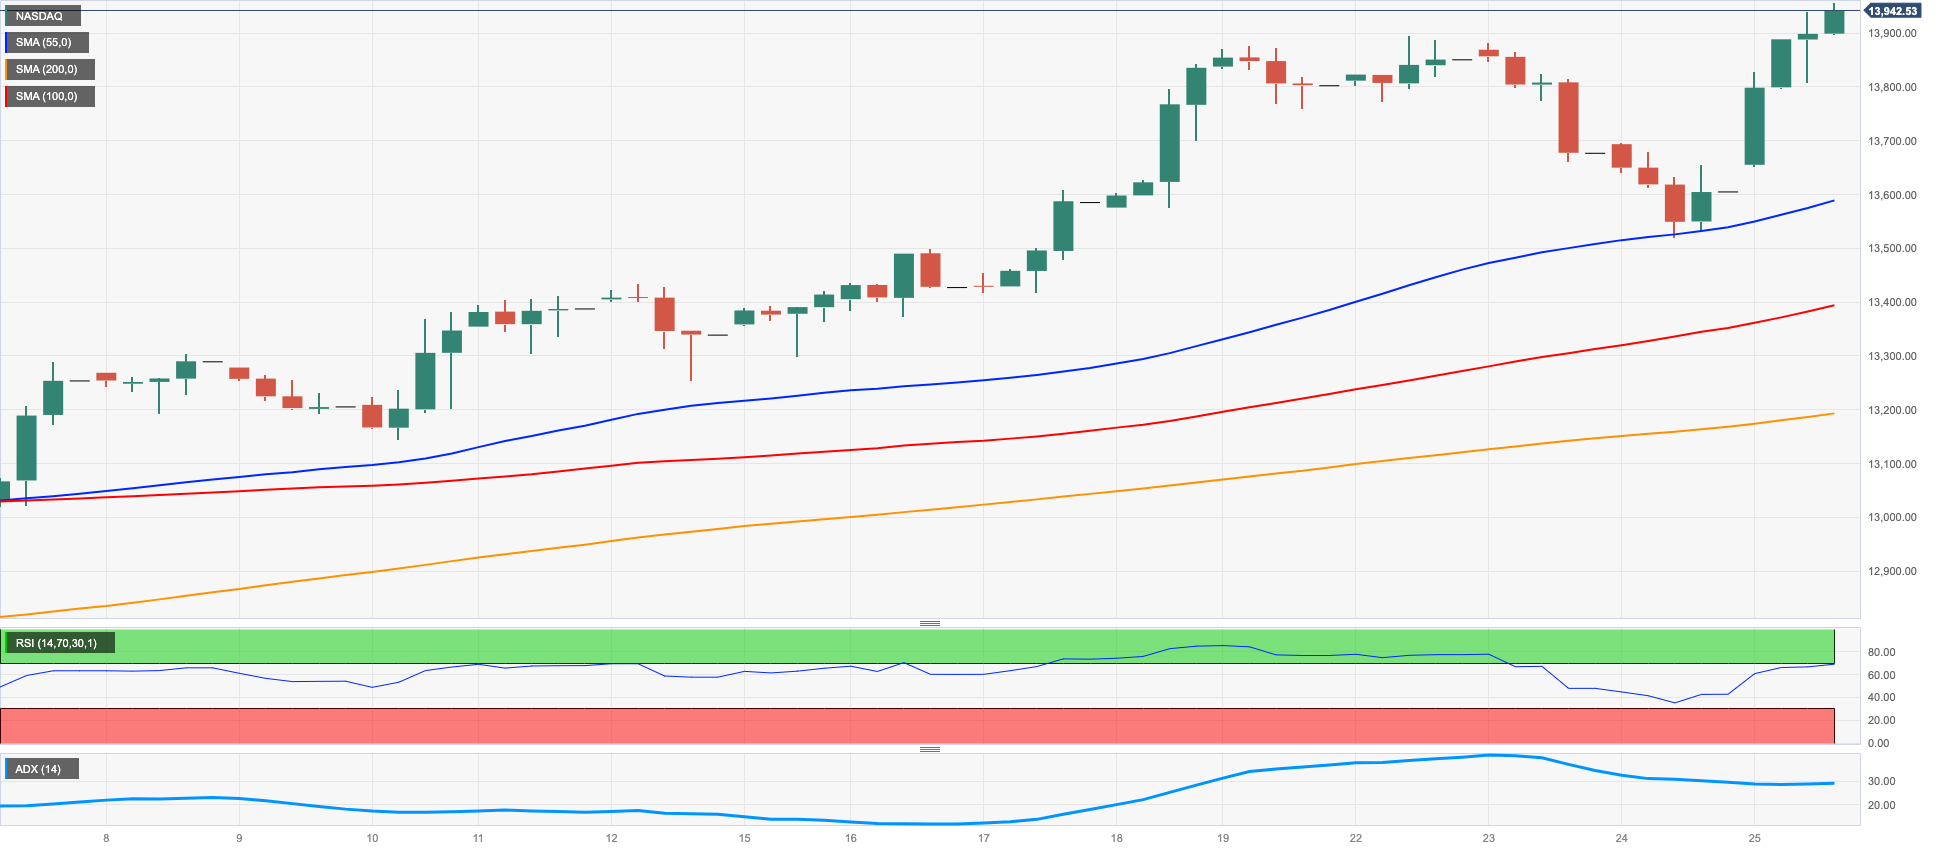
Tech equities measured by the Nasdaq 100 edged higher and clinched new 2023 peaks just below the 14000 mark on Thursday, leaving behind at the same time two consecutive daily pullbacks.
Indeed, the tech sector managed to offset debt ceiling uncertainty in combination with the stronger dollar and higher yields and advanced sharply on the back of auspicious forecasts from megacap Nvidia as well as the AI sector.
If sellers take control of sentiment again and the Nasdaq 100 begins to fall, the 55-day line SMA at 12981 should provide initial support before the May low of 12938 (May 4) is reached. This level is supported by the April low of 12724 (April 25) ahead of the 200-day line SMA at 12127, followed by the March low of 11695 (March 13) and the weekly lows of 11550 (January 25) and 11251 (January 19). A deeper decline could threaten the 2023 low at 10696 (Jan 6). On the upside, the immediate hurdle is the 2023 high at 13893 (May 22). If this uptrend continues, the next target could be the March 2022 high at 15265 (March 29). On the daily chart, the RSI has broken through the 58 area.
Top Gainers: NVIDIA, Synopsys, AMD
Top Losers: Dollar Tree, Illumina, Intel
Resistance levels: 13961 14277 15161 (4H chart)
Support levels: 13520 13289 12938 (4H chart)
DOW JONES
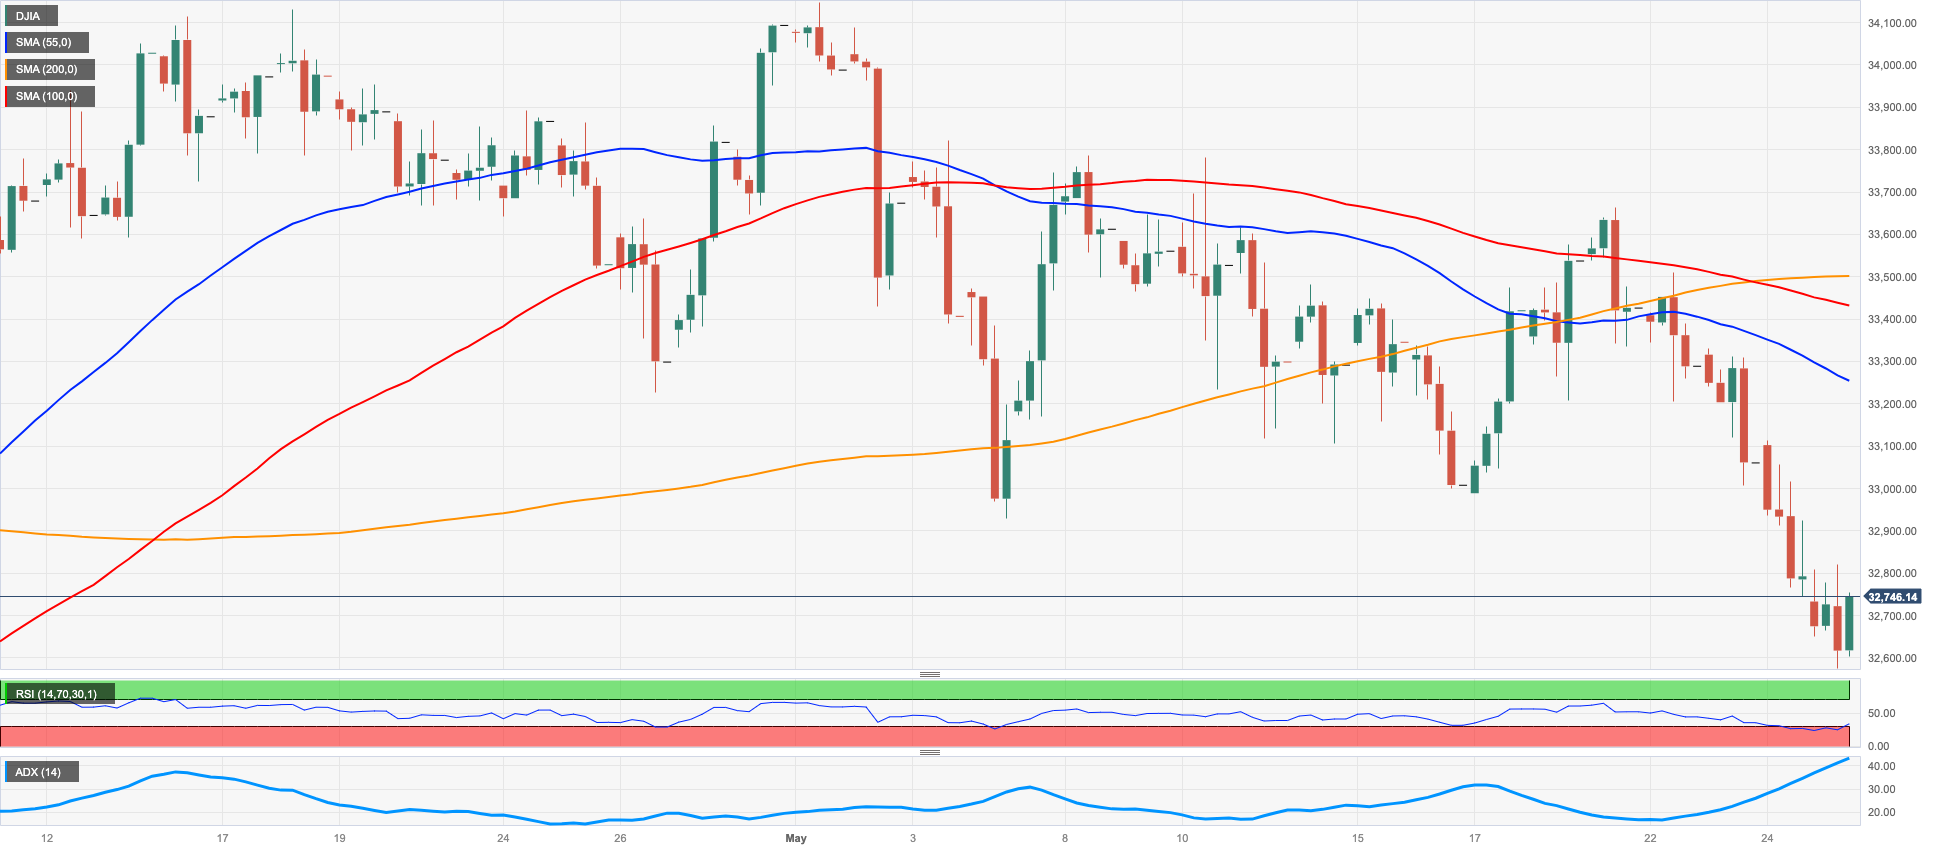
Another negative performance of US equities tracked by the Dow Jones forced the index to revisit the 32500 region for the first time since late March on Thursday. The strong knee-jerk, however, fizzled out towards the end of the session in Wall St.
The index continued its slide for the eighth straight session as uncertainty over the still-unresolved debt ceiling persisted. After the latest negotiations, officials were expected to leave Washington without an agreement to avoid a government default. It is worth noting that Congress must raise or suspend the debt ceiling by early June or the U.S. risks defaulting on its obligations.
Meanwhile, market jitters have intensified after ratings agency Fitch put the U.S. on notice of a possible downgrade in light of the ongoing uncertainty.
All in all, the Dow Jones dropped 0.10% to 32768, the S&P500 rose 0.66% to 4142, and the tech-reference Nasdaq Composite advanced 1.58% to 12679.
The potential for additional losses looms over the Dow Jones now that it has broken below the crucial 200-day SMA at 32774. Further declines could lead to the 2023 low of 31429 (March 15) ahead of the 2022 low of 28660 (October 13). On the opposite side, if the index moves upwards, the first possible target is the weekly high at 33652 (May 19) followed by the May peak at 34257 (May 1), the 2023 high at 34342 (January 13), and the December 2022 high at 34712 (December 13). If the index surpasses this level, it may accelerate towards the April 2022 top of 35492 (April 21). The RSI lost the grip and breached 37.
Top Performers: Microsoft, Apple, Goldman Sachs
Worst Performers: Intel, Walgreen Boots, Verizon
Resistance levels: 33335 33772 34257 (4H chart)
Support levels: 32586 31805 31429 (4H chart)
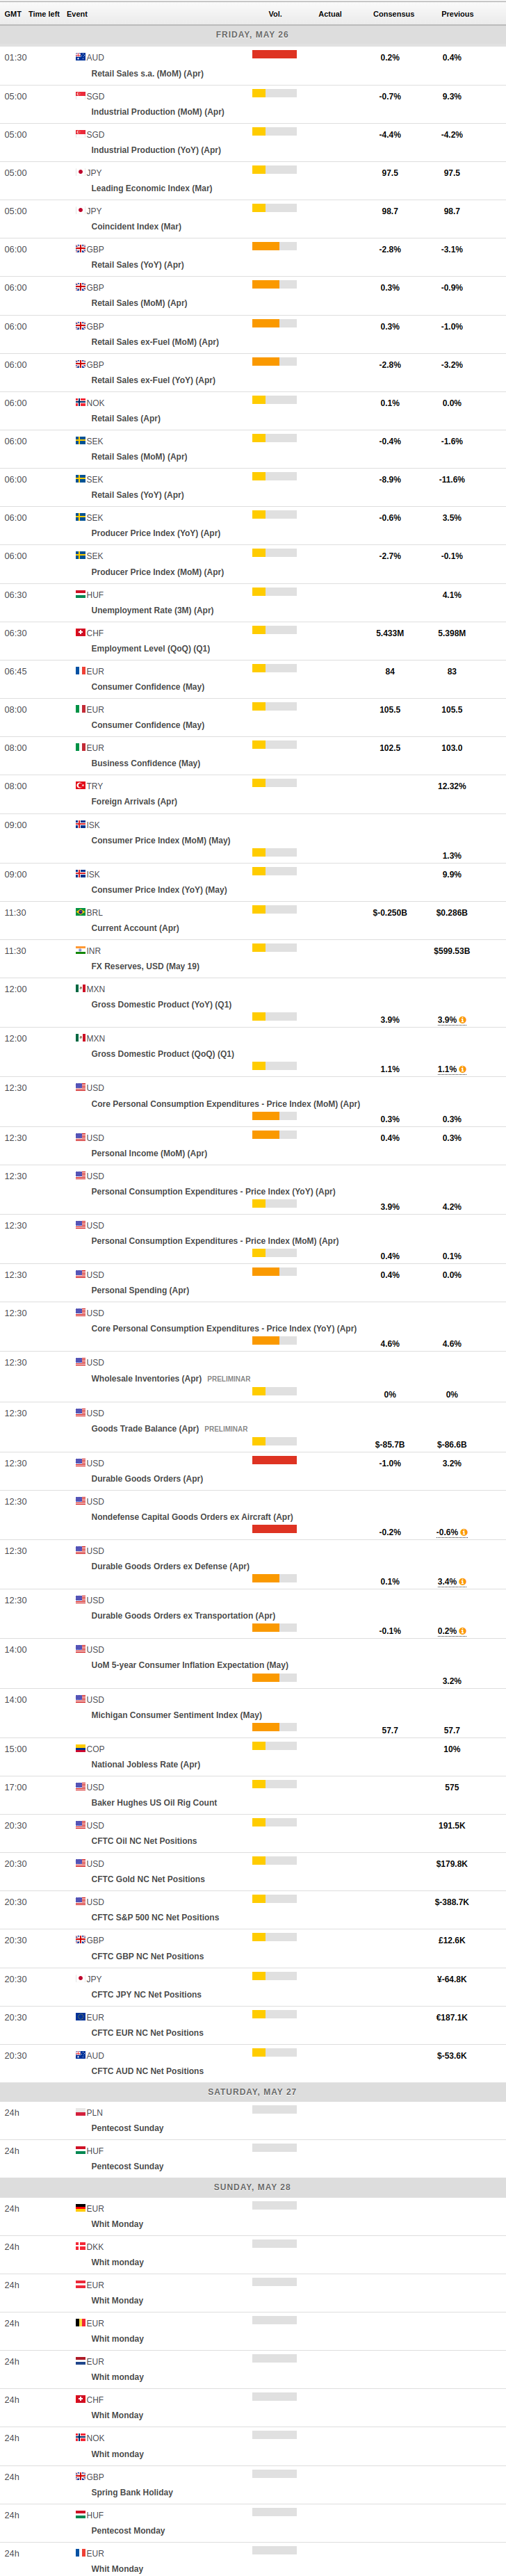
MACROECONOMIC EVENTS
All Information & Updates provided by:

All information relating to the financial markets available on this page has been prepared and issued by FXStreet (Forexstreet SL, Spain, Reg: B62498233) on the basis of publicly available information and all information believed to be reliable and does not conflict with Kuwaiti local laws, and all necessary care has been taken to before the company to ensure that the facts mentioned are correct from the source.
NCM Investment nor any of its directors or employees shall in any way be held responsible for the contents of this news, and the information contained on this page is intended only to provide clients with publicly available information and should not be construed as investment advice, report or analysis and/or constitute an offer or invitation to buy or sell financial instruments of any kind.
RISK WARNING: Forex and CFDs are highly risky leveraged products, as losses can exceed deposits. Please ensure you understand all the risks and take independent advice if necessary. NCM will segregate the clients based on the criteria of the regulator and its bylaws. NCM does not provide any advisory service; the material published does not constitute advice or a recommendation for a transaction in any financial instrument. NCM accepts no responsibility for any use of the content presented and any consequences of that use. Anyone acting on the information provided does so at their own risk.