
- Contact Us:
-

-

-

-


Daily Market Updates
29 May 2023
USDJPY
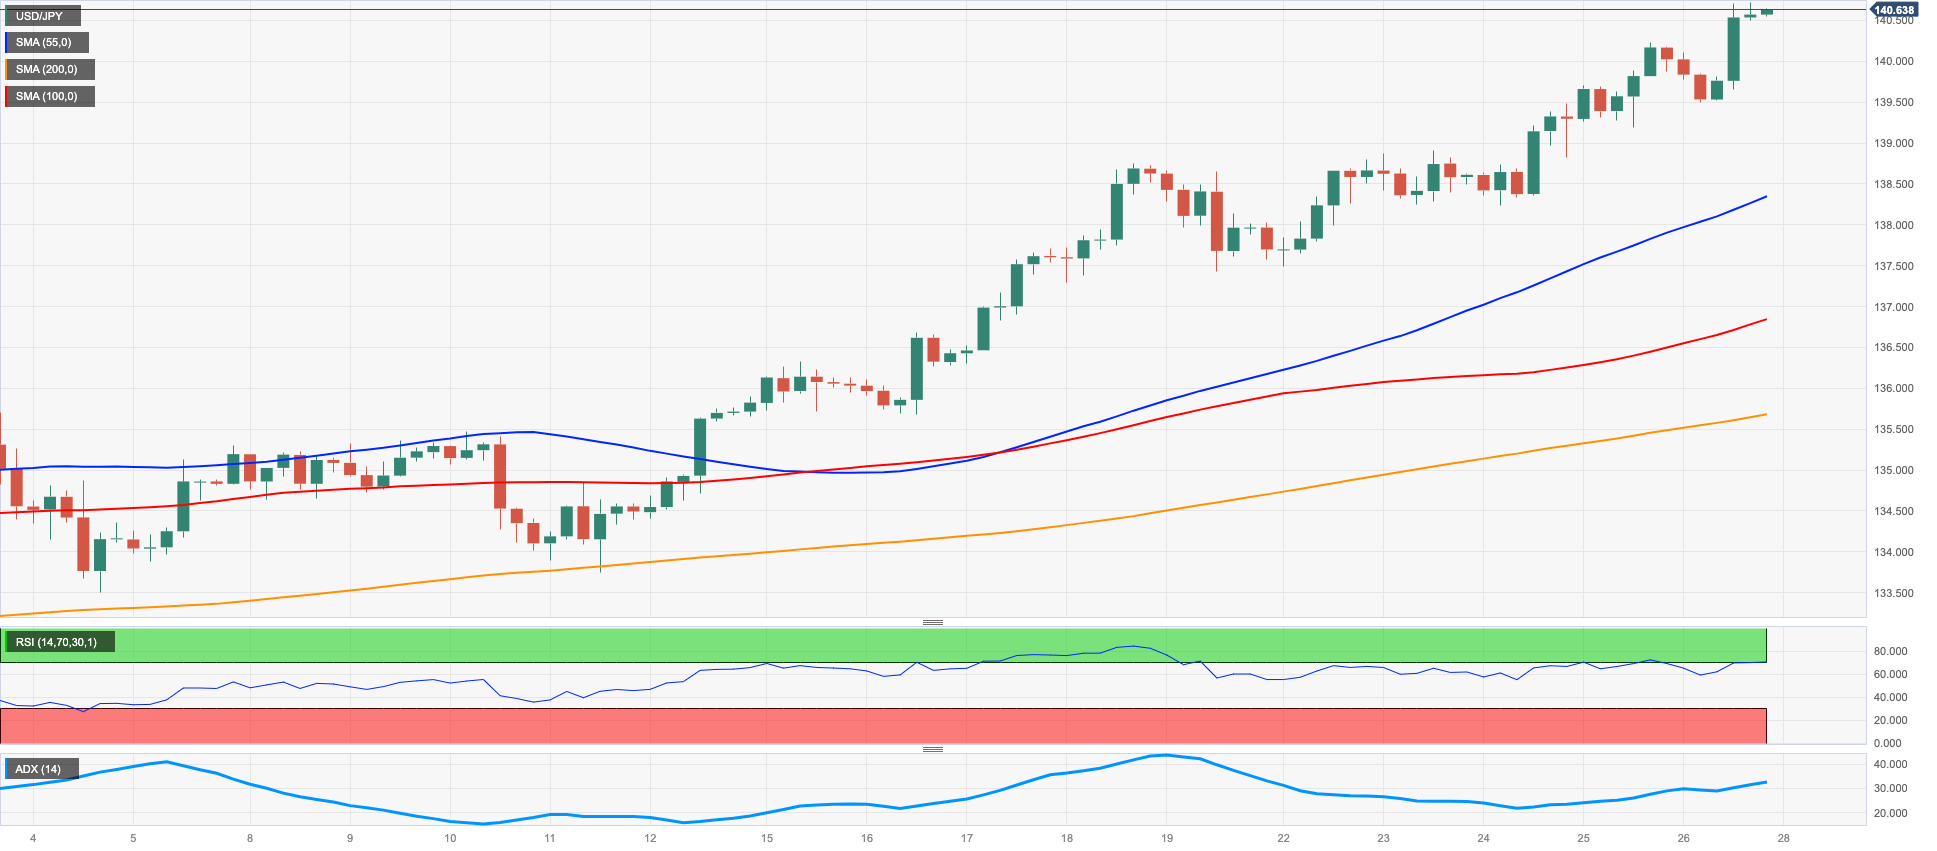
Another positive session saw USD/JPY surpass the key hurdle at 140.00 the figure for the first time since mid-November 2022, extending the weekly gains for the third time in a row.
The improved tone in the risk complex favoured the continuation of the selling pressure in the Japanese yen, which was further exacerbated by the mixed note in US yields, where the short end of the curve rose to fresh highs near 4.65%, levels last seen in mid-March.
In the Japanese money market, the JGB 10-year yields reversed part of the recent uptrend and retreated to the 0.41% region.
Data-wise, in Japan, the headline Tokyo CPI rose 3.2% YoY in May and 3.2% YoY when it came to the Core CPI. In addition, final March figures showed the Coincident Index improving marginally to 98.8 and the Leading Economic Index easing to 97.7.
The next resistance for USD/JPY is at the 2023 high at 140.72 (May 26). If the pair clears the latter, it could retest the weekly tops of 142.25 (Nov 21, 2022) and 148.84 (October 31 2022). In contrast, initial support emerges at the crucial 200-day SMA at 137.21 before reaching the preliminary 55- and 100-day SMAs at 134.35 and 133.49, respectively. Further south, the pair is likely to hit the weekly low of 133.01 (April 26), followed by minor support at 132.01 (April 13) and the April low of 130.62 (April 5). A deeper move should see the March low of 129.63 (March 24) and the February low of 128.08 (February 8) come to the fore, followed by the 2023 low of 127.21 (March 16). The daily RSI remained within the overbought zone near 73.
Resistance levels: 140.72 141.61 142.25 (4H chart)
Support levels: 138.22 137.42 135.64 (4H chart)
GBPUSD
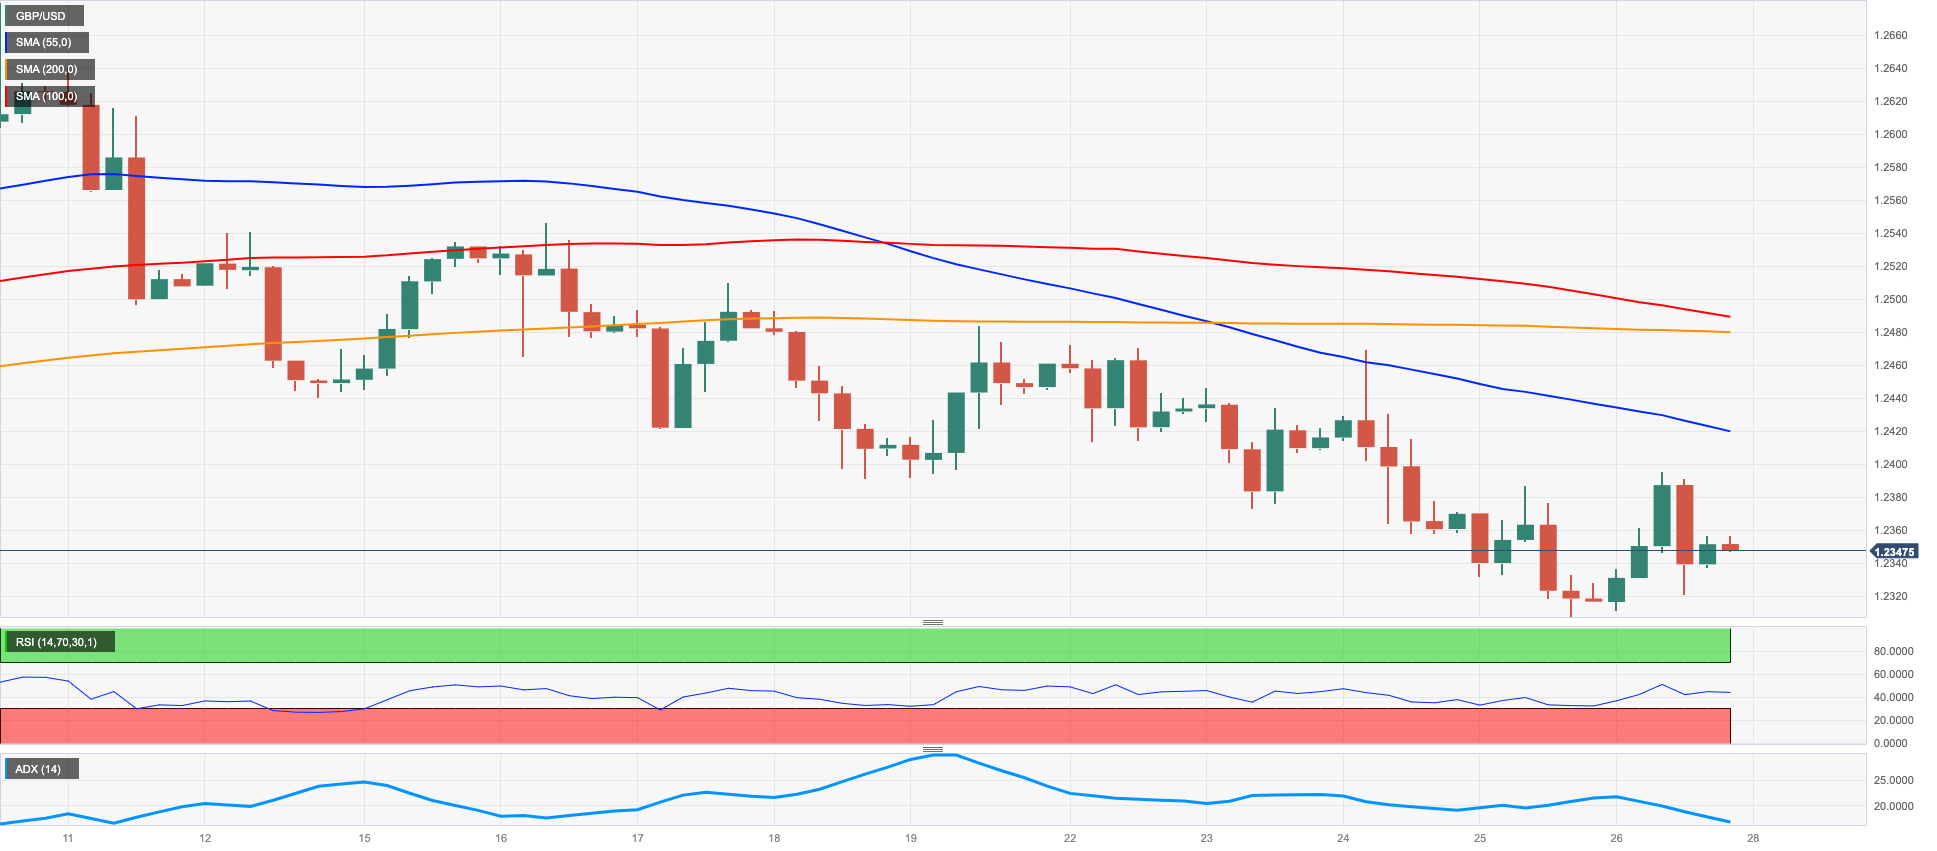
GBP/USD reversed four consecutive daily losses and managed to print decent gains in the 1.2340/50 range on Friday. Despite the daily rebound, Cable maintained a negative tone for the third straight week so far.
The British pound traded mostly in a positive fashion throughout the session against the backdrop of quite a volatile session in the greenback, which regained traction soon after the firmer-than-expected US data releases.
The sterling also strengthened following auspicious prints from UK Retail Sales in April, which expanded at a monthly 0.5% and 0.8% MoM when excluding the Fuel component.
In the event that the GBP/USD breaks below its May low of 1.2308 (May 25), it may need to revisit its provisional 100-day SMA at 1.2286 before reaching the April low of 1.2274 (April 3). If a further decline occurs, the pair might then test the significant 200-day SMA at 1.1976 before reaching the 2023 bottom of 1.1802 (March 8). On the flip side, extra gains will first need to surpass the weekly high at 1.2546 (May 16), followed by the 2023 peak of 1.2679 (May 10). Buyers may subsequently set their sights on the 200-week SMA at 1.2864 and the psychological milestone of 1.3000. Additionally, the daily RSI leapt past the 40 yardstick.
Resistance levels: 1.2395 1.2469 1.2510 (4H chart)
Support levels: 1.2308 1.2274 1.2189 (4H chart)
AUDUSD
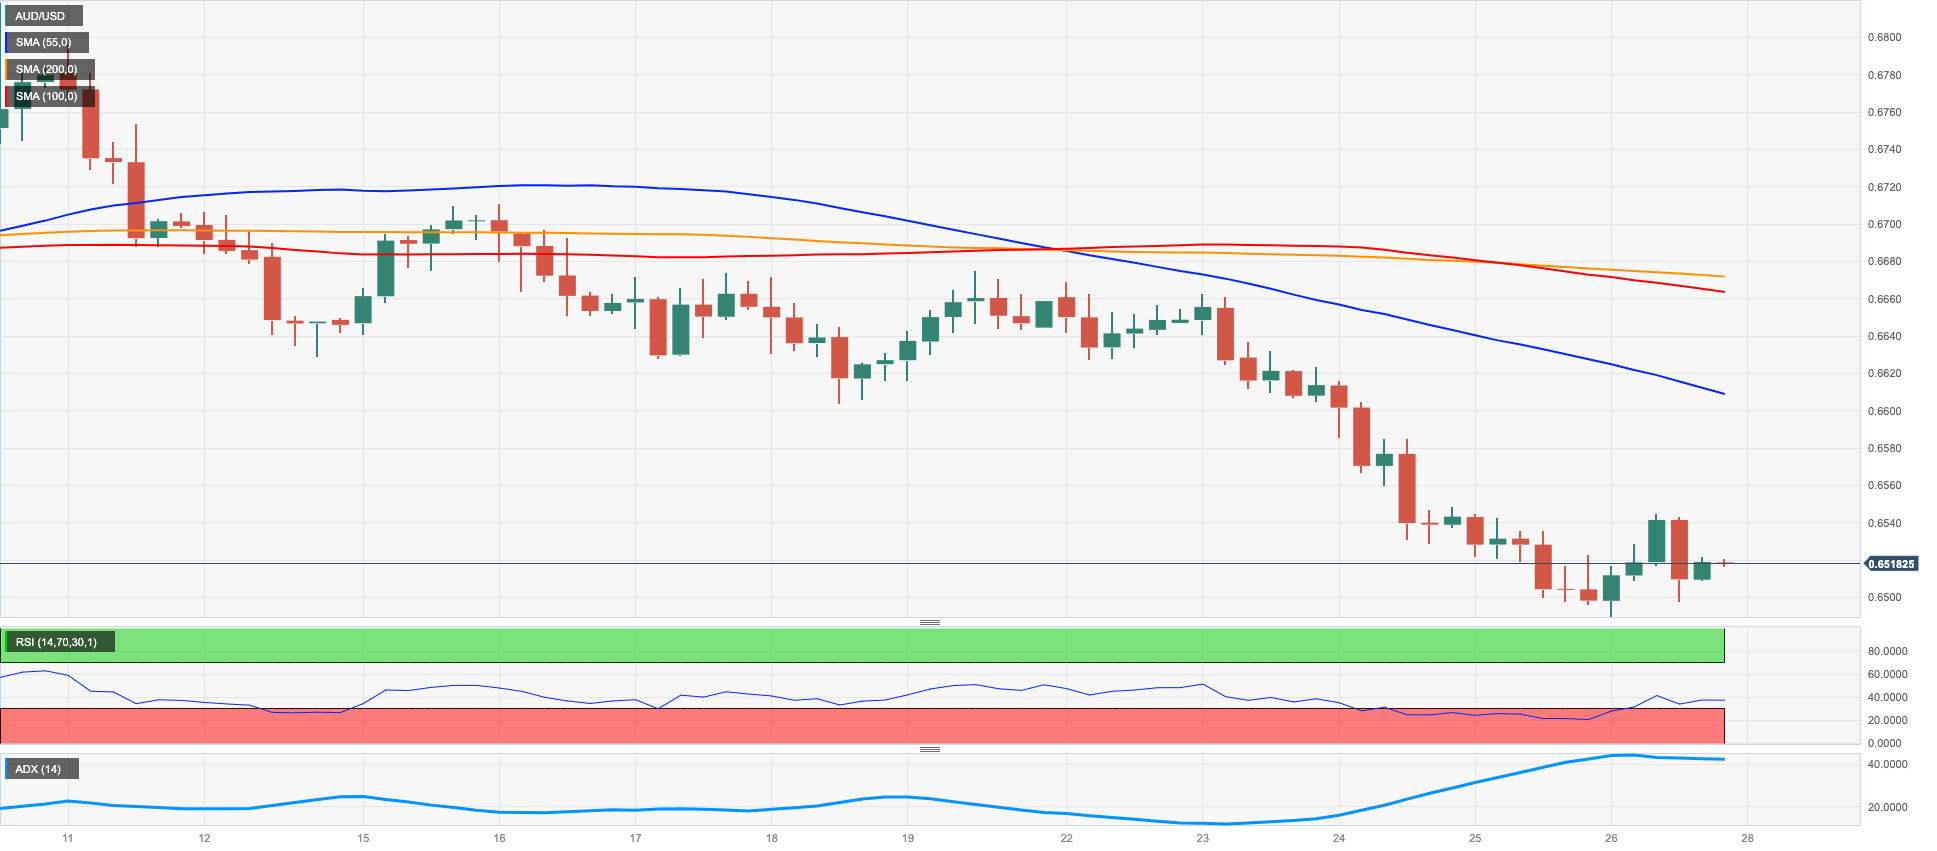
In line with the rest of its risk-linked peers, the Aussie dollar left behind part of the recent bearish mood and motivated AUD/USD to close Friday’s session with decent gains in the low-0.6500s following earlier 2023 lows around 0.6490.
Further support for the pair came in response to the generalized positive bias in the commodity universe, which saw marginal losses in iron ore and further recovery in copper prices.
In Oz, advanced Retail Sales are expected to come in flat in April (from a monthly expansion of 0.4% seen in the previous month).
The loss of the 2023 low at 0.6490 (May 26) could motivate AUD/USD to revisit weekly lows of 0.6386 (November 10, 2022) and 0.6272 (November 3). Having said that, there is an immediate hurdle at the key 200-day SMA at 0.6702, ahead of the May high of 0.6818 (May 10) and the crucial psychological mark of 0.7000. Above this level, the weekly top of 0.7029 (February 14) appears ahead of the 2023 peak of 0.7157 (February 2). The daily RSI rebounded past the 35 yardstick.
Resistance levels: 0.6544 0.6612 0.6675 (4H chart)
Support levels: 0.6490 0.6386 0.6272 (4H chart)
GOLD
Renewed optimism around the US debt ceiling issue and the corrective session in the greenback, all coupled with the mixed performance in US yields across the curve, lent support to the precious metal and sparked a decent rebound at the end of the week.
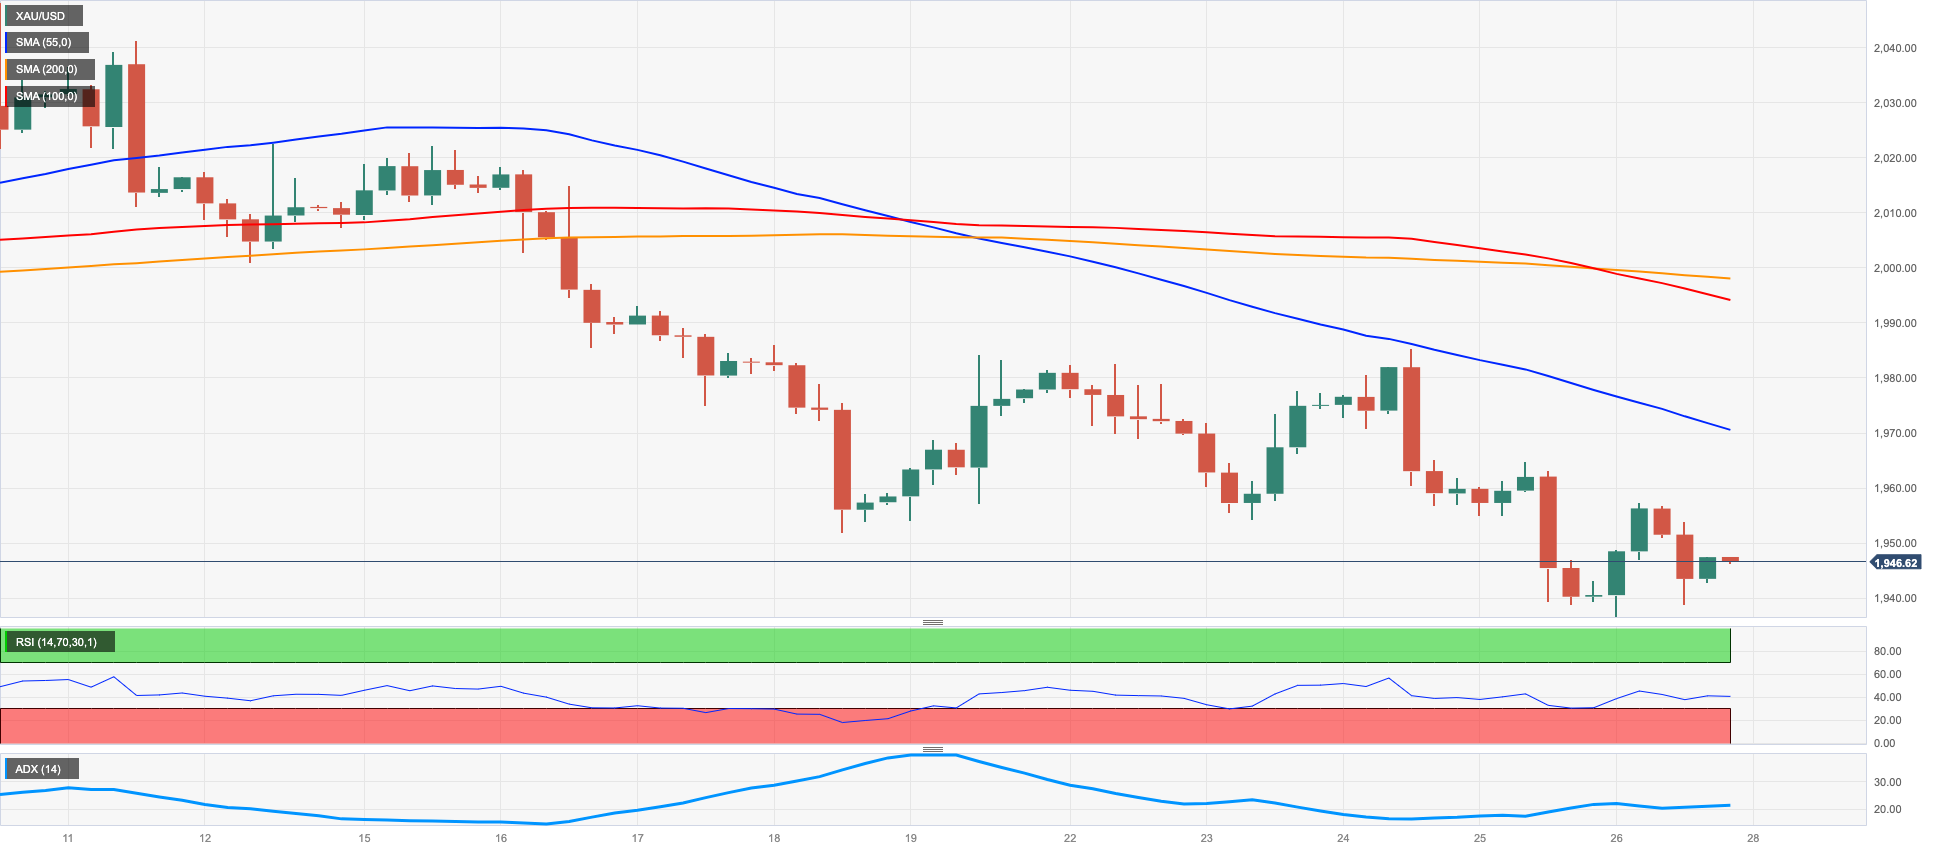
Indeed, the price of an ounce troy of gold regained composure after hitting fresh 9-week lows around the $1935 region.
Friday’s mild rebound did not, however, prevent the yellow metal from closing the third consecutive week with losses, while potential further tightening by the Federal Reserve at the June gathering should keep bullion under scrutiny in the next sessions.
Despite Friday’s bounce, gold remains under pressure for the time being. That said, a drop below the May low of $1936 (May 25), which appears to be supported by the transitory 100-day SMA at $1934, should expose a probable decline to the 200-day SMA at $1829, far before the 2021 bottom of $1804 (February 28). Meanwhile, intermittent recoveries may find temporary resistance at the 55-day SMA at $1984 before reaching the crucial $2000 level. There are no major resistance levels until the 2023 peak of $2067 (May 4), which is supported by the March 2022 high of $2070 (March 8) and the unrivaled top of $2075 (August 7, 2020).
Resistance levels: $1964 $1985 $2000 (4H chart)
Support levels: $1936 $1885 $1809 (4H chart)
CRUDE WTI
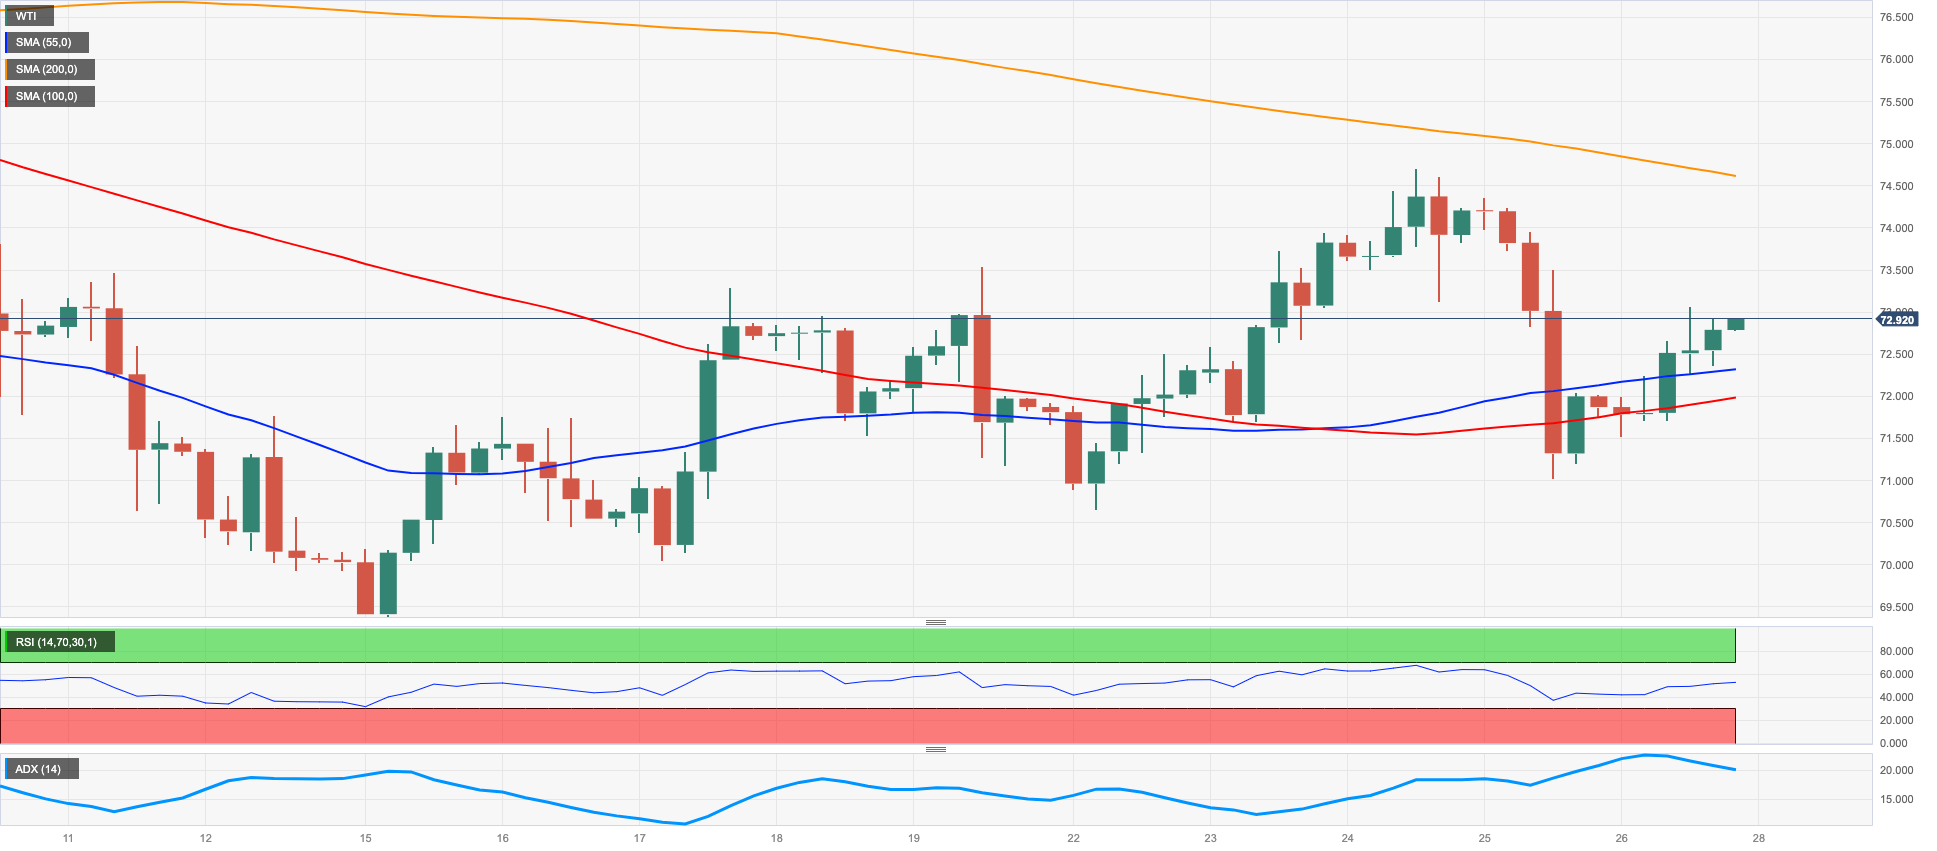
WTI prices ended the second week with gains near the $73.00 mark per barrel on the back of fresh optimism surrounding an apparent closer deal around the US debt ceiling issue.
The knee-jerk in the greenback also collaborated with the better tone in the commodity, although reignited speculation over potential further tightening by the Fed next month and fresh uncertainty around the next OPEC+ meeting due next week kept traders’ sentiment on the cautious side at the end of the week.
In the docket, the US oil rig count went down by 5 to 570 active oil rigs, according to driller Baker Hughes, in the week to May 26.
Apparently the WTI has been moving within a consolidative range this week. The breakout of this theme exposes the weekly high of $74.69 (May 24) ahead of the temporary 100-day SMA at $75.90, trailed by the key $80.00 boundary and the 200-day SMA at $79.86. Moreover, the 2023 pinnacle of $83.49 (April 12) and the November 2022 top of $93.73 (November 7) are significant. In the event that bears retake control, the 2023 low of $63.61 (May 4) emerges as a key contention area seconded by the December 2021 low of $62.46 (December 2), all preceding the basic $60.00 per barrel.
Resistance levels: $74.69 $75.12 $76.89 (4H chart)
Support levels: $70.94 $70.01 $69.38 (4H chart)
GER40
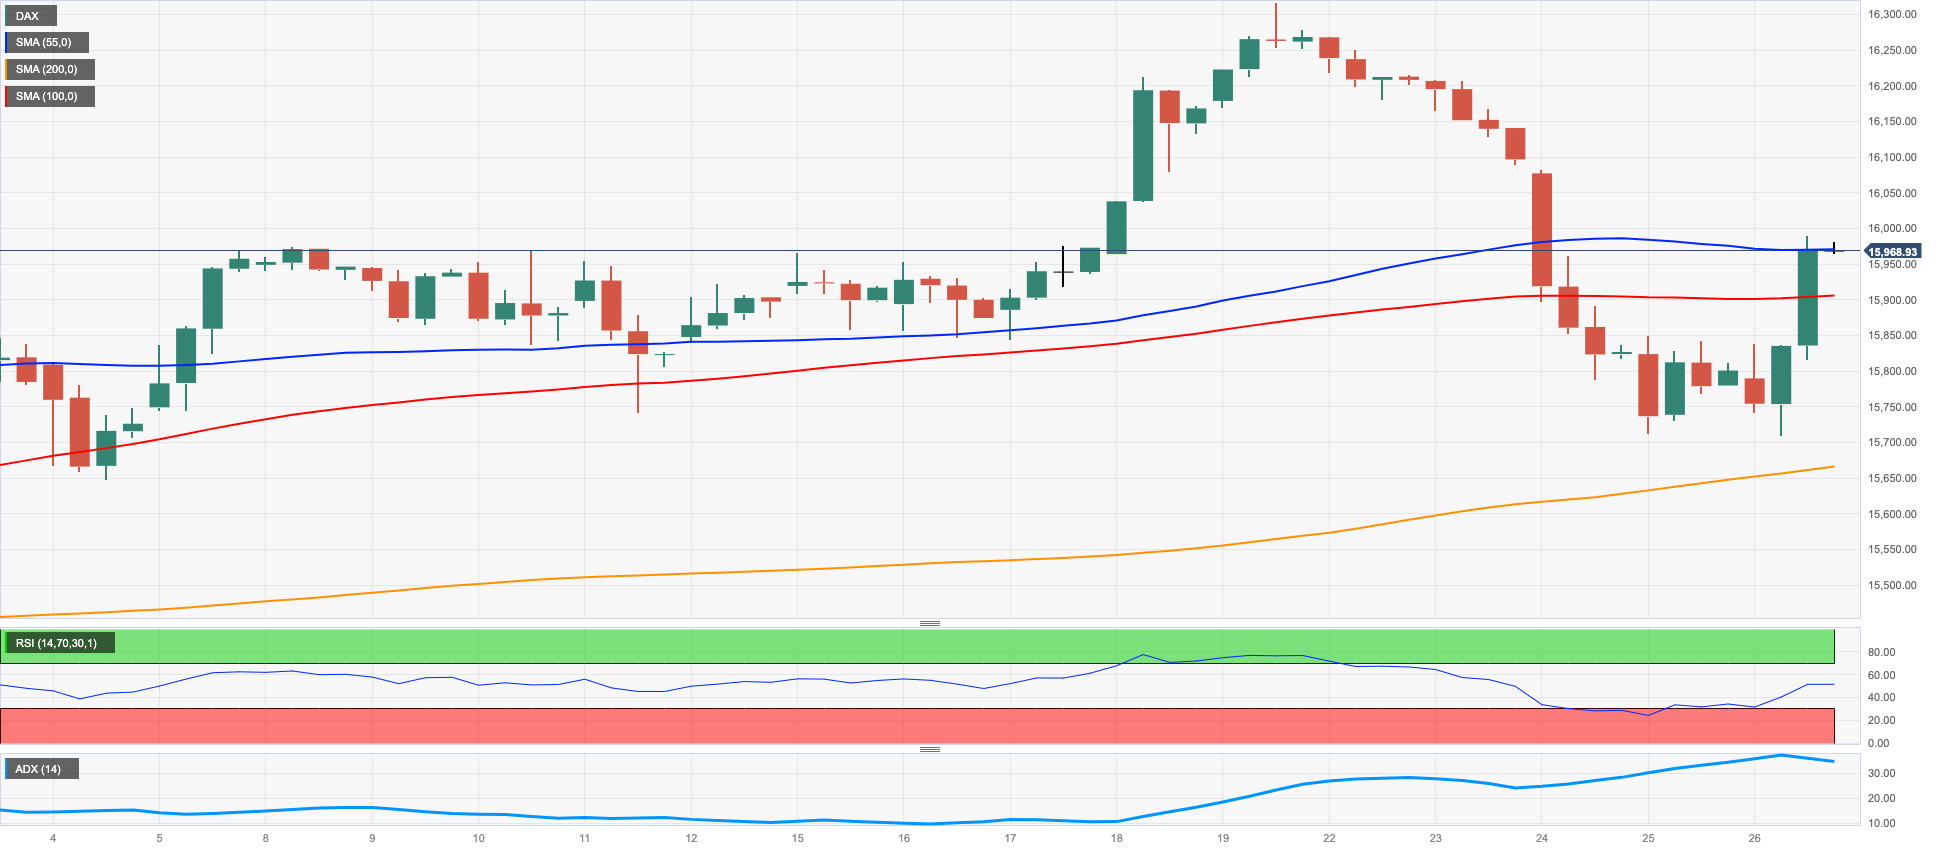
Rising optimism on a potential agreement around the US debt ceiling negotiations boosted markets’ sentiment at the end of the week and encouraged the German reference DAX40 to reverse four sessions in a row with losses and close Friday’s session just beyond the key 16000 mark.
On Friday, the White House and Republican teams persisted in their efforts to reach an agreement regarding federal spending and the increase in the government's $31.4 trillion debt ceiling. While the negotiators from both sides made some progress in narrowing their differences, they remained at odds over crucial matters. Meanwhile, the Treasury Department indicated that there was still additional time before a potential default by the United States.
In Germany, in the meantime, investors’ morale appeared somewhat improved following the disappointing prints from the Q1 GDP released on Thursday, which regurgitated the likelihood of a technical recession this year.
In the domestic money market, the 10-year Bund yields gave away some ground and receded to the proximity of 2.50% following earlier tops past 2.55%.
The continuation of the recovery in the DAX40 should retarget the all-time high at 16331 (May 19). The other way around, the initial support emerges at the weekly low at 15726 (May 25) before reaching the May low at 15662 (May 4), an area reinforced by the interim 55-day SMA at 15641. Further down appears the April low at 15482 (April 5), just before the 100-day line SMA at 15452. Extra losses could face minor support levels such as 14809 (March 24) and 14458 (March 20). In addition, the important 200-day SMA at 14426 could play an important role in more significant pullbacks. The RSI on the daily chart climbed past the 53 zone.
Best Performers: Infineon, Continental AG, Dr Ing hc F Porsche AG Pfd
Worst Performers: Vonovia, RWE AG ST, Deutsche Telekom AG
Resistance levels: 16008 16331 17000? (4H chart)
Support levels: 15726 15662 15603 (4H chart)
NASDAQ
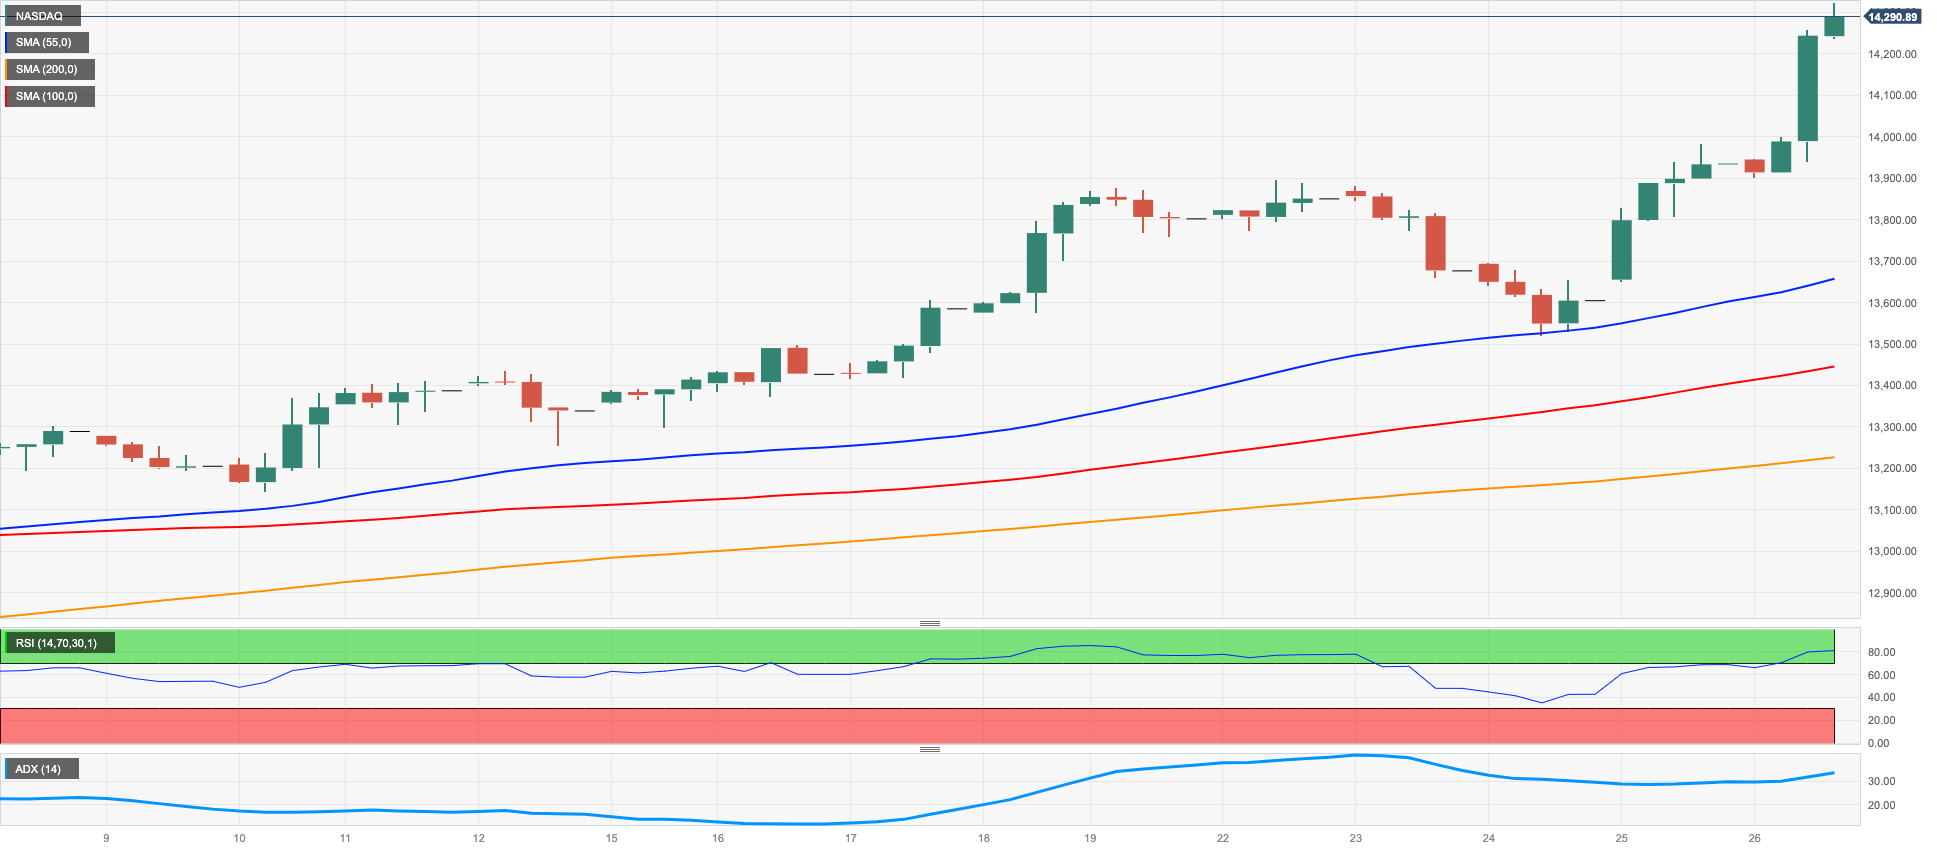
The tech sector extended the optimism and motivated the benchmark Nasdaq 100 to record new highs at levels last visited in early April 2022, around the 14300 zone.
In fact, tech equities saw another day of gains due to the excitement surrounding artificial intelligence, while extra legs came in response to Marvell Technology's announcement that their revenue in 2024 would ‘at least double’ from the previous year, thanks to increased demand for AI.
That announcement followed news from chip maker Nvidia after the company expressed similar sentiments earlier in the week.
Also collaborating with the upbeat sentiment among traders, US negotiators appear to have left the door open to a potential agreement over the debt ceiling issue sooner rather than later.
The rally in the Nasdaq 100 appears unabated so far. That said, the surpass of the 2023 peak at 14329 (May 26) could pave the way for a probable advance to the March 2022 high at 15265 (March 29). On the opposite side, there is immediate contention at the weekly low at 13520 (May 24) followed by the 55-day SMA line at 13055 and the May low of 12938 (May 4). This support level is further reinforced by the April low of 12724 (on April 25), and comes ahead of the 200-day SMA at 12136, the March low of 11695 (March 13), and the weekly lows of 11550 (January 25) and 11251 (January 19). A more significant decline could potentially threaten the 2023 low at 10696 (January 6). The everyday RSI advanced further into the overbought territory past the 74 yardstick.
Top Gainers: Marvell, PDD Holdings DRC, Broadcom
Top Losers: O’Reilly Automotive, Vertex, Verisk
Resistance levels: 14329 15161 15265 (4H chart)
Support levels: 13520 13348 12938 (4H chart)
DOW JONES
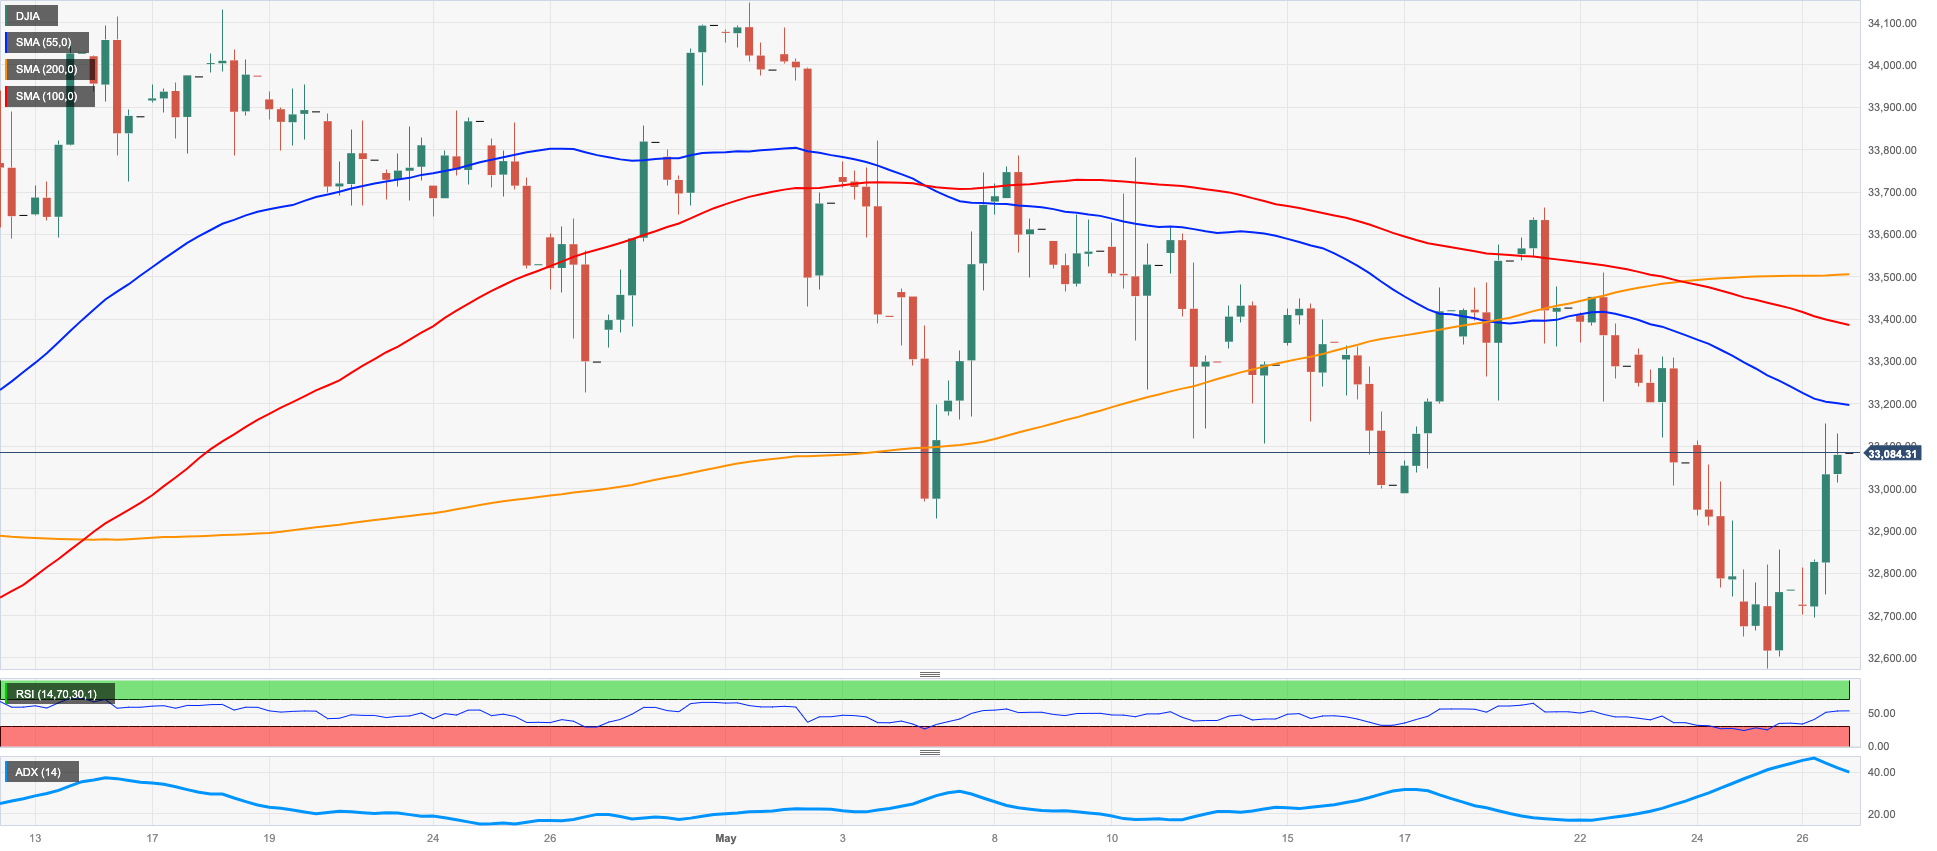
The Dow Jones managed to regain some composure and advanced markedly for the first time after five consecutive daily declines on Friday, including a new monthly low near the 32500 region printed on May 25.
The broad-based optimism among market participants came at a time when US negotiators appeared to be getting closer to a deal to raise the debt ceiling in the United States and set a 2-year spending cap, setting aside some concerns over the horrendous effects that a US default could have on the global markets.
Overall, the Dow Jones rose 1.00% to 33093, the S&P500 advanced 1.30% to 4205, and the tech-benchmark Nasdaq Composite gained 2.19% to 12975.
The recovery in the Dow Jones could get more serious once the weekly high of 33652 (May 19) is cleared ahead of the May peak of 34257 (May 1), the 2023 top of 34342 (January 13), and the December 2022 peak of 34712. (December 13). If the index rises over this level, it might accelerate toward the April 2022 top of 35492. (April 21). On the downside, a drop below the May low at 32586 (May 25) could see losses accelerate to the 2023 bottom of 31429 (March 15), which would be higher than the 2022 low of 28660. (October 13). The RSI picked up pace and trespassed the 45 barrier.
Top Performers: Intel, American Express, Salesforce Inc
Worst Performers: Merck&Co, Travelers, Chevron
Resistance levels: 33162 33334 33652 (4H chart)
Support levels: 32586 31805 31429 (4H chart)
MACROECONOMIC EVENTS

All Information & Updates provided by:

All information relating to the financial markets available on this page has been prepared and issued by FXStreet (Forexstreet SL, Spain, Reg: B62498233) on the basis of publicly available information and all information believed to be reliable and does not conflict with Kuwaiti local laws, and all necessary care has been taken to before the company to ensure that the facts mentioned are correct from the source.
NCM Investment nor any of its directors or employees shall in any way be held responsible for the contents of this news, and the information contained on this page is intended only to provide clients with publicly available information and should not be construed as investment advice, report or analysis and/or constitute an offer or invitation to buy or sell financial instruments of any kind.
RISK WARNING: Forex and CFDs are highly risky leveraged products, as losses can exceed deposits. Please ensure you understand all the risks and take independent advice if necessary. NCM will segregate the clients based on the criteria of the regulator and its bylaws. NCM does not provide any advisory service; the material published does not constitute advice or a recommendation for a transaction in any financial instrument. NCM accepts no responsibility for any use of the content presented and any consequences of that use. Anyone acting on the information provided does so at their own risk.