
- Contact Us:
-

-

-

-


Daily Market Updates
30 May 2023
USDJPY
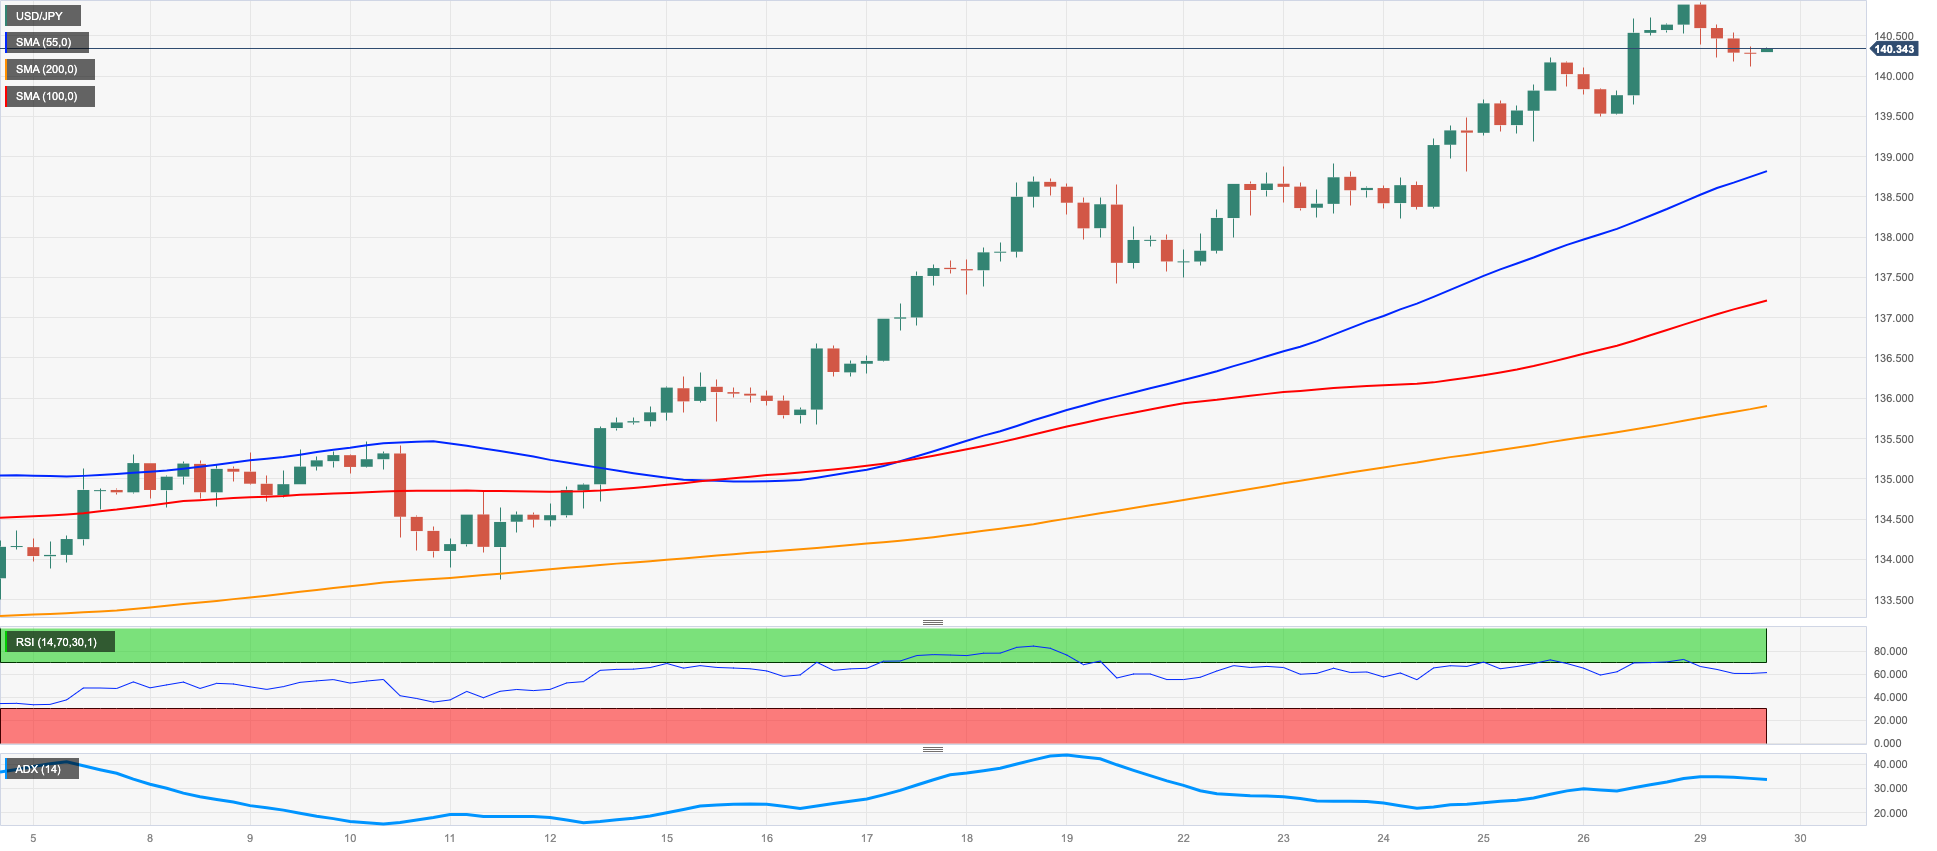
The inconclusive session in the greenback coupled with the lack of activity in the US bond market seems to have been enough to spark a corrective move in USD/JPY and drag it to the vicinity of the 140.00 neighbourhood at the beginning of the week.
Furthermore, spot clinched fresh tops near the 141.00 barrier for the first time since late November 2022 before coming under some moderate selling pressure on Monday.
In the meantime, and following the recent deal on the US debt ceiling, investors should start looking at Friday’s release of the US jobs report to get further details regarding the potential next move by the Fed when it comes to interest rates.
In Japan, the JGB 10-year yields extended the consolidative mood just below the 0.45% area.
The following up-barrier for USD/JPY is at the 2023 high at 140.91 (May 29). Assuming the pair clears the last option, it could retest the week-by-week highest points of 142.25 (November 21 2022) and 148.84 (October 31 2022). Having said that, there is imminent contention at the significant 200-day SMA at 137.22 prior to arriving at the transitory 55-and 100-day SMAs at 134.48 and 133.57, individually. Further south, the pair could revisit the weekly low of 133.01 (April 26), trailed by minor help at 132.01 (April 13) and the April low of 130.62 (April 5). A more profound move ought to see the March low of 129.63 (March 24) and the February low of 128.08 (February 8) come to the front, trailing by the 2023 low of 127.21 (January 16). The day-to-day RSI receded to the vicinity of the 70 threshold.
Resistance levels: 140.91 141.61 142.25 (4H chart)
Support levels: 140.17 139.49 138.22 (4H chart)
GBPUSD
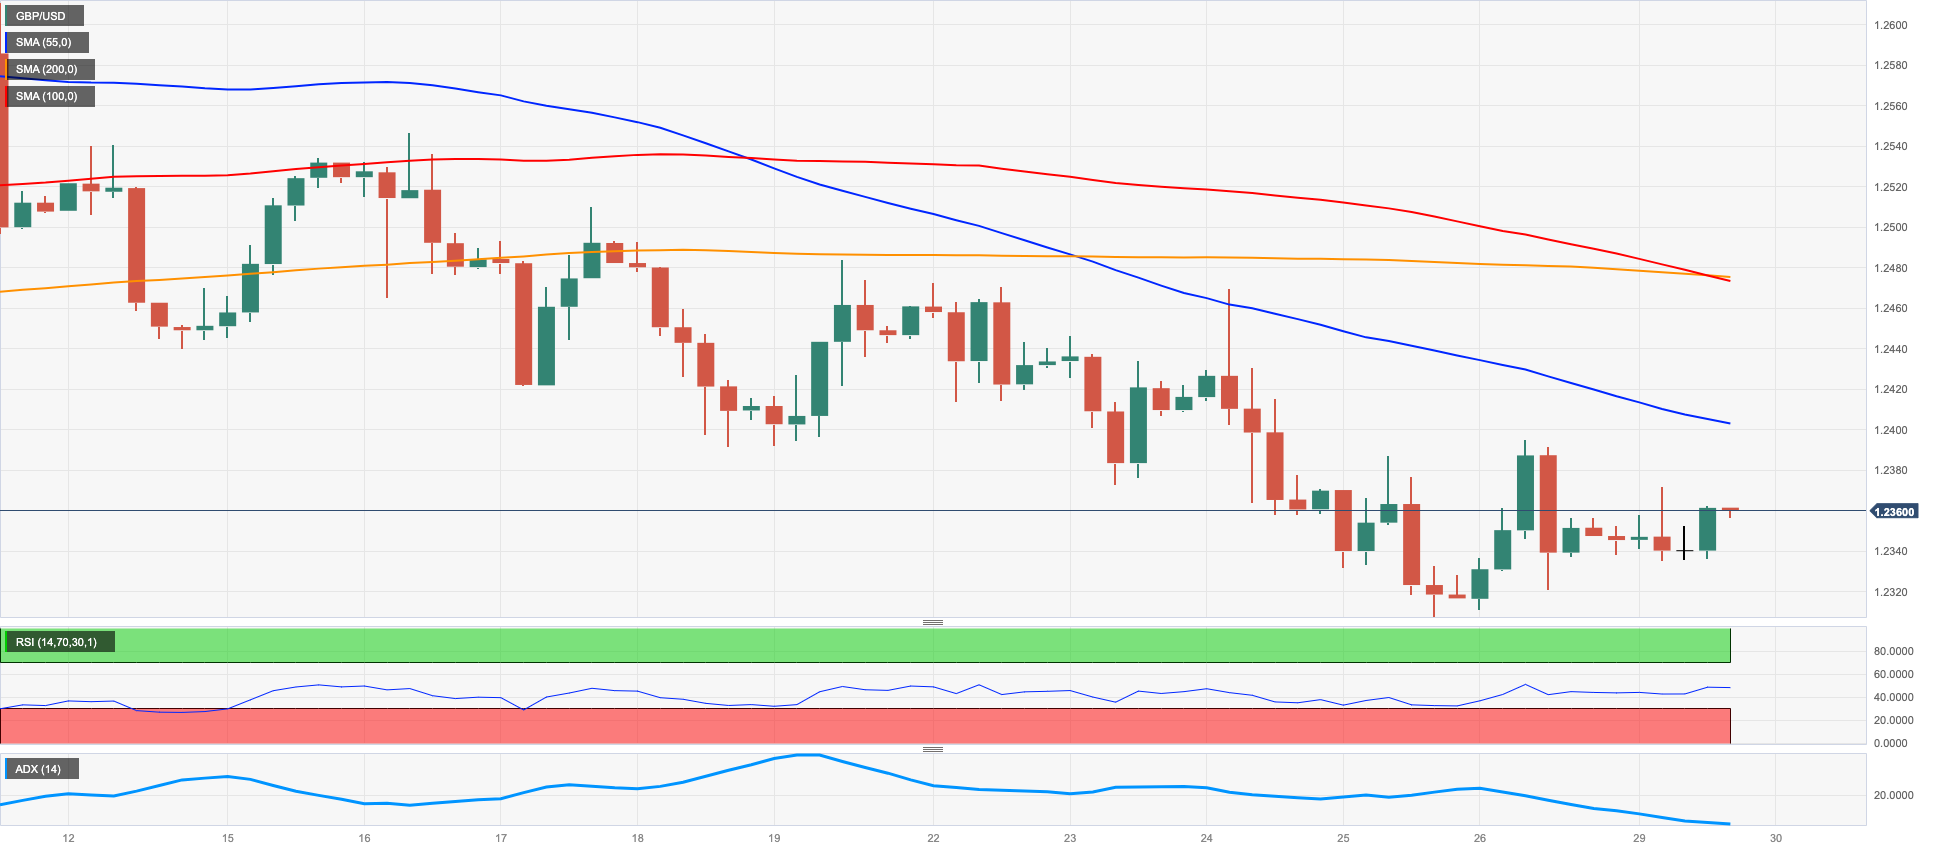
In line with the rest of the risk-associated universe, sterling traded within a narrow range near recent levels vs. the greenback, leaving GBP/USD hovering around the 1.2360/70 region on Monday.
In fact, cable printed humble gains against the backdrop of a broad-based lack of volatility and marginal trading conditions following the extended weekend in the US due to the Memorial Day holiday.
Nothing was scheduled data-wise in the UK calendar on Monday.
If the GBP/USD falls below its May low of 1.2308 (May 25), it could potentially retest its temporary 100-day SMA at 1.2287 before reaching the April low of 1.2274 (April 3). If the pair continues to decline, it may then test the important 200-day SMA at 1.1979 ahead of the 2023 bottom of 1.1802 (March 8). Conversely, if additional gains occur, the pair will first need to surpass the weekly high at 1.2546 (May 16), followed by the 2023 peak of 1.2679 (May 10). Subsequently, buyers may aim for the 200-week SMA at 1.2864 prior to the psychological milestone of 1.3000. The daily RSI improved past the 42 yardstick.
Resistance levels: 1.2395 1.2469 1.2510 (4H chart)
Support levels: 1.2308 1.2274 1.2189 (4H chart)
AUDUSD
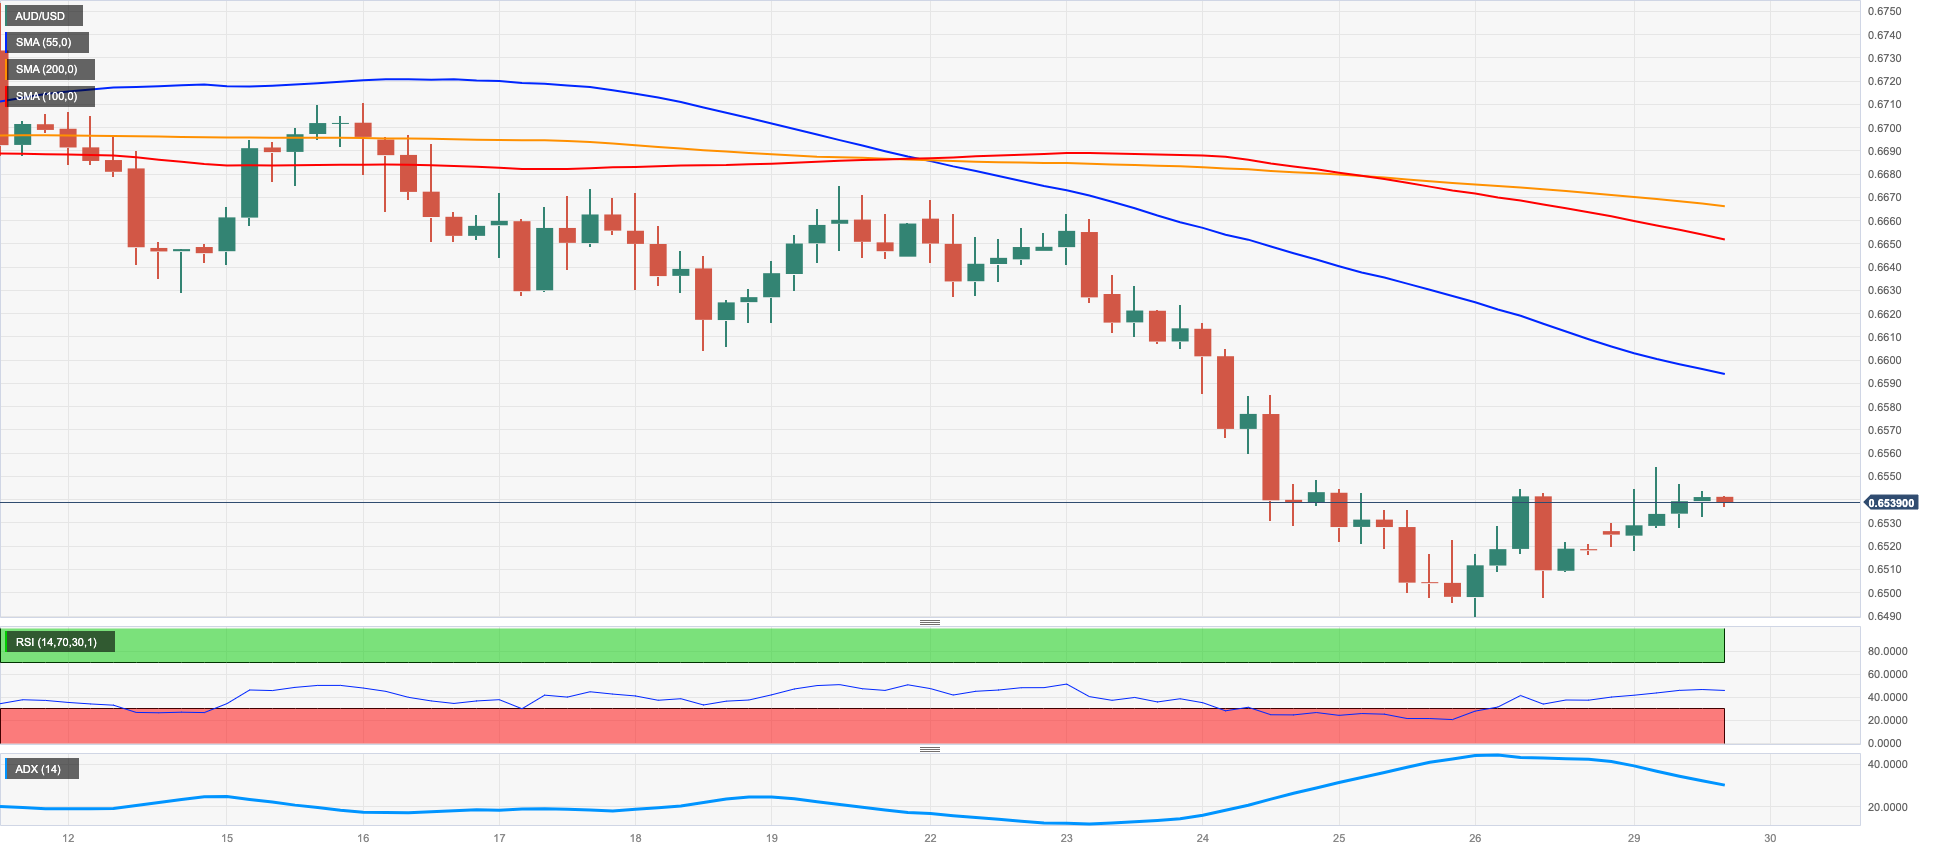
Further optimism encouraged AUD/USD to add to Friday’s gains and rise to 2-day highs around 0.6550 at the beginning of the week.
The second consecutive daily gain in spot came on the back of the irresolute price action in the greenback and the lack of direction in the global markets in response to the inactivity in the US markets.
The Australian calendar was empty on Monday, leaving results from the domestic housing data in the limelight on Tuesday.
The loss of the 2023 low at 0.6490 (May 26) could prompt AUD/USD to revisit the weekly low of 0.6386 (November 10 2022) and the November 2022 low of 0.6272 (November 3). On the flip side, the immediate up-barrier lies at the important 200-day line SMA at 0.6701, ahead of the May high of 0.6818 (May 10) and the crucial psychological level of 0.7000. Above this level, the weekly top of 0.7029 (February 14) appears ahead of the 2023 peak of 0.7157 (February 2). The RSI on the daily chart advanced past the 38 mark.
Resistance levels: 0.6554 0.6598 0.6675 (4H chart)
Support levels: 0.6490 0.6386 0.6272 (4H chart)
GOLD
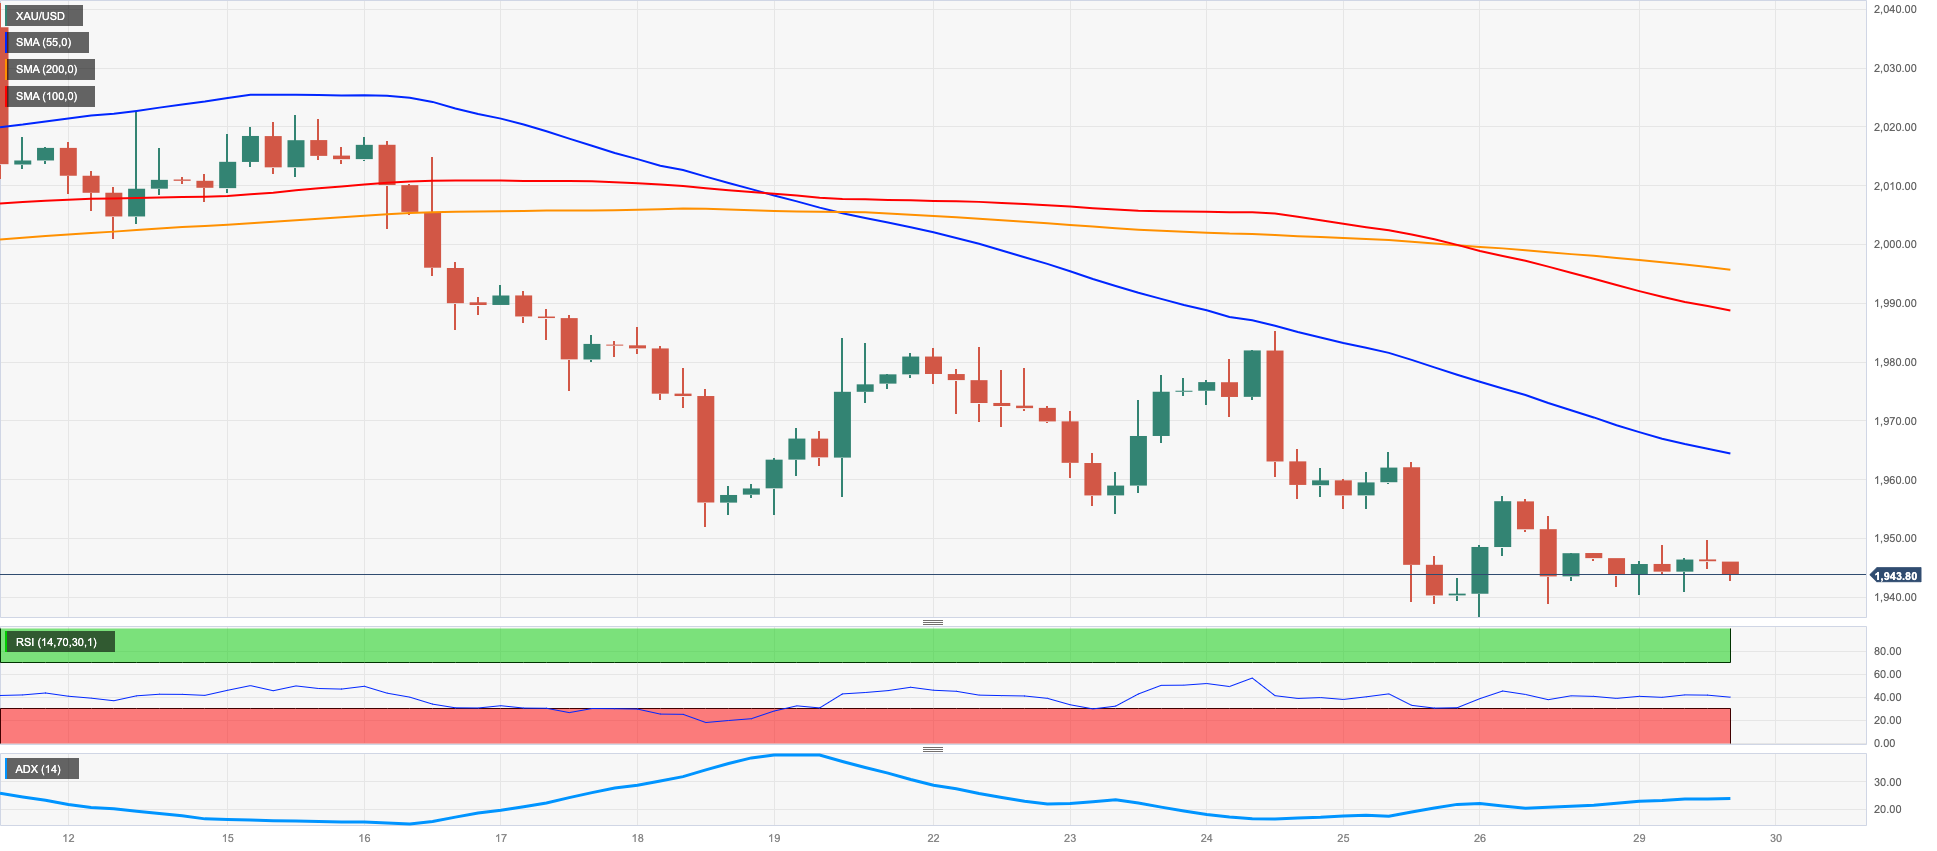
Gold prices traded mildly on the defensive around the $1940 region per ounce troy at the beginning of the week.
The inactivity in US markets, coupled with the lack of direction in global assets and alleviated concerns following positive news on the US debt ceiling front, all kept the price action in the yellow metal somewhat subdued on Monday.
Later in the week, the precious metal is predicted to closely follow the publication of the US jobs report for the month of May due on June 2, which should have a direct impact on the Fed’s decision on the policy rate next month.
In spite of Friday's rebound, gold continues to face downward pressure for the time being. However, if it falls below the May low of $1936 (May 26), which seems to have some support from the interim 100-day SMA at $1935, it is likely to experience a further decline towards the 200-day SMA at $1830, well before reaching the bottom observed in 2021 at $1804 (February 28). On the upside, during intermittent recoveries, there may be provisional resistance encountered at the 55-day SMA at $1986 before approaching the significant level of $2000. There are no significant resistance levels until it reaches the peak of 2023 at $2067 (May 4), which is backed by the high seen in March 2022 at $2070 (March 8) and the unmatched top of $2075 (August 7, 2020).
Resistance levels: $1957 $1964 $1985 (4H chart)
Support levels: $1936 $1885 $1809 (4H chart)
CRUDE WTI
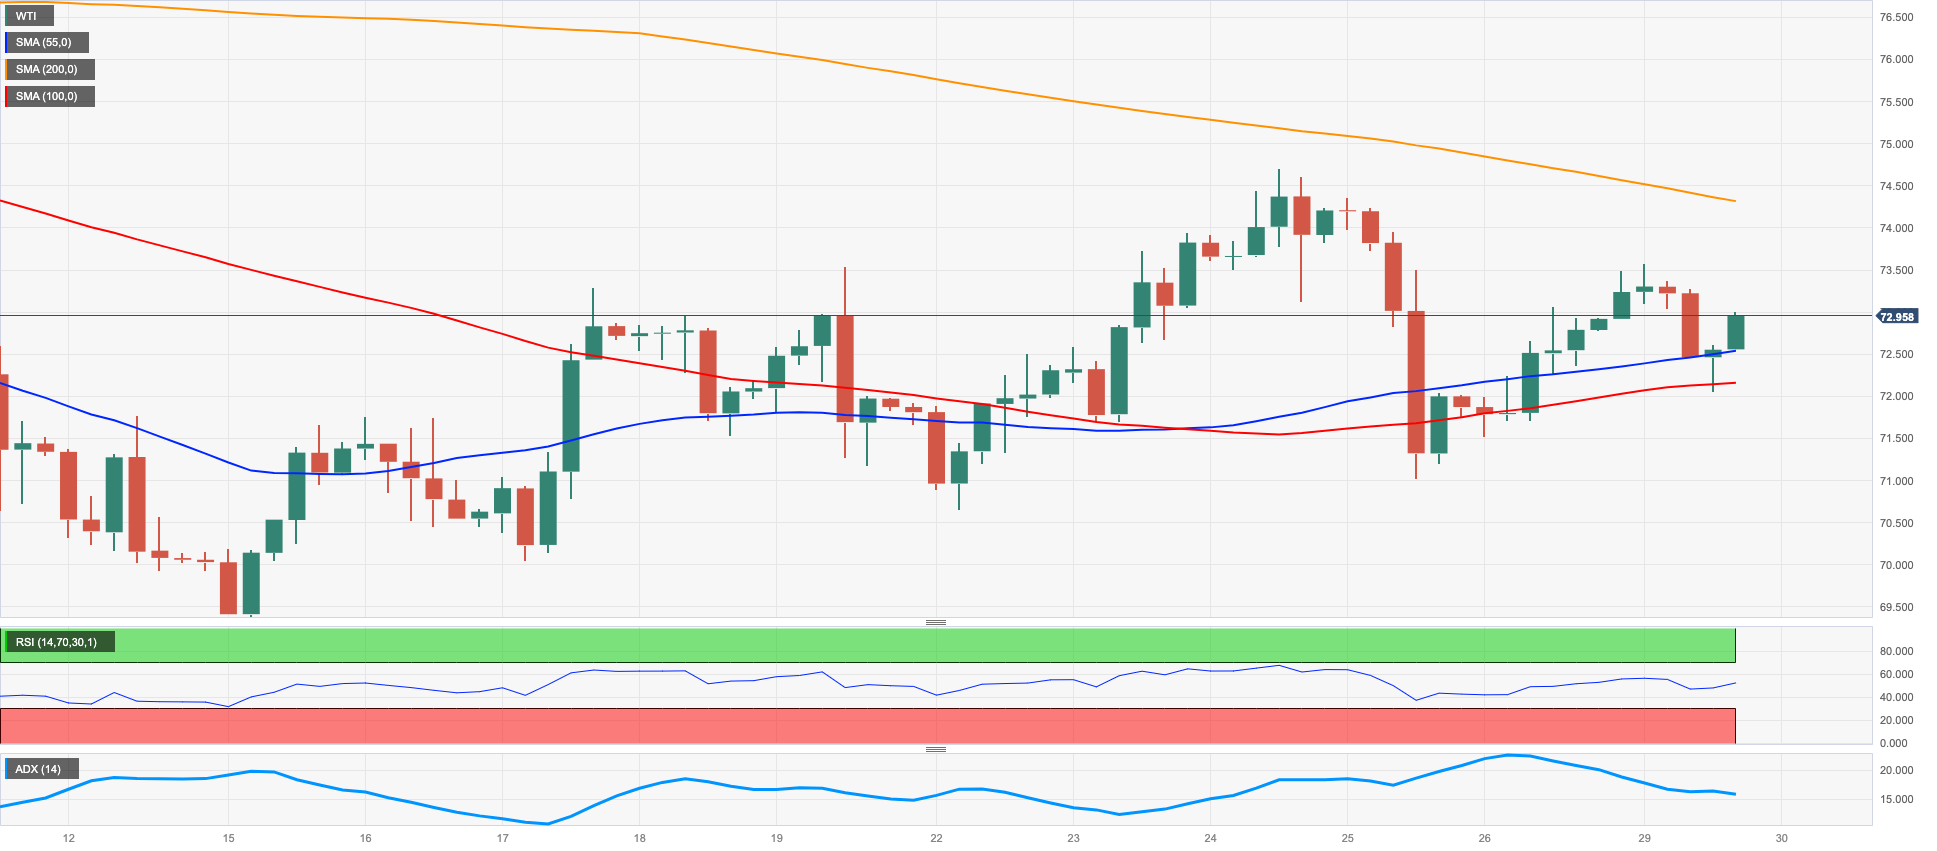
WTI prices wobbled about $73.00 on Monday, remaining at the mercy of the global market's general lack of direction.
Indeed, the commodity navigated within the optimism surrounding the (almost) resolved US debt ceiling and increasing speculation (and concern) over the possibility that the Federal Reserve might raise the Fed Funds Target Range (FFTR) once more at the June 14 meeting, which ultimately bolstered the resurgence of recession woes.
Later in the week, the API and the EIA will report on weekly US crude oil inventories during the week ended on May 26.
Clearly, the WTI has been moving within a consolidative theme in the past few weeks. The breakout of this topic should uncover the weekly high of $74.69 (May 24) in front of the impermanent 100-day SMA at $75.89, followed by the key $80.00 limit and the 200-day SMA at $79.86. In addition, the 2023 zenith of $83.49 (April 12) and the November 2022 top of $93.73 (November 7) await in case the recovery takes a more serious note. If bears retake control, the 2023 low of $63.61 (May 4) arises as a key conflict region, backed by the December 2021 low of $62.46 (December 2), all of which are above the fundamental $60.00 per barrel.
Resistance levels: $74.69 $76.89 $79.14 (4H chart)
Support levels: $70.94 $70.01 $69.38 (4H chart)
GER40
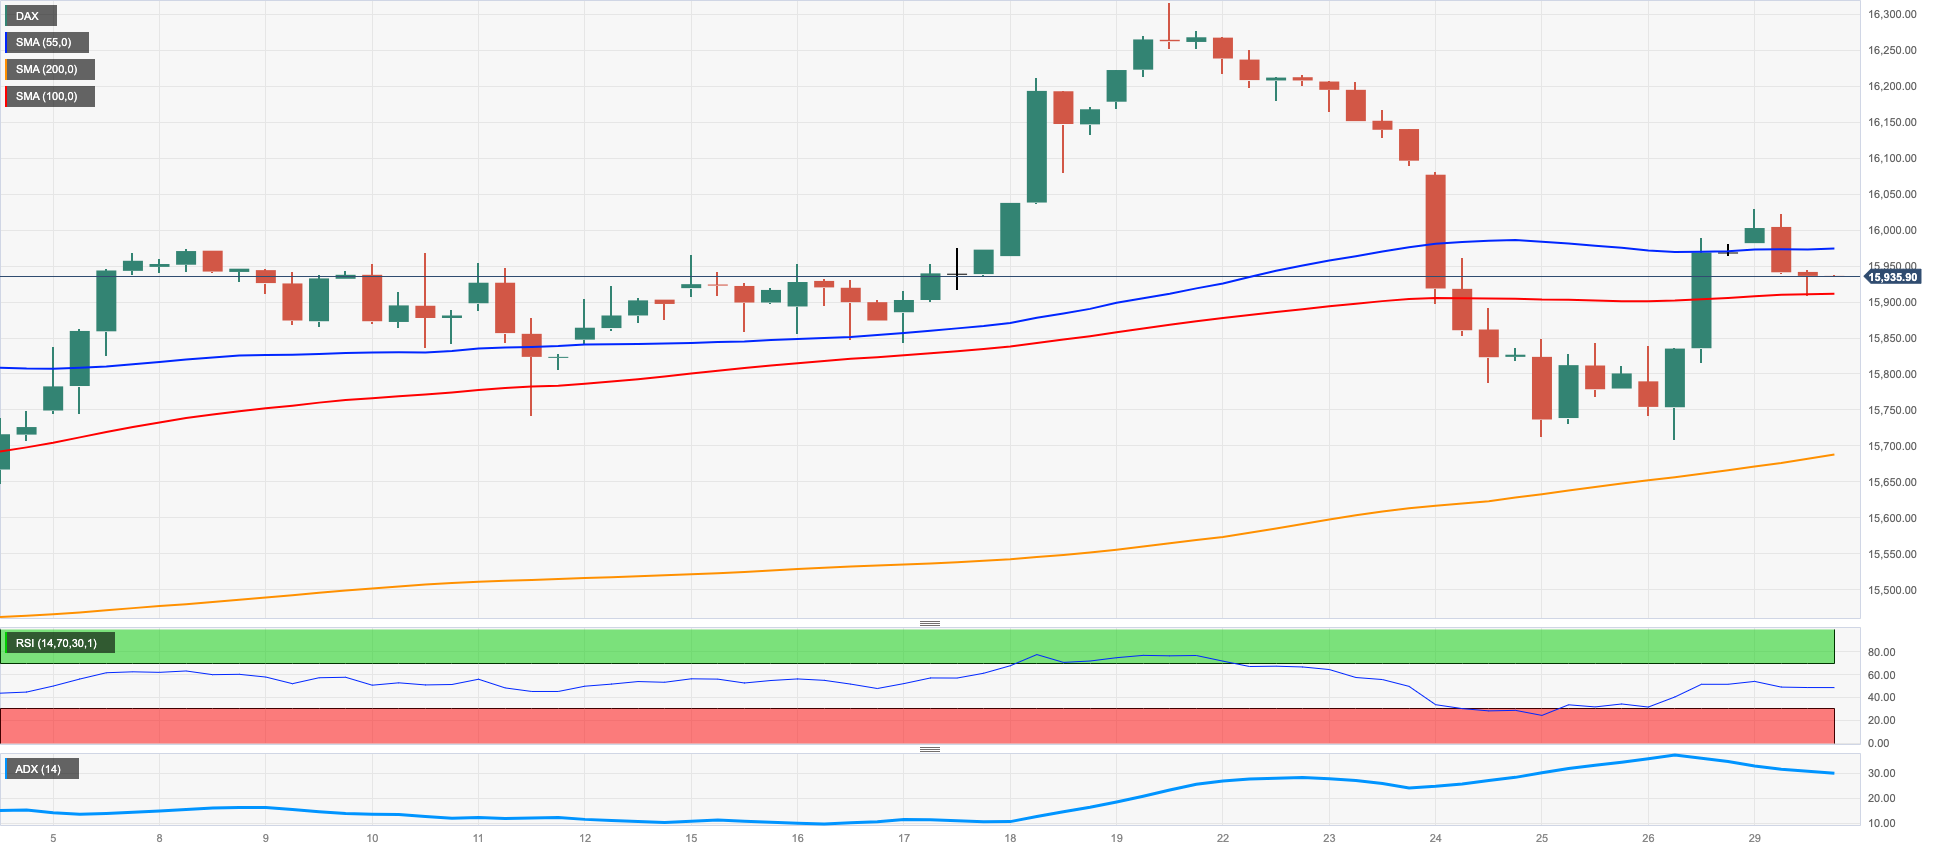
German equities gauged by the reference DAX40 could not sustain the positive tone in the wake of the opening bell on Monday and slipped back to the sub-16000 region amidst persevering uncertainty surrounding the US debt ceiling.
On this, House Speaker Kevin McCarthy announced that the White House and the Republicans have reached a preliminary agreement to raise the debt ceiling, thereby preventing the US from facing a catastrophic default. Although the details of the agreement are not yet fully disclosed, it is expected to involve an increase in the debt limit for a duration of two years coupled with a cap on nondefense spending, according to a fact sheet released by the GOP.
However, the agreement needs to be approved by leaders from both parties and enough members from each side of the aisle, despite containing certain provisions that are not supported by lawmakers on either side. Therefore, while a significant step has been taken, there is still work to be done before the agreement is finalized.
In the meantime, the 10-year Bund yields started the week on the back foot and retreated to 3-day lows near the 2.40% region.
The DAX40 seems to have embarked on a consolidation phase. Against that, the breakout of this pattern should extend gains past the all-time peak at 16331 (May 19). The reverse way around, sellers should face initial support at the weekly low of 15726 (May 25) prior to the May low at 15662 (May 4), a region reinforced by the temporary 55-day SMA at 15647. Further down emerges the April low at 15482 (April 5), not long before the 100-day SMA at 15467. Additional misfortunes could confront minor support levels, for example, 14809 (March 24) and the March low at 14458 (March 20). Likewise, the important 200-day SMA at 14436 could assume a significant part in additional critical pullbacks. The everyday RSI eased to the proximity of 52.
Best Performers: Sartorius AG VZO, E.ON SE, Fresenius SE
Worst Performers: Continental AG, Zalando SE, Adidas
Resistance levels: 16079 16331 17000? (4H chart)
Support levels: 15726 15662 15611 (4H chart)
NASDAQ
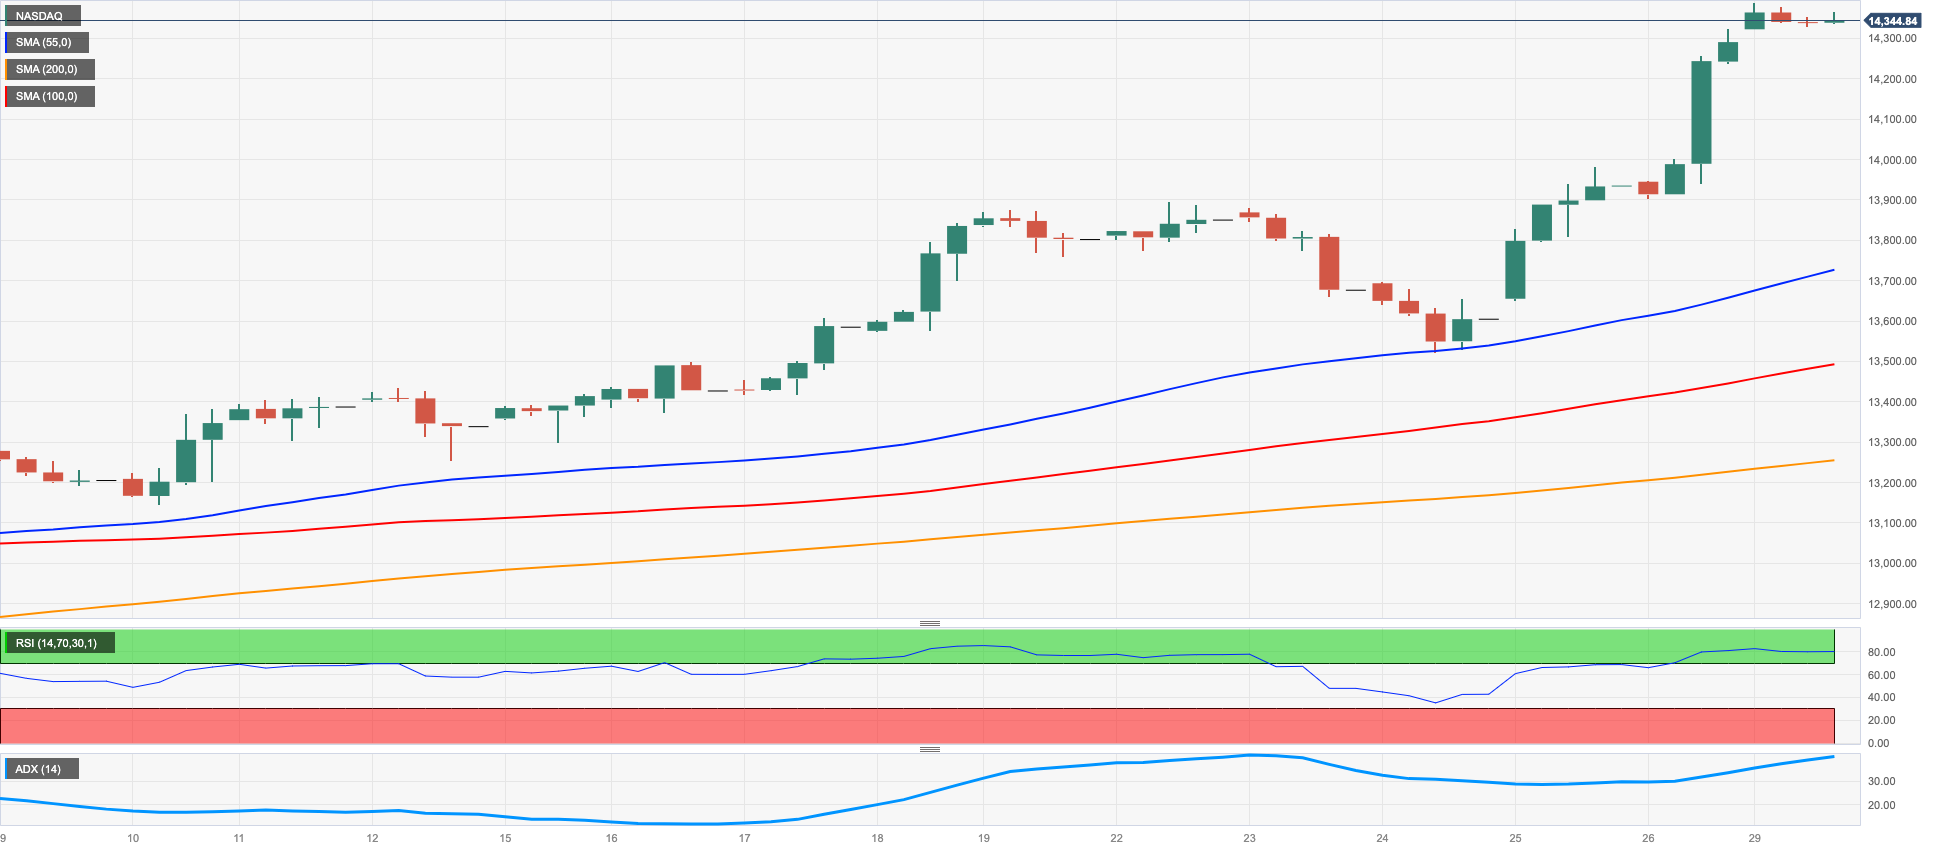
Highs, which were last reached in early April 2022 in the area of 14300 points.
Indeed, tech stocks posted another day of gains driven by enthusiasm for artificial intelligence, while Marvell Technology's announcement that the company's 2024 revenue would 'at least double' from the previous year thanks to increased demand for artificial intelligence provided an additional boost.
The announcement followed news from chipmaker Nvidia, which had made similar comments earlier in the week.
Extra optimism in the tech sector was also propped up by rising hopes of an imminent agreement around the US debt ceiling (which eventually materialized over the weekend).
The ongoing rally in the Nasdaq 100 shows no signs of slowing down. With that being said, if it manages to surpass the peak of 14329 observed in 2023 (May 26), it could potentially pave the way for a further advance towards the high recorded in March 2022 at 15265 (March 29). On the downside, immediate support is found at the weekly low of 13520 (May 24), followed by the 55-day SMA at 13055 and the May low of 12938 (May 4). This support level is reinforced by the April low of 12724 (April 25) and is positioned before the 200-day SMA at 12136, the March low of 11695 (March 13), and the weekly lows of 11550 (January 25) and 11251 (January 19). A more substantial decline could potentially jeopardize the 2023 low at 10696 (January 6). The RSI has further entered into the overbought territory, surpassing the 74 level on a daily basis.
Top Gainers: Marvell, PDD Holdings DRC, Broadcom
Top Losers: O’Reilly Automotive, Vertex, Verisk
Resistance levels: 14329 15161 15265 (4H chart)
Support levels: 13520 13348 12938 (4H chart)
DOW JONES
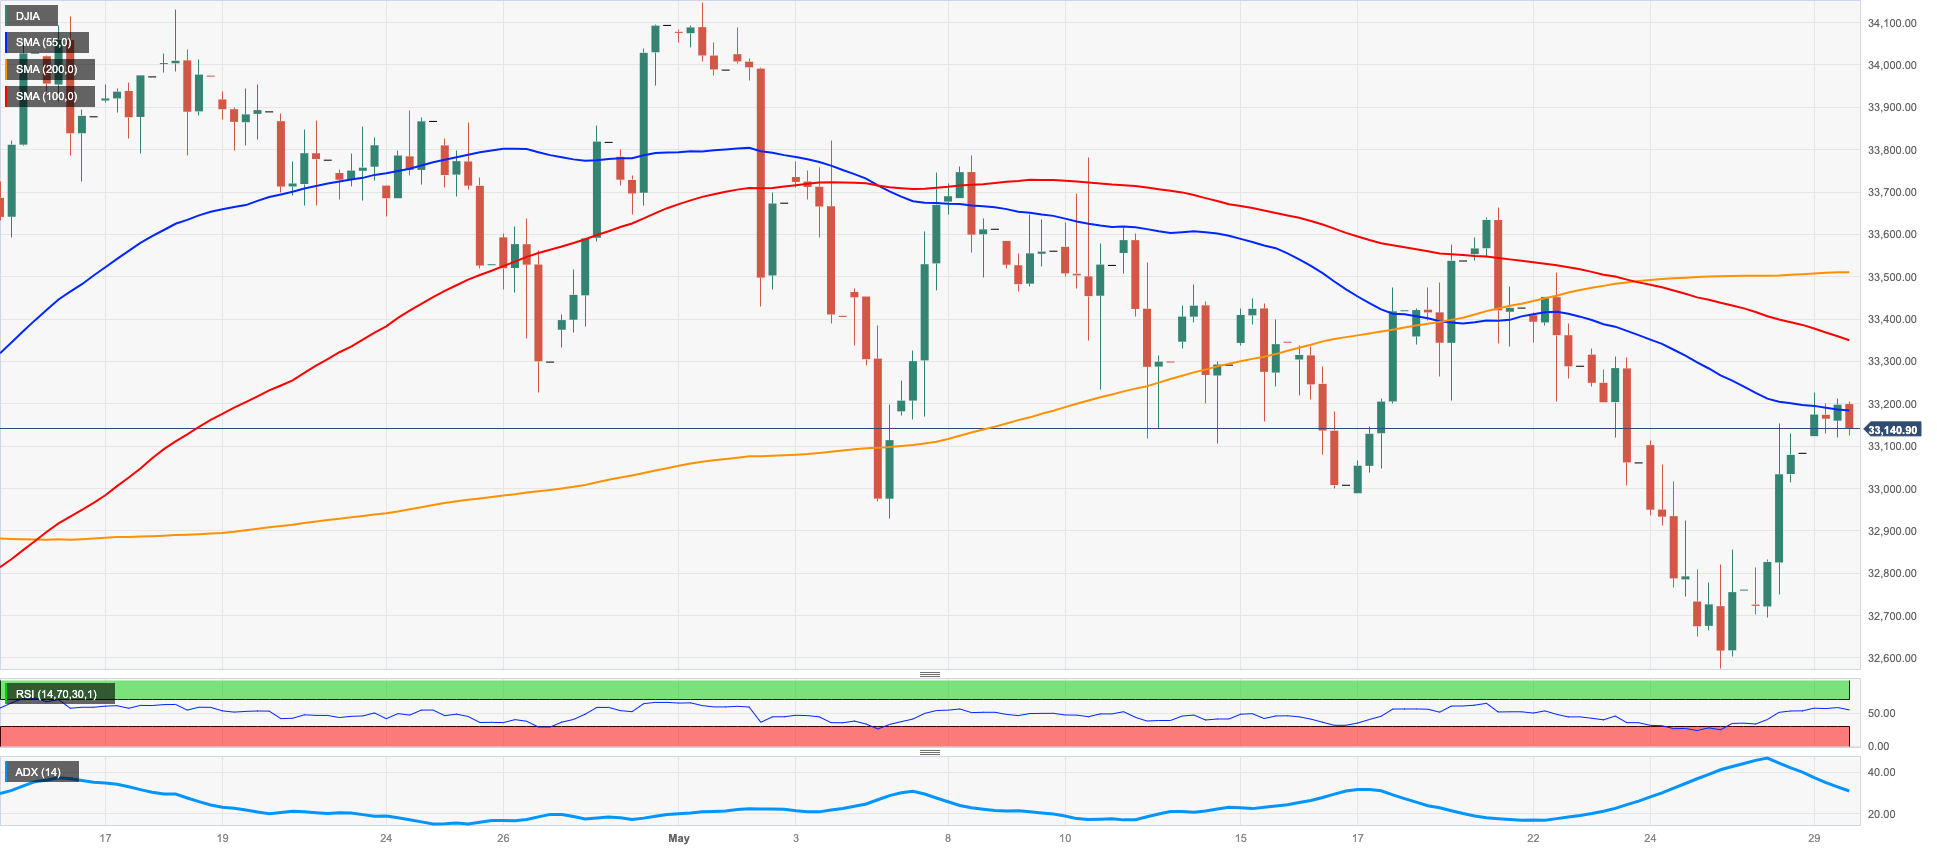
On Friday, the Dow Jones rebounded and made significant gains after experiencing five consecutive days of decline, which resulted in a new monthly low of around 32500 on May 25.
Friday’s gains in the index were bolstered by renewed optimism over a solution to the debt ceiling issue.
It is worth noting that negotiations between President Biden and House Speaker McCarthy eventually yielded a deal over the weekend. The compromise also suspends the debt ceiling until Jan. 1, 2025, so that it will not be exceeded until the 2024 presidential election. Spending will also remain largely unchanged in 2024, with the exception of defence and veterans spending, while 2025 will see a 1% increase.
In summary, the Dow Jones surged by 1.00% to 33093, the S&P500 rose by 1.30% to 4205, and the tech-heavy Nasdaq Composite increased by 2.19% to 12975.
The recuperation in the Dow Jones could get more serious once the weekly high of 33652 (May 19) is cleared. Further up comes the May top of 34257 (May 1) ahead of the 2023 peak of 34342 (January 13), and the December 2022 pinnacle of 34712 (December 13). Assuming that the index ascends over this level, it could advance toward the April 2022 high of 35492 (April 21). On the downside, a dip under the May low at 32586 (May 25) could see losses advance rapidly to the 2023 low of 31429 (March 15) before the 2022 low of 28660 (October 13). The RSI got pace and intruded the 45 level.
Top Performers: Intel, American Express, Salesforce Inc
Worst Performers: Merck&Co, Travelers, Chevron
Resistance levels: 33162 33334 33652 (4H chart)
Support levels: 32586 31805 31429 (4H chart)
MACROECONOMIC EVENTS

All Information & Updates provided by:

All information relating to the financial markets available on this page has been prepared and issued by FXStreet (Forexstreet SL, Spain, Reg: B62498233) on the basis of publicly available information and all information believed to be reliable and does not conflict with Kuwaiti local laws, and all necessary care has been taken to before the company to ensure that the facts mentioned are correct from the source.
NCM Investment nor any of its directors or employees shall in any way be held responsible for the contents of this news, and the information contained on this page is intended only to provide clients with publicly available information and should not be construed as investment advice, report or analysis and/or constitute an offer or invitation to buy or sell financial instruments of any kind.
RISK WARNING: Forex and CFDs are highly risky leveraged products, as losses can exceed deposits. Please ensure you understand all the risks and take independent advice if necessary. NCM will segregate the clients based on the criteria of the regulator and its bylaws. NCM does not provide any advisory service; the material published does not constitute advice or a recommendation for a transaction in any financial instrument. NCM accepts no responsibility for any use of the content presented and any consequences of that use. Anyone acting on the information provided does so at their own risk.