
- Contact Us:
-

-

-

-


Daily Market Updates
31 May 2023
USDJPY
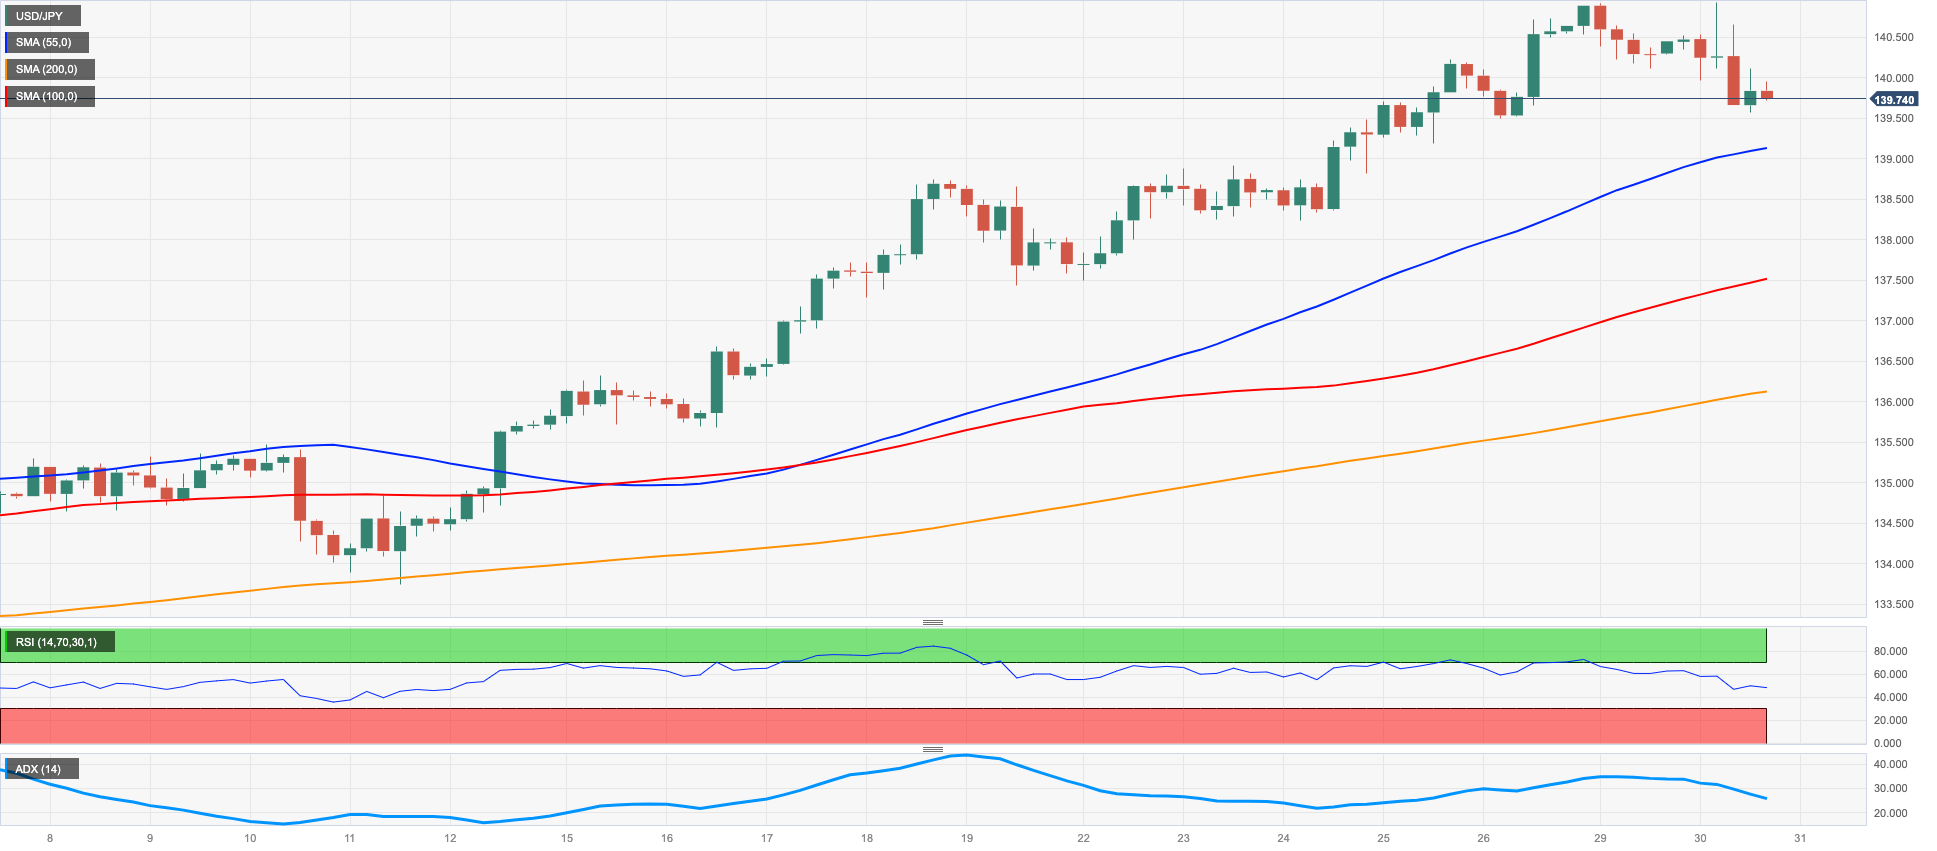
USD/JPY succumbed to another volatile session in the greenback in combination with a further retracement in US yields across the curve.
That said, spot added to Monday’s losses and broke below the key 140.00 support on the back of renewed strength around the yen, particularly in response to speculation of another intervention in the FX markets to prevent the currency from weakening further.
In fact, rumours on the latter have been hovering around markets after an announced meeting between the BoJ, the MoF and the Financial Services Agency (FSA) early in the Asian trading hours.
In the Japanese calendar, the Unemployment Rate ticked lower to 2.6% in April, and the Jobs/Applications Ratio held steady at 1.32.
The upper resistance level for USD/JPY is currently set at the highest point reached in 2023, which is 140.91 on May 29. If the currency pair surpasses this level, it may potentially retest the highest weekly points recorded on November 21, 2022, at 142.25, and October 31, 2022, at 148.84. On the contrary, there is significant contention at the key 200-day SMA at 137.24 before reaching the provisional 55-day and 100-day SMAs at 134.58 and 133.65, respectively. In a downward direction, the pair might revisit the lowest point of the week at 133.01 (April 26) followed by minor support at 132.01 (April 13) and the lowest point of April at 130.62 (April 5). In the event of a more significant decline, the March low of 129.63 (March 24) and the February low of 128.08 (February 8) could become prominent, followed by the lowest point of 2023 at 127.21 (January 16). The RSI on a daily basis broke below the 66 level.
Resistance levels: 140.91 141.61 142.25 (4H chart)
Support levels: 139.60 138.22 137.42 (4H chart)
GBPUSD
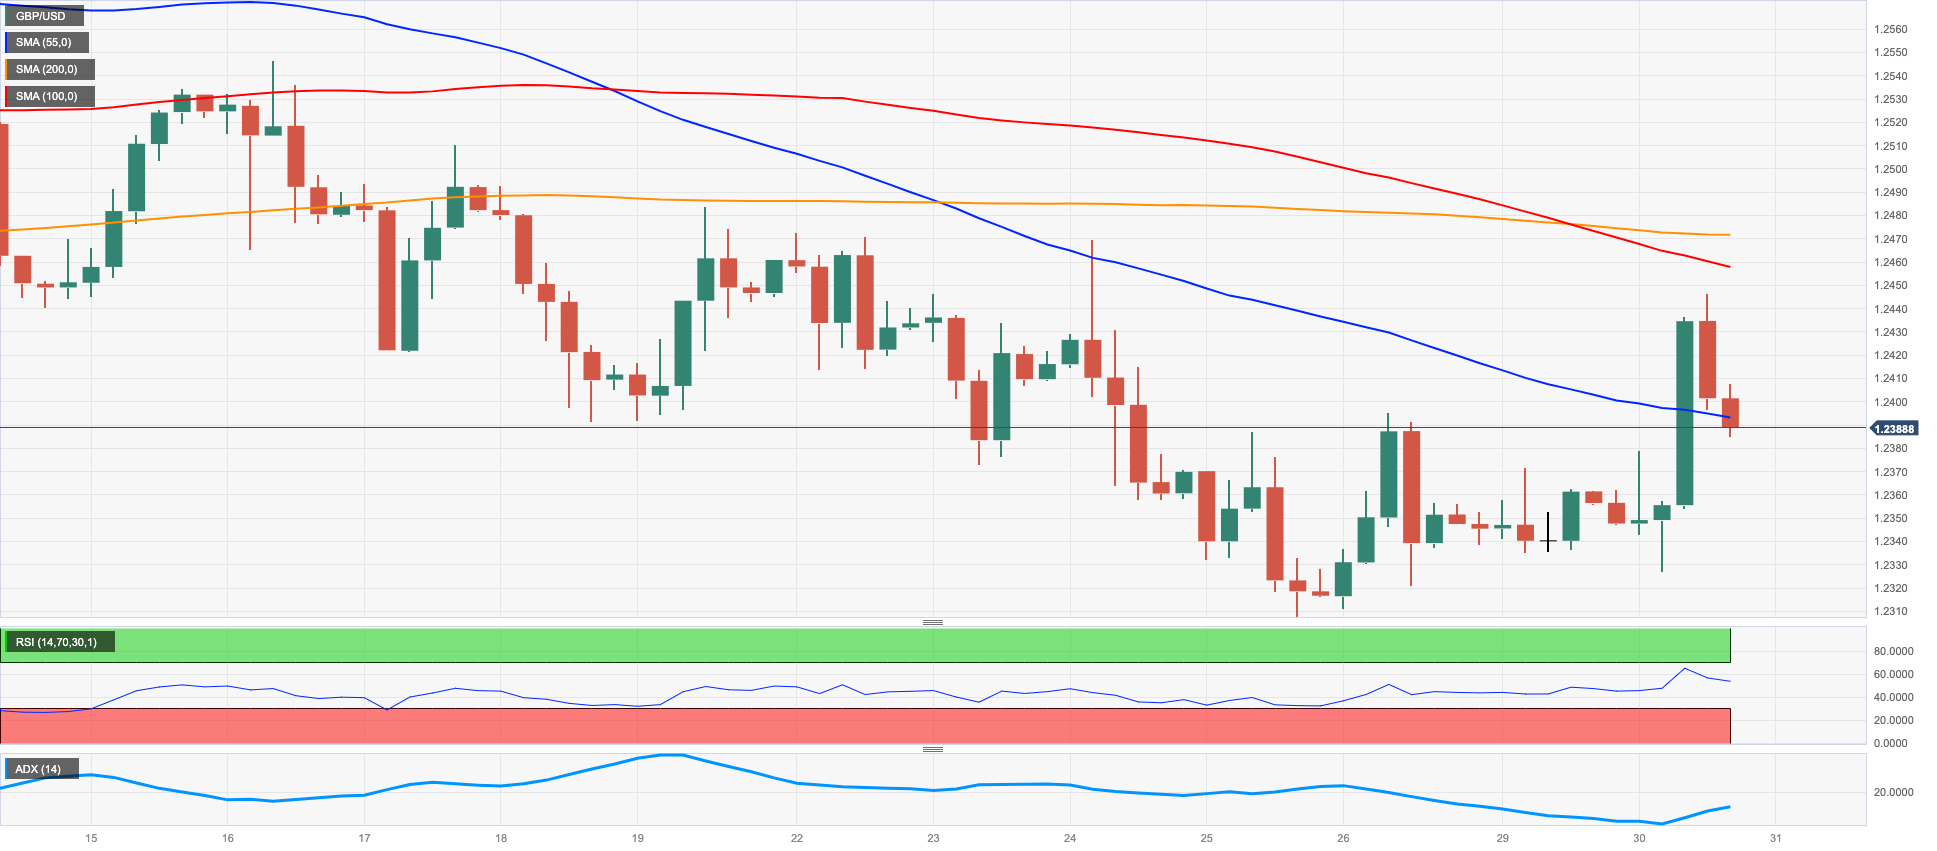
Further strength in the greenback initially weighed heavily on the risk complex and forced the British pound to recede to the 1.2330/25 band, where it met decent contention before triggering a marked bounce to the vicinity of 1.2450.
That said, GBP/USD navigated on the positive side for the third session in a row on Tuesday against the backdrop of mixed risk appetite trends and increasing cautiousness ahead of the vote on the US debt ceiling.
There were no data releases or events in the UK calendar on Tuesday.
If the GBP/USD goes below its May low of 1.2308 (May 25), it may retest its provisional 100-day SMA at 1.2289 before falling to its April bottom of 1.2274 (April 3). If the pair continues to fall, it may target the 200-day SMA at 1.1981 ahead of the 2023 low of 1.1802 (March 8). By contrast, a temporary hurdle emerges at the 55-day SMA at 1.2413 prior to the weekly top of 1.2546 (May 16), followed by the 2023 peak of 1.2679 (May 10). Buyers may then aim for the 200-week SMA at 1.2864 ahead of the psychological level of 1.3000. The daily RSI picked up traction and surpassed 45.
Resistance levels: 1.2395 1.2469 1.2510 (4H chart)
Support levels: 1.2308 1.2274 1.2189 (4H chart)
AUDUSD
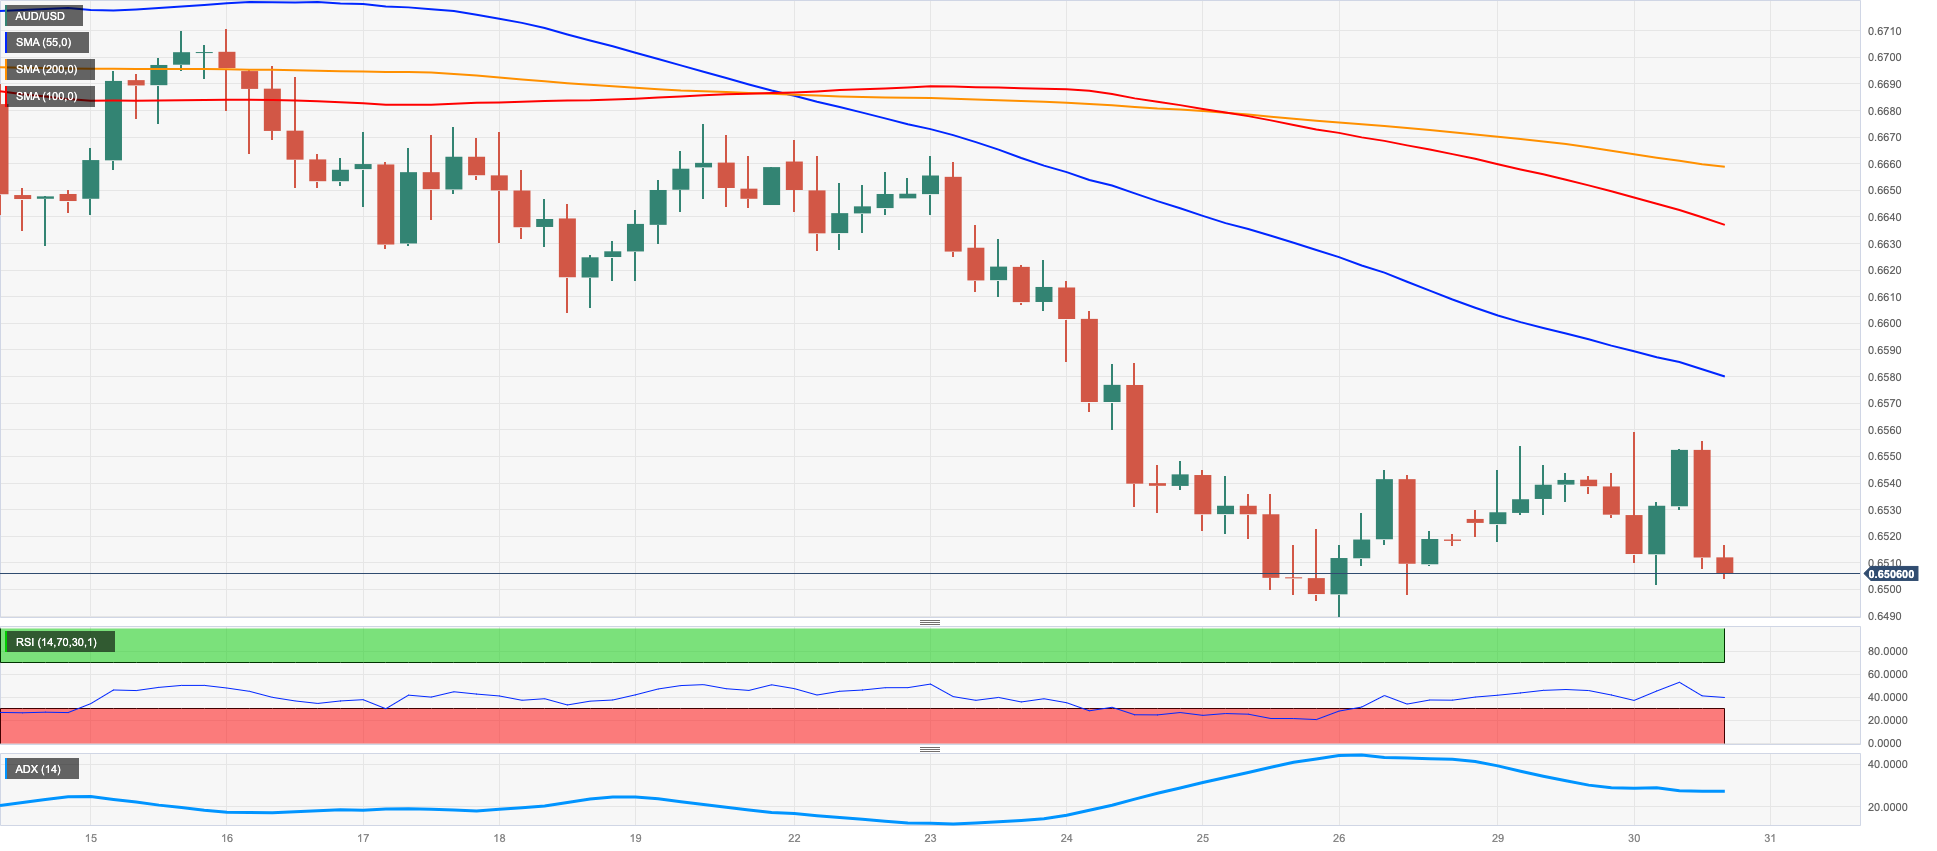
Quite a volatile session in the greenback left AUD/USD’s price action on the negative side and revisiting the 0.6500 neighbourhood on Tuesday.
In fact, following an early move to 4-day highs near 0.6560, the pair came under strong selling pressure and revisited the 0.6500 zone, where some decent contention appears to have turned up for the time being.
Extra weakness in the Aussie came from the poor performance of the commodity complex , where both copper prices and iron ore resumed the downtrend.
In Oz, preliminary Building Permits are expected to have contracted at a monthly 8.1% in April and 24/1% over the last twelve months.
If AUD/USD falls below the 2023 low of 0.6490 (May 26), it may drop further to the weekly low of 0.6386 (November 10, 2022) and the November 2022 low of 0.6272 (November 3). On the upside, the 200-day SMA at 0.6699 is a crucial immediate resistance, followed by the May high of 0.6818 (May 10) and the psychological level of 0.7000. Above this area, the next resistance levels are the weekly top of 0.7029 (February 14) and the 2023 peak of 0.7157 (February 2). The everyday RSI receded marginally to the 36 zone.
Resistance levels: 0.6554 0.6585 0.6675 (4H chart)
Support levels: 0.6490 0.6386 0.6272 (4H chart)
GOLD
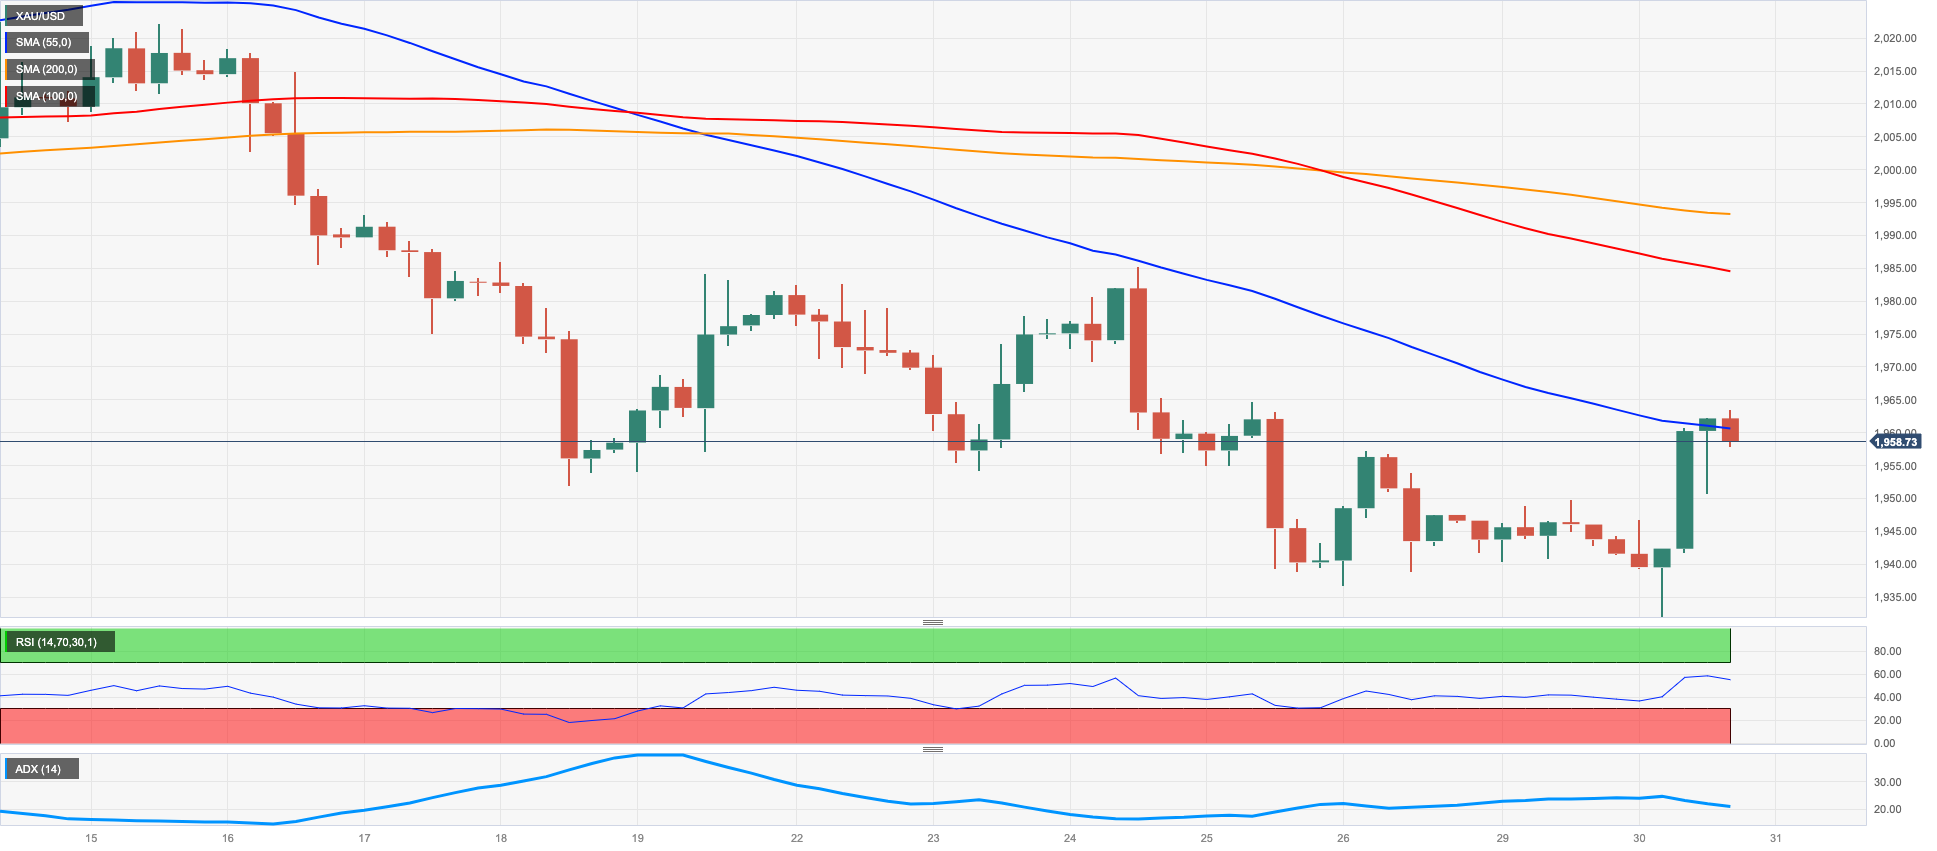
Prices of the yellow metal faltered once again around the $1970 region per ounce troy, sparking a corrective decline after two consecutive daily advances on Tuesday.
The downtick in bullion came despite the unconvincing price action around the greenback and further decline in US yields, particularly in the belly and the long end of the curve, while the short end halted an 11-day positive streak.
Moving forward, the precious metal should keep monitoring developments around the next FOMC event on June 14, where consensus now appears slightly tilted towards a 25 bps rate hike, a view that is expected to be highly influenced by the upcoming US jobs report on Friday.
Despite the recent comeback, gold remains under pressure for the time being. However, if it goes below the May low of $1932 (May 30), which appears to have some support from the proximity of the temporary 100-day SMA at $1936, it is likely to fall deeper towards the 200-day SMA at $1831, far before hitting the 2021 bottom of $1804 (February 28). On the flip side, amid sporadic recoveries, interim resistance at the 55-day SMA at $1987 may be confronted before attaining the major milestone of $2000. There are no notable resistance levels until it hits the 2023 top of $2067 (May 4), which is supported by the March 2022 high of $2070 (March 8) and the all-time peak of $2075 (August 7 2020).
Resistance levels: $1970 $1985 $1995 (4H chart)
Support levels: $1932 $1885 $1809 (4H chart)
CRUDE WTI
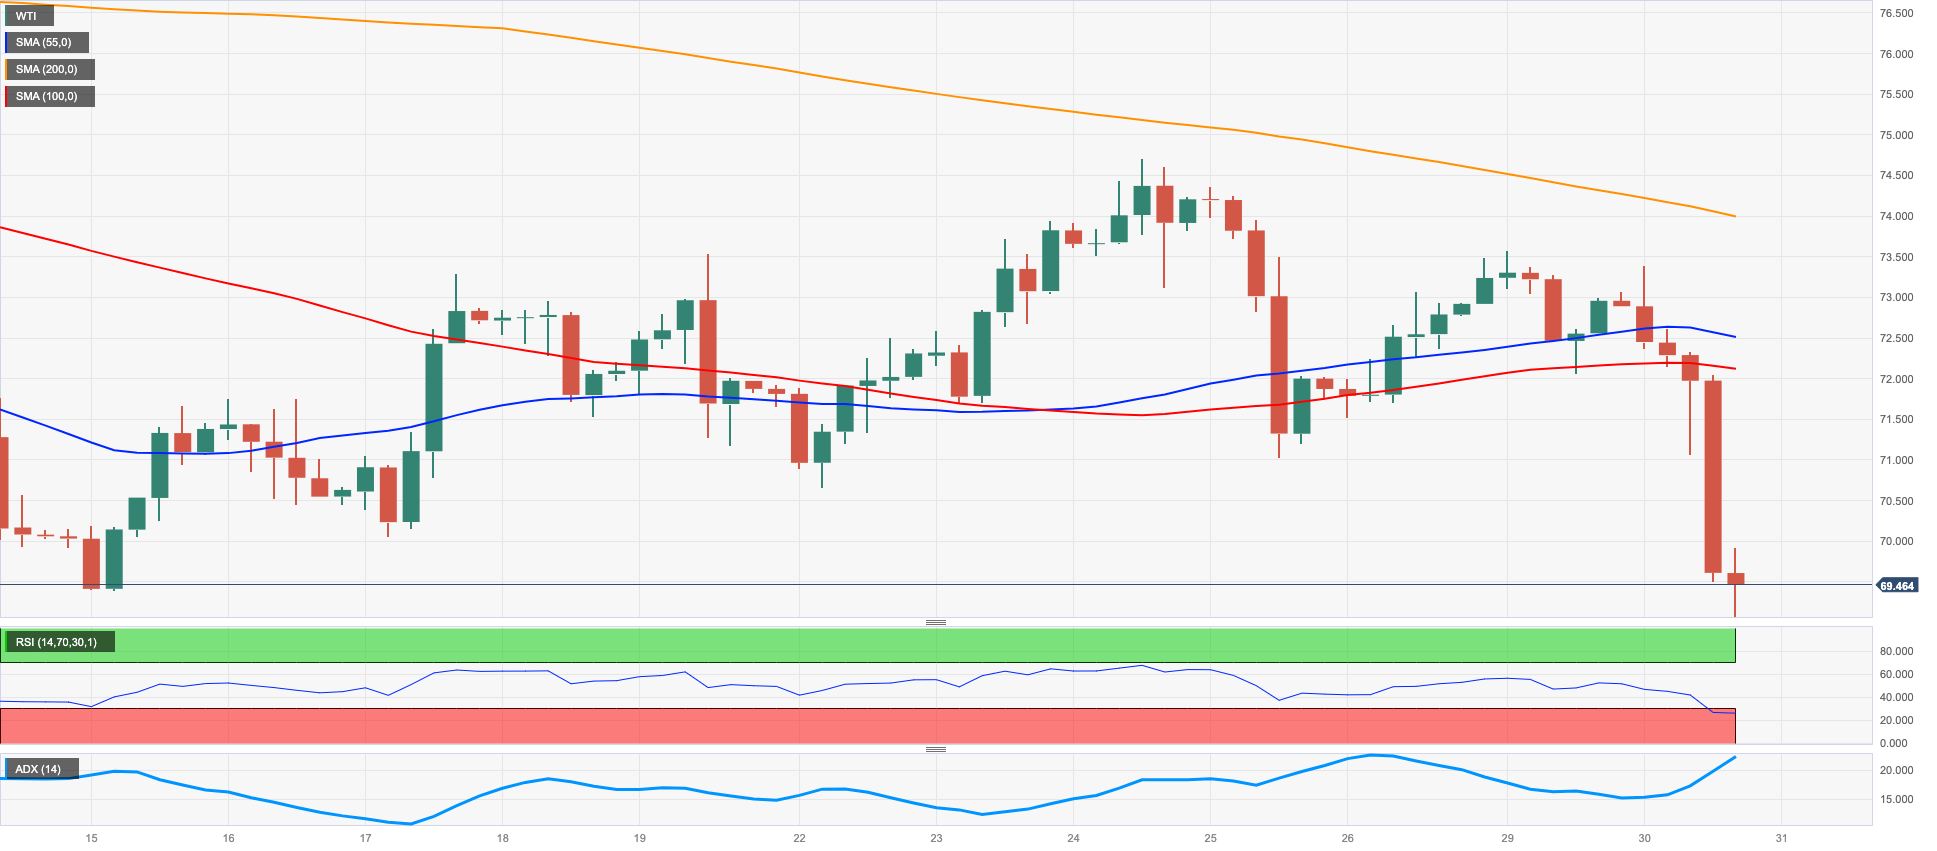
Prices of the American reference for sweet light crude oil plummeted to multi-day lows near the $69.00 mark per barrel on Tuesday, reversing at the same time two consecutive daily advances.
The negative performance of the commodity came in response to persistent concerns over another interest rate hike by the Federal Reserve at its June 14 event, which could eventually reignite recession jitters and therefore have an impact on the demand for the commodity.
The sour mood among traders was also bolstered by speculation that OPEC+ could refrain from announcing further oil output cuts at its meeting early next month, exposing conflicting views between Russia and Saudi Arabia.
Also propping up the selling pressure, the greenback traded in a firm tone following Monday’s Memorial Day holiday.
Later in the week, the API and the EIA will report on weekly US crude oil inventories for the week ended May 26.
The WTI has clearly been moving within a consolidative pattern in recent weeks. The weekly high of $74.69 (May 24) should be found in front of the unstable 100-day SMA at $75.85, followed by the 200-day SMA at $79.70 and the key $80.00 zone. Furthermore, the 2023 peak of $83.49 (April 12) and the November 2022 top of $93.73 (November 7) await if the recovery becomes more significant. If bears reclaim control, the 2023 low of $63.61 (May 4) emerges as a crucial conflict territory, supported by the December 2021 low of $62.46 (December 2), all prior to the significant $60.00 per barrel.
Resistance levels: $74.69 $76.89 $79.14 (4H chart)
Support levels: $69.07 $66.11 $63.61 (4H chart)
GER40
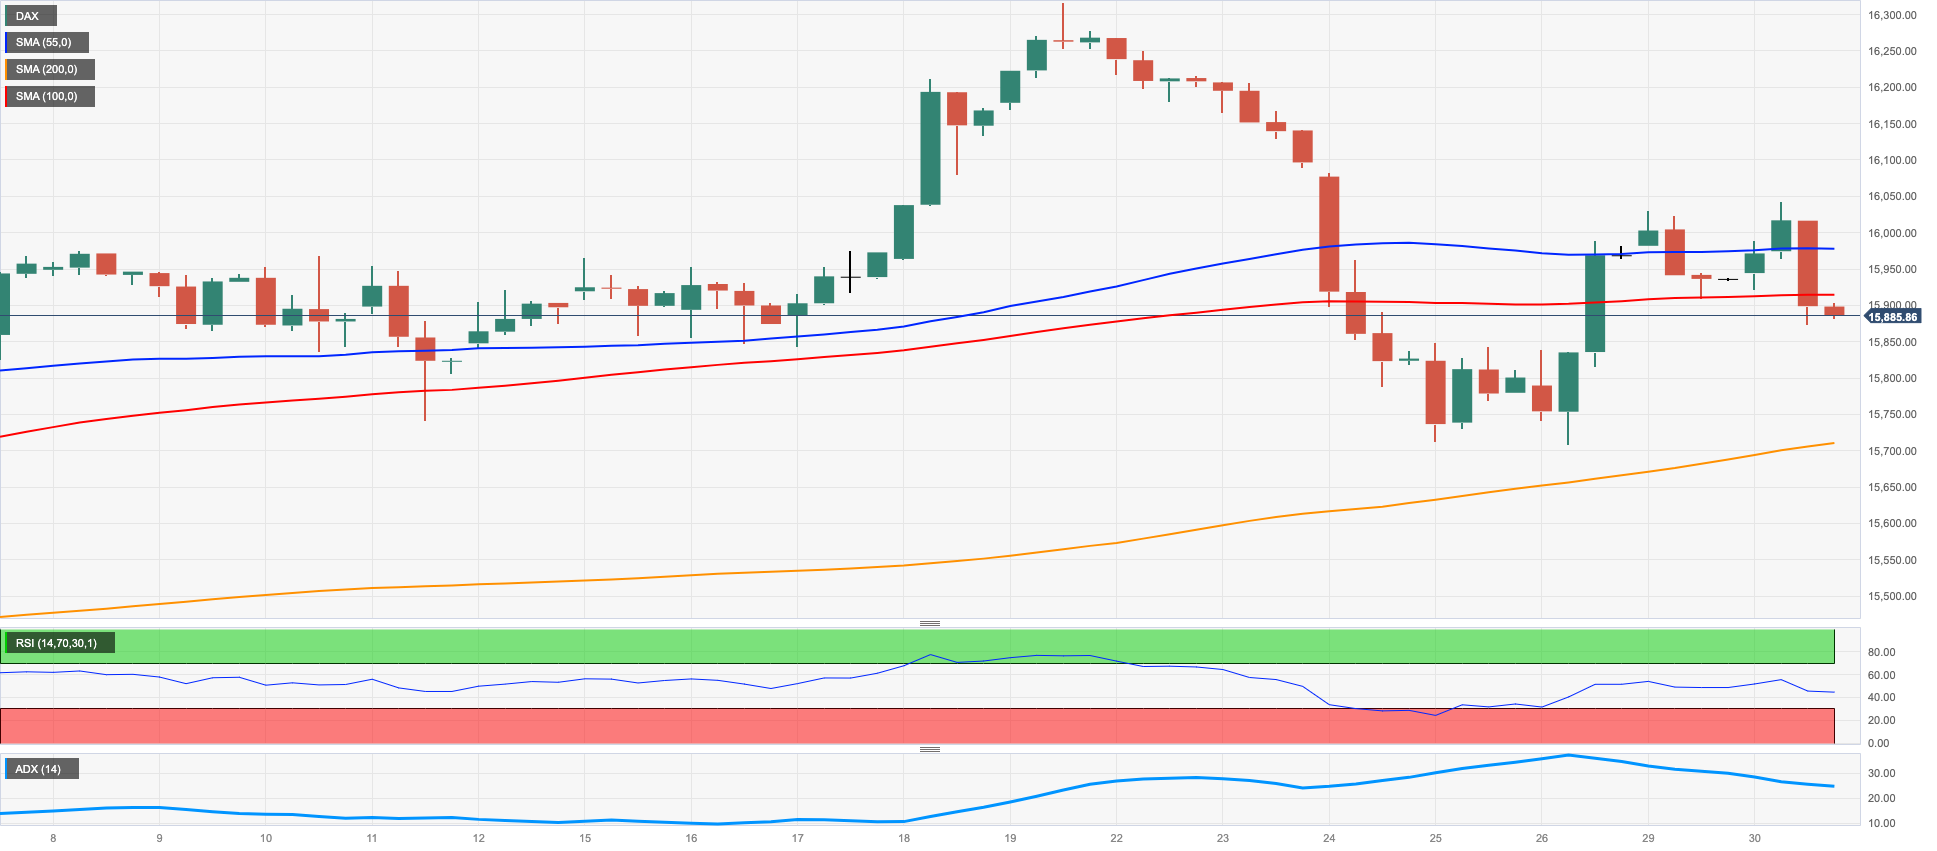
The German benchmark DAX40 extended the pessimism seen on Monday and closed Tuesday’s session further south of the 16000 yardstick.
Rising prudence among market participants regarding the negotiations around the US debt ceiling vote kept buyers at bay, while another round of hawkish ECB-speak (this time from Board member Simkus) seems to have added extra pressure to stocks.
The agreement on the debt limit, negotiated by President Joe Biden and House Speaker Kevin McCarthy, enters a critical final phase with less than a week remaining to secure congressional approval before the June 5 deadline for a potential default. Should the leaders successfully navigate the expected opposition from their respective sides, the agreement will proceed to the Senate. However, any single objection in the Senate could initiate time-consuming procedures that pose a significant risk of pushing the United States perilously close to its first-ever default.
In the meantime, the German money market showed fresh demand for bonds, dragging 10-year bund yields to multi-day lows near 2.30%.
The DAX40 appears to have entered a consolidation period. In contrast, a breakout of this pattern should push gains over the all-time high of 16331 (May 19). Sellers should find first support at the weekly low of 15726 (May 25) before the May low of 15662 (May 4), which is backed by the temporary 55-day SMA at 15652. Further down, the April low of 15482 (April 5) coincides with the temporary 100-day SMA and comes ahead of minor support levels, such as 14809 (March 24) and the March low of 14458 (March 20). Similarly, the key 200-day SMA around 14448 might play a big role in subsequent critical pullbacks. The daily RSI dropped to the proximity of the 50 threshold.
Best Performers: Deutsche Post, Infineon, Siemens Energy AG
Worst Performers: Fresenius SE, Beiersdorf AG, Henkel VZO
Resistance levels: 16079 16331 17000? (4H chart)
Support levels: 15889 15726 15619 (4H chart)
NASDAQ
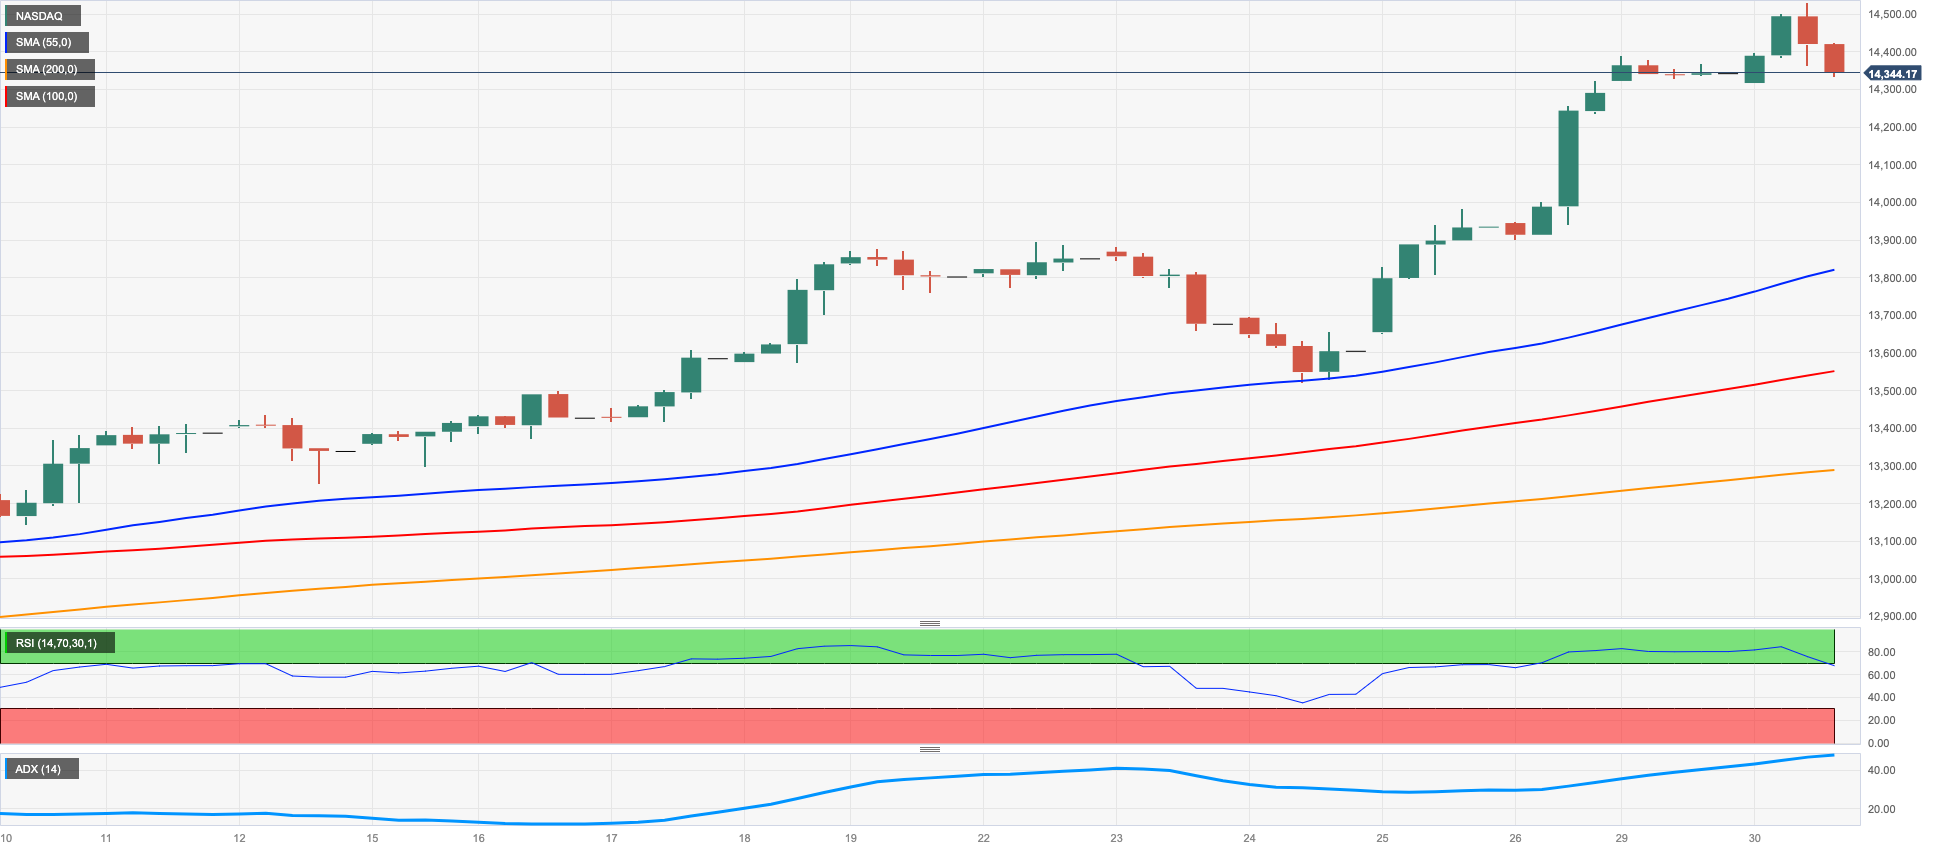
The rally in the US tech sector appears unabated after the Nasdaq 100 clinched a fresh 2023 top past the 14500 level on Tuesday.
As a matter of fact, declining US yields across the curve coupled with positive news from chipmaker Nvidia boosted optimism among investors and catapulted the index to levels last seen over a year ago.
On the latter, Nvidia Corp experienced a significant 4.2% surge, reaching an all-time high, as the leading chip manufacturer in the world surpassed a market capitalization of $1 trillion for the very first time.
Extra optimism in the tech sector also emerged following the bipartisan deal on the debt ceiling over the weekend, which lawmakers are expected to vote on later in the week.
The continued rally of the Nasdaq 100 shows no signs of abating. If it manages to surpass the 2023 high of 14520 (May 30), it could pave the way for a further rise towards the March 2022 high of 15265 (March 29). On the downside, immediate support is at the weekly low of 13520 (May 24), followed by the 55-day SMA at 13102 and the May low of 12938 (May 4). This support level precedes the April low of 12724 (April 25) and is ahead of the 200-day SMA at 12142, the March low of 11695 (March 13) and the weekly lows of 11550 (January 25) and 11251 (January 19). A sharper decline could threaten the 2023 low at 10696 (January 6). The RSI has moved further into the overbought territory and has crossed the 75 yardstick on a daily basis.
Top Gainers: Qualcomm, Enphase, Netflix
Top Losers: PDD Holdings DRC, JD.com Inc Adr, Marvell
Resistance levels: 14520 15161 15265 (4H chart)
Support levels: 13520 13372 12938 (4H chart)
DOW JONES
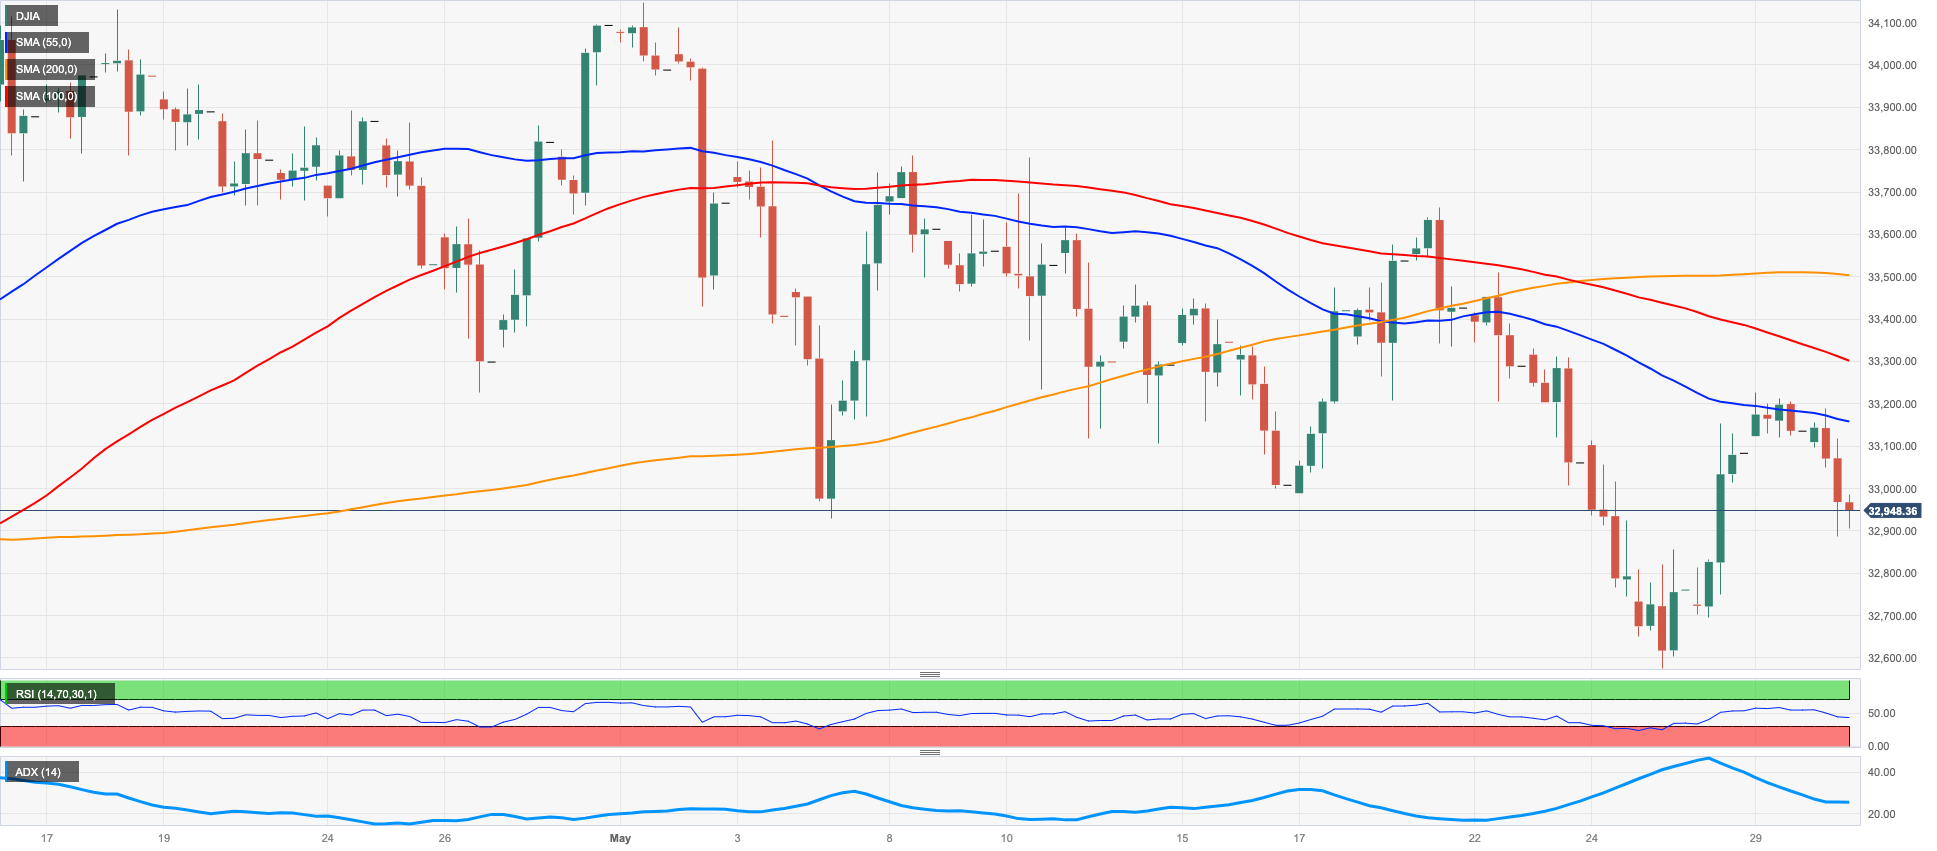
US equities tracked by the Dow Jones started the new trading week on the back foot against the backdrop of persevering prudence ahead of the vote to pass the debt limit bill.
Indeed, lawmakers were rushing to complete the debt ceiling agreement on Tuesday, as Congress has until early June to increase or suspend the debt ceiling, or the country will fail on its debt obligations.
It is worth recalling that the compromise also suspends the debt ceiling until Jan. 1, 2025, so it cannot be exceeded until the 2024 presidential election. Spending also remains largely unchanged in 2024, with the exception of defense and veterans spending, while 2025 includes a 1% increase.
All in all, the Dow Jones dropped 0.50% to 32928, the S&P500 retreated 0.25% to 4194, and the tech-benchmark Nasdaq Composite went down 0.02% to 12972.
Once the Dow Jones surpasses its weekly high of 33652 (May 19), there is potential for a more significant recovery. If it continues to rise, it may encounter resistance at the May top of 34257 (May 1), then the 2023 peak of 34342 (January 13), and the December 2022 pinnacle of 34712 (December 13). If the index manages to exceed these levels, it could potentially reach the April 2022 high of 35492 (April 21). On the downside, if it falls below the May low at 32586 (May 25), it could experience rapid losses, potentially falling to the 2023 low of 31429 (March 15) before reaching the 2022 low of 28660 (October 13). The day-to-day RSI retreated to the sub-44 zone.
Top Performers: Intel, Apple, Cisco
Worst Performers: Visa A, Procter&Gamble, Merck&Co
Resistance levels: 33162 33332 33652 (4H chart)
Support levels: 32586 31805 31429 (4H chart)
MACROECONOMIC EVENTS

All Information & Updates provided by:

All information relating to the financial markets available on this page has been prepared and issued by FXStreet (Forexstreet SL, Spain, Reg: B62498233) on the basis of publicly available information and all information believed to be reliable and does not conflict with Kuwaiti local laws, and all necessary care has been taken to before the company to ensure that the facts mentioned are correct from the source.
NCM Investment nor any of its directors or employees shall in any way be held responsible for the contents of this news, and the information contained on this page is intended only to provide clients with publicly available information and should not be construed as investment advice, report or analysis and/or constitute an offer or invitation to buy or sell financial instruments of any kind.
RISK WARNING: Forex and CFDs are highly risky leveraged products, as losses can exceed deposits. Please ensure you understand all the risks and take independent advice if necessary. NCM will segregate the clients based on the criteria of the regulator and its bylaws. NCM does not provide any advisory service; the material published does not constitute advice or a recommendation for a transaction in any financial instrument. NCM accepts no responsibility for any use of the content presented and any consequences of that use. Anyone acting on the information provided does so at their own risk.