
- Contact Us:
-

-

-

-


Daily Market Updates
01 Jun 2023
EURUSD
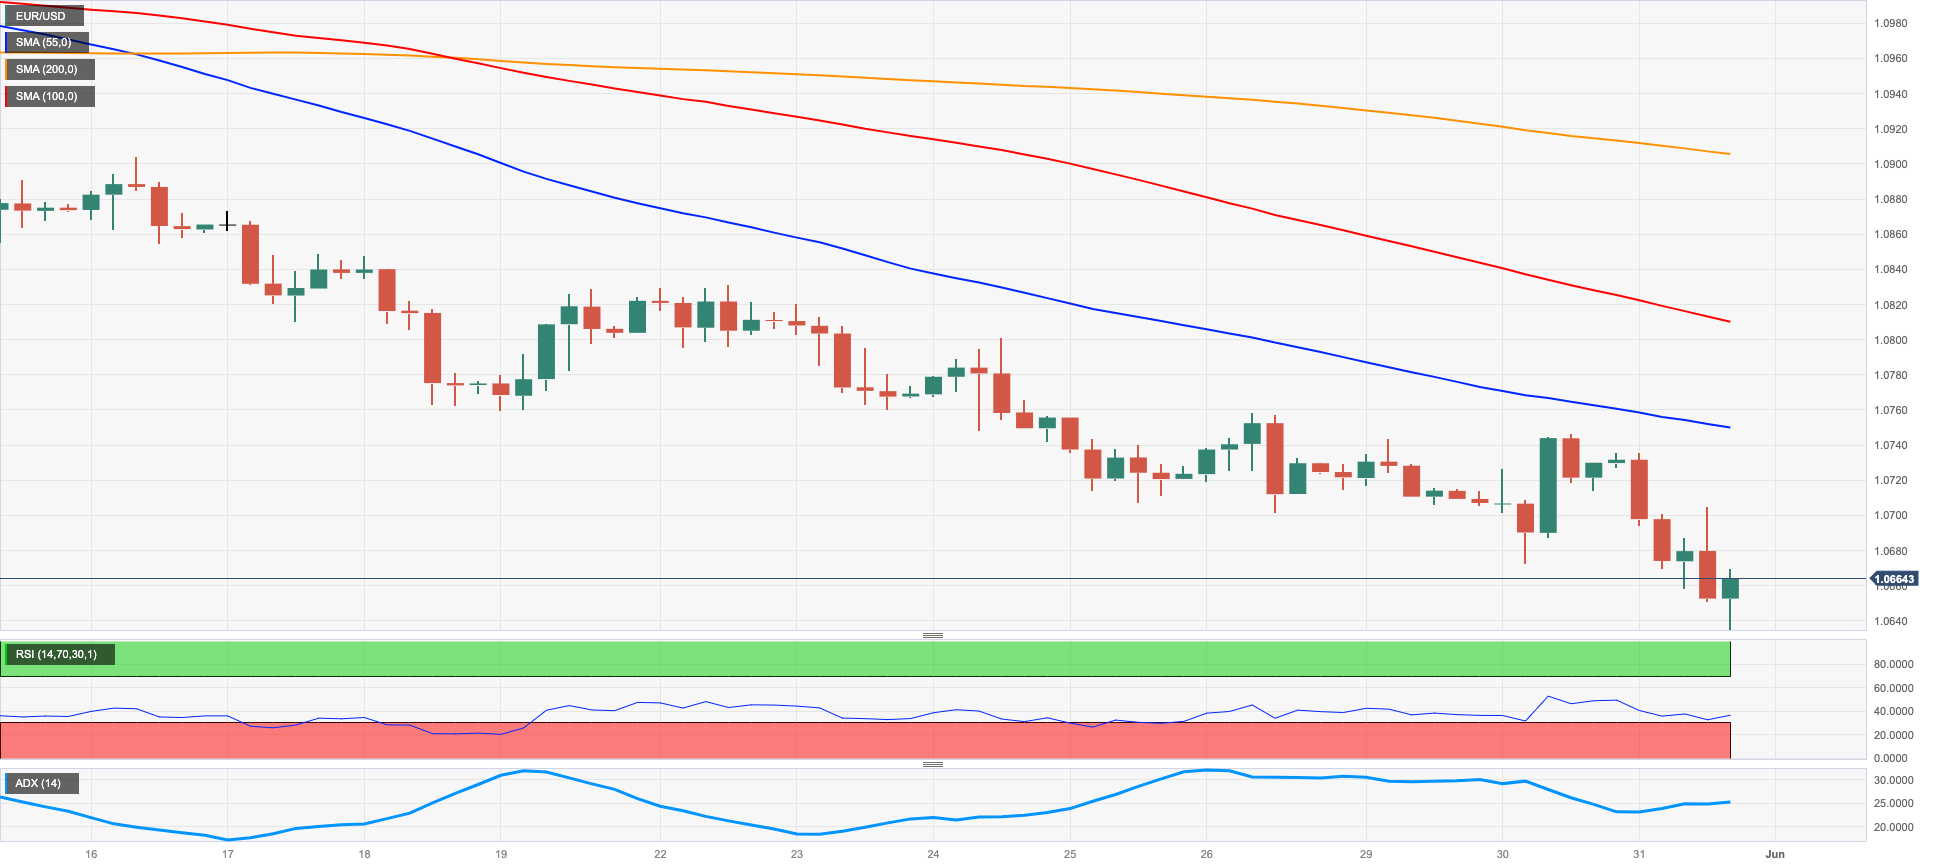
Another dreadful session saw EUR/USD accelerate its decline to new multi-week lows in the 1.0640/35 band on Wednesday, always on the back of the persevering march north in the greenback, which also lifted the USD Index (DXY) to new highs in an area last seen in mid-March near 104.70. The strong uptick in the buck, however, fizzled out somewhat towards the end of the session after FOMC’s Harker and Jefferson suggested the likelihood that the Fed could skip hiking rates in June. These views appear to be a ‘skip’ rather than a ‘pause’.
The generalized sour mood in the risk complex came in response to discouraging prints from the Chinese manufacturing and services PMIs for the month of May that were released during early trade in Asia.
Also adding to the bid tone in the dollar appeared some fresh optimism after the House Rules Committee voted 7-6 to pass the Biden-McCarthy debt ceiling bill late on Tuesday.
Somewhat undermining the rally in the buck, expectations of another 25 bps rate hike by the Fed in June dwindled following comments from Harker and Jefferson, and the probability of that move now hovers around 37% when tracked by CME Group’s FedWatch Tool (from nearly 66% just moments earlier).
No echoes from hawkish comments by ECB Board member M. Müller, who favoured at least two more 25 bps interest rate raises and suggested that talks over interest rate cuts early next year appear too optimistic. Still around the central bank, dove member I. Visco reiterated that the ECB needs to proceed in a gradual fashion.
Interesting day in the euro docket after the advanced Inflation Rate in France is seen contracting 0.1% MoM in May and rising 5.1% over the last twelve months. The opposite is seen in Italy, where the CPI is expected to have rise 0.3% MoM and 7.6% YoY. In Germany, the Unemployment Change went up by 9K persons and the jobless rate remained at 5.6% for the current month
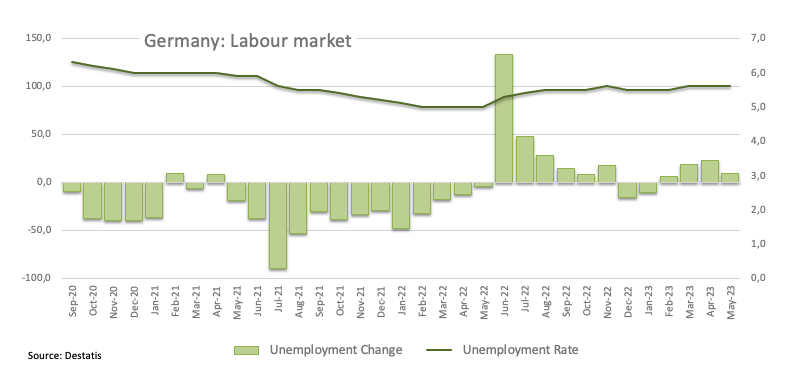
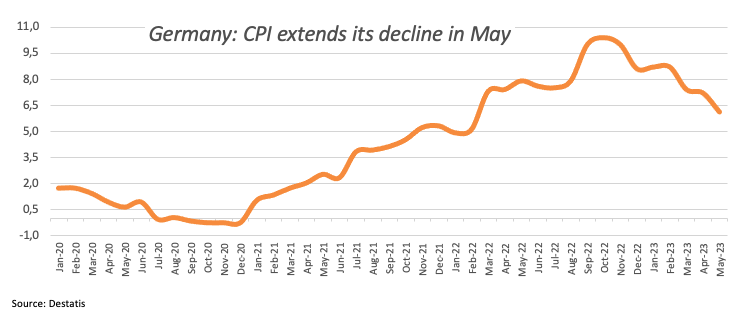
Still in Germany, preliminary inflation figures saw the CPI drop at a monthly 0.1% and rise 6.1% from a year earlier.
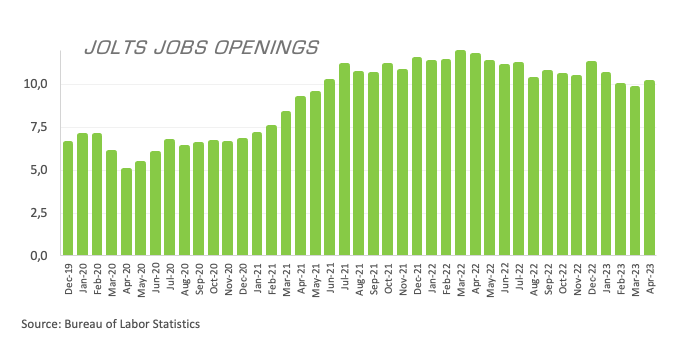
Across the Atlantic, MBA Mortgage Applications contracted 3.7% in the week to May 26. In addition, JOLTs Job Openings rose more than expected by 10.103M in April and the Chicago PMI retreated to 40.4 in May.
If EUR/USD drops below the lowest point reached in May at 1.0635 (May 31), it will face the March low at 1.0516 (March 15) before reaching the 2023 low at 1.0481 (January 6). On a positive note, the 100-day and 55-day SMAs at 1.0813 and 1.0881, respectively, are situated below the psychological level of 1.1000, which serves as an intermediate barrier. Once this threshold is surpassed, there are no significant obstacles until the pair hits the 2023 top at 1.1095 (April 26), followed by the rounded value of 1.1100 and the weekly peak of 1.1184 (March 31, 2022). Another rounded value awaits at 1.1200. The RSI) on a daily basis receded to the proximity of 32.
Resistance levels: 1.0753 1.0801 1.0831 (4H chart)
Support levels: 1.0635 1.0516 1.0481 (4H chart)
USDJPY
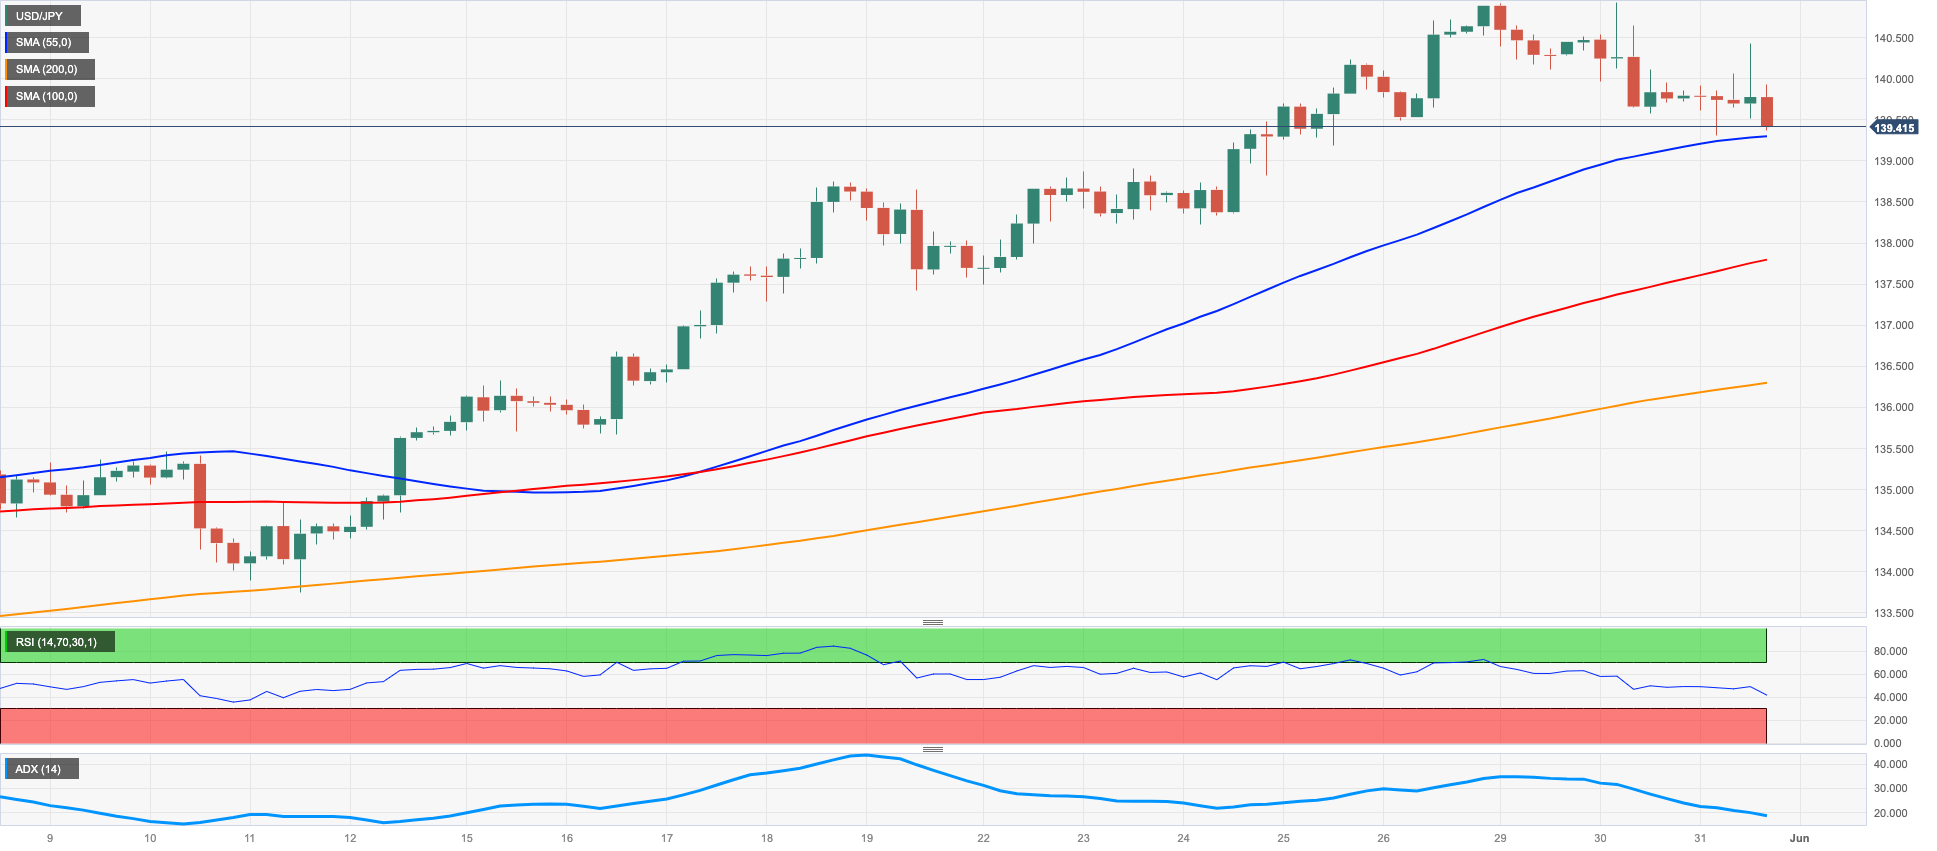
USD/JPY dropped for the third straight session, as the late corrective decline in the dollar favoured the continuation of the weekly retracement in spot, this time revisiting the low-139.00s on Wednesday.
The relentless move higher in the dollar coupled with some alleviated strength in the Japanese yen helped spot return to positive territory during most of the session. On the latter, it is worth recalling that Tuesday’s unscheduled meeting between the BoJ, the MoF, and the FSA added fuel to speculation around a potential intervention in the FX markets.
Despite the pair still being a long way from the October high around 152.00, officials’ concerns appear to have resurfaced since the velocity of change has increased in recent weeks as the dollar rise has resumed.
Also collaborating with the pair’s downside emerged a further pullback in US yields across the curve.
In Japan, preliminary Industrial Production is expected to have contracted at an annualized 0.3% in April, while Retail Sales expanded 5% over the last twelve months. Further data saw Consumer Confidence improve a tad to 36 in May, and Housing Starts contracted 11.9% in the year to April.
The upper resistance level for USD/JPY is currently at the 2023 high at 140.91 (May 29). If the pair clears this level, it may potentially revisit the weekly peaks at 142.25 (November 21, 2022) and 148.84 (October 31, 2022). On the flip side, there is significant contention at the key 200-day SMA at 137.25 before reaching the temporary 55-day and 100-day SMAs at 134.70 and 133.72, respectively. In a downward direction, the pair might retest the weekly low at 133.01 (April 26) followed by minor support at 132.01 (April 13) and the April low at 130.62 (April 5). In the event of a more significant retracement, the March low of 129.63 (March 24) and the February low of 128.08 (February 8) could become prominent, seconded by the 2023 low at 127.21 (January 16). The RSI looked breached the 63 yardstick.
Resistance levels: 140.93 141.61 142.25 (4H chart)
Support levels: 139.27 138.22 137.42 (4H chart)
GBPUSD
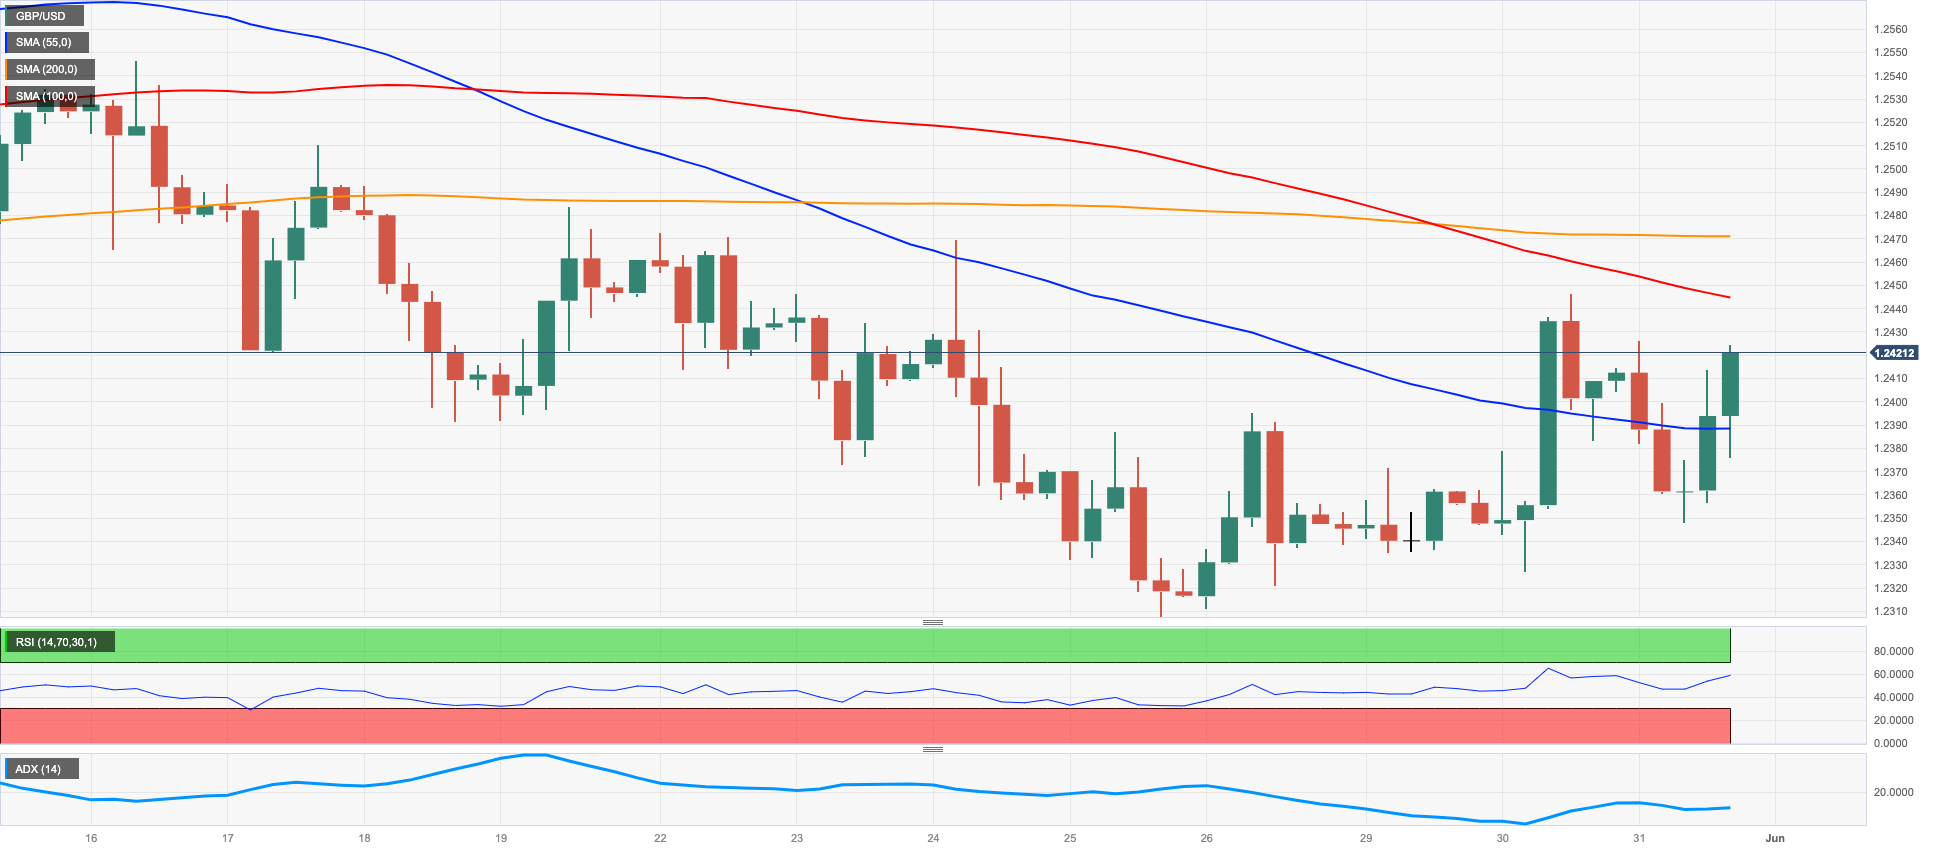
The sudden loss of momentum in the dollar motivated GBP/USD to made an abrupt U-turn and extend the weekly recovery for the fourth session in a row on Wednesday.
Indeed, Cable retreated to the mid-1.2300s against the backdrop of intense upside momentum in the greenback - which clocked new 2-month highs when gauged by the USD Index (DXY) – although it managed to stage quite a marked rebound north of the 1.2400 the figure afterwards.
In the meantime, expectations of an interest rate hike by the Fed in June should keep the British pound (and its risky peers) on a cautious note, although further repricing of extra tightening by the BoE should limit occasional losses and underpin bullish attempts. So far, market participants still favour the policy rate to 5.50% (from 4.5% currently).
The UK calendar was empty on Wednesday.
Immediately to the downside in GBP/USD comes the May low of 1.2308 (May 25), just ahead of the provisional 100-day SMA at 1.2292 and before the April low of 1.2274 (April 3). In the event that the pair keeps on falling, it might focus on the 200-day SMA at 1.1984 in front of the 2023 low of 1.1802 (March 8). On the contrary, the initial hurdle emerges at the weekly top of 1.2546 (May 16), trailed by the 2023 pinnacle of 1.2679 (May 10). Further north aligns the 200-week SMA at 1.2865 in front of the mental degree of 1.3000. The day to day RSI rose marginally past 48.
Resistance levels: 1.2446 1.2470 1.2510 (4H chart)
Support levels: 1.2308 1.2274 1.2189 (4H chart)
AUDUSD
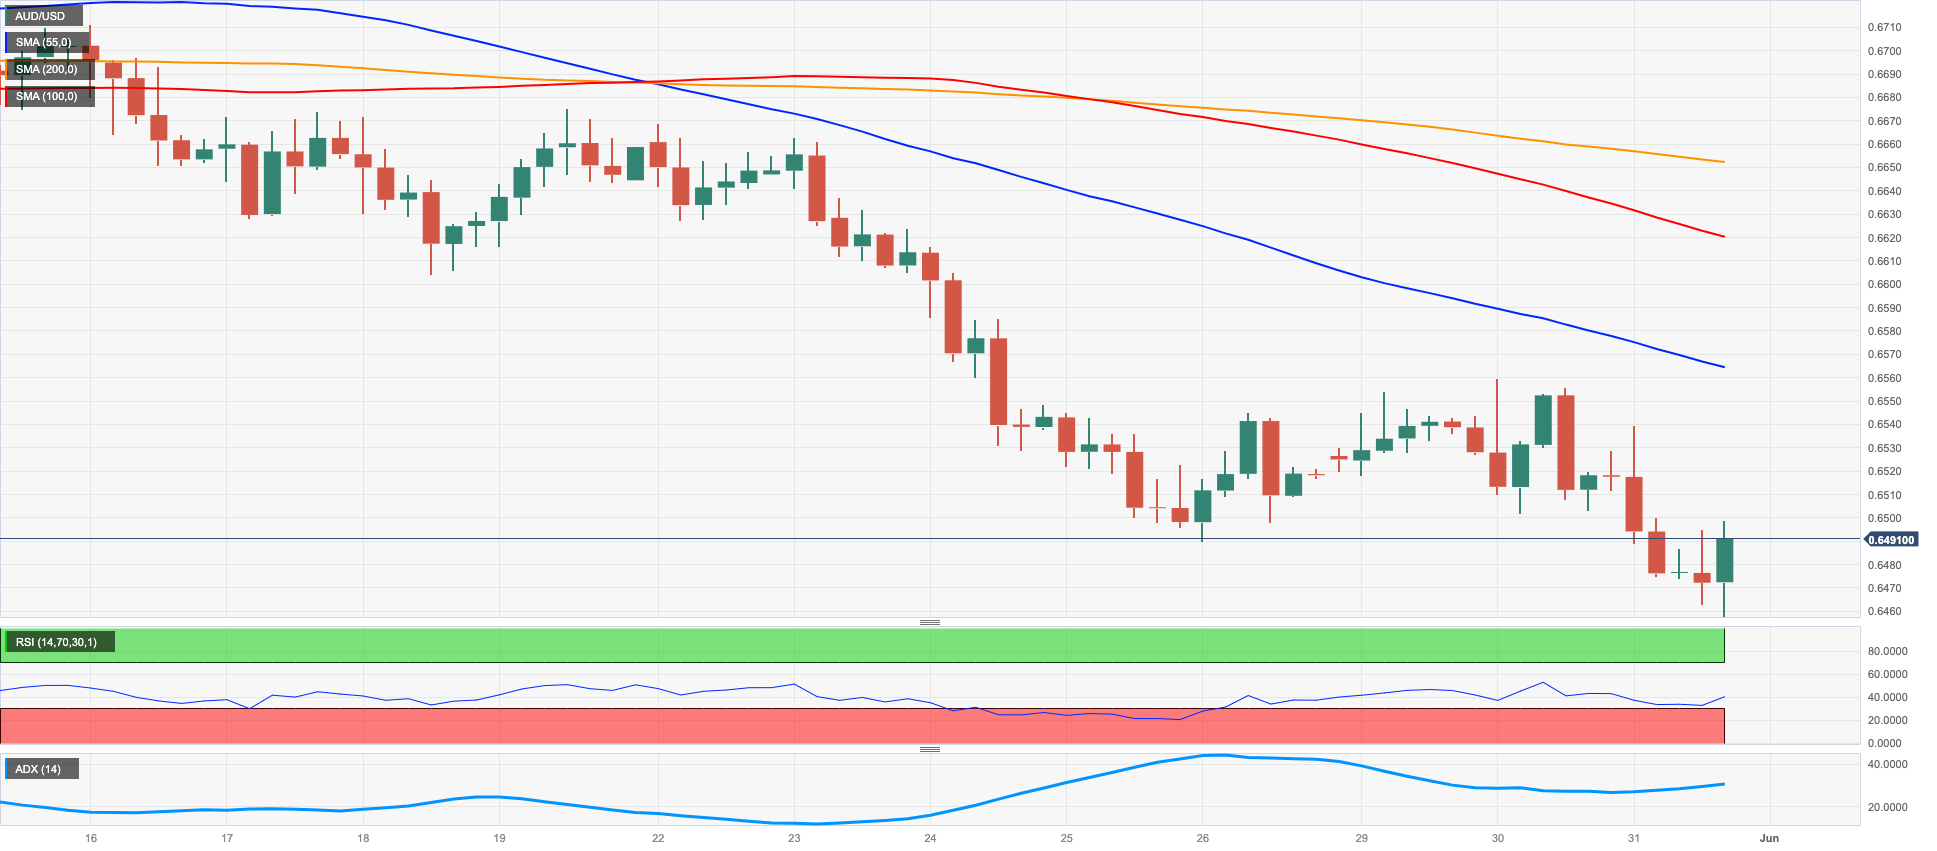
The combination of persistent strength in the greenback and disappointing prints from the Chinese docket played against any recovery attempt in AUD/USD and confined it to trading at new lows for the year around 0.6470/65 on Wednesday.
Indeed, lower-than-expected prints from the Manufacturing and Services PMIs in China reignited concerns over a bumpy recovery of the Chinese economy post-pandemic and kept the price action around the Aussie dollar depressed.
Adding to the daily decline, the commodity complex traded mostly on the defensive, with copper prices adding to Tuesday’s pullback and iron ore extending the drop to the key $100 mark per tonne.
Data-wise Down Under, Housing Credit expanded 0.3% in April from a month earlier, and the Monthly CPI Indicator ticked higher to 6.8% in April (from 6.3%).
If the AUD/USD goes below the 2023 low of 0.6466 (May 31), it might fall as low as 0.6386 (November 10, 2022) and 0.6272 (November 3). By contrast, the 55-day and the 200-day SMAs at 0.6666 and 0.6696, respectively, are immediate resistance levels, followed by the May high of 0.6818 (May 10) and the psychological milestone of 0.7000. The next resistance levels above this range are the weekly high of 0.7029 (February 14) and the 2023 peak of 0.7157 (February 2). The daily RSI retreated to the sub-35 region.
Resistance levels: 0.6554 0.6628 0.6675 (4H chart)
Support levels: 0.6458 0.6386 0.6272 (4H chart)
GOLD
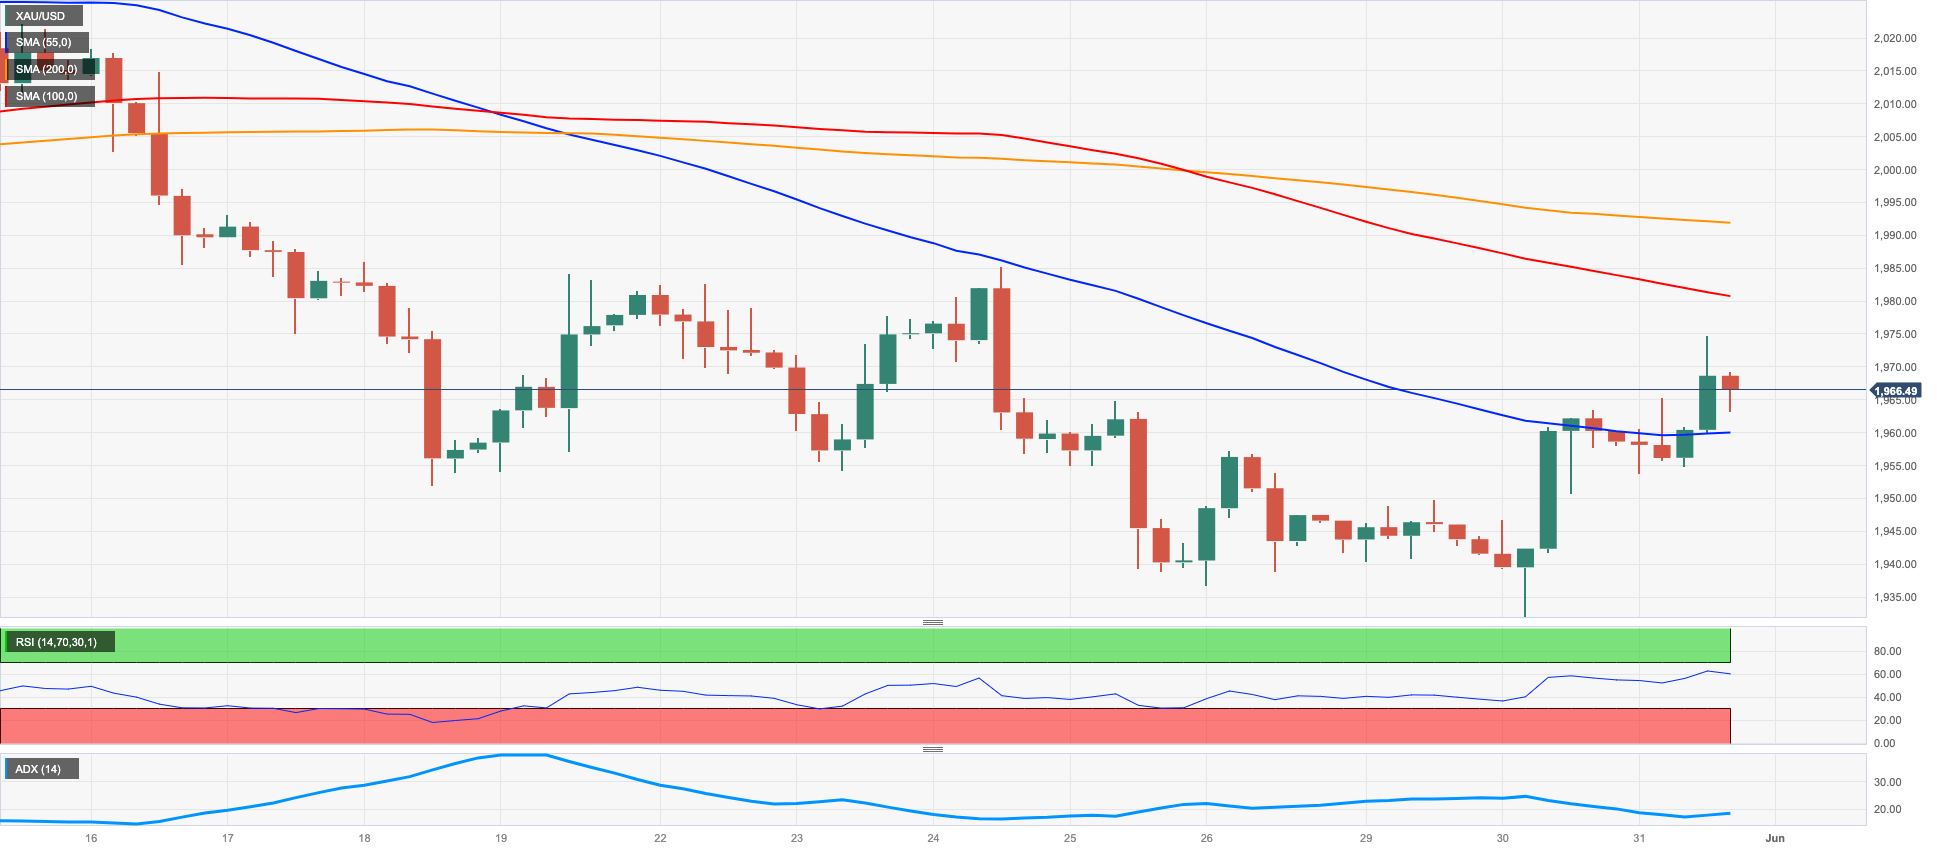
Gold prices have kept the erratic performance in place so far this week and set aside Tuesday’s pullback to instead advance at a decent pace past the $1970 mark per ounce troy.
Daily gains in the yellow metal came despite another strong session for the greenback, although they appeared to be bolstered instead by the downward trajectory in US yields across the curve.
In addition, uncertainty ahead of the debt ceiling vote later on Wednesday as well as rising speculation of another quarter-point rate raise by the Fed in June were also factored into Tuesday’s price action.
Despite its recent recovery, gold is still under pressure for the time being. If it falls below the May low of $1932 (May 30), which looks to have some support from the vicinity of the temporary 100-day SMA at $1937, it is expected to fall further towards the 200-day SMA at $1833, well before reaching the 2021 bottom of $1804 (February 28). Having said that, and despite occasional recoveries, provisional resistance at the 55-day SMA at $1988 may be encountered before reaching the big milestone of $2000. There are no significant resistance levels until the 2023 high of $2067 (May 4), which is supported by the March 2022 top of $2070 (March 8) and the all-time peak of $2075 (August 7 2020).
Resistance levels: $1974 $1985 $2022 (4H chart)
Support levels: $1932 $1885 $1809 (4H chart)
CRUDE WTI
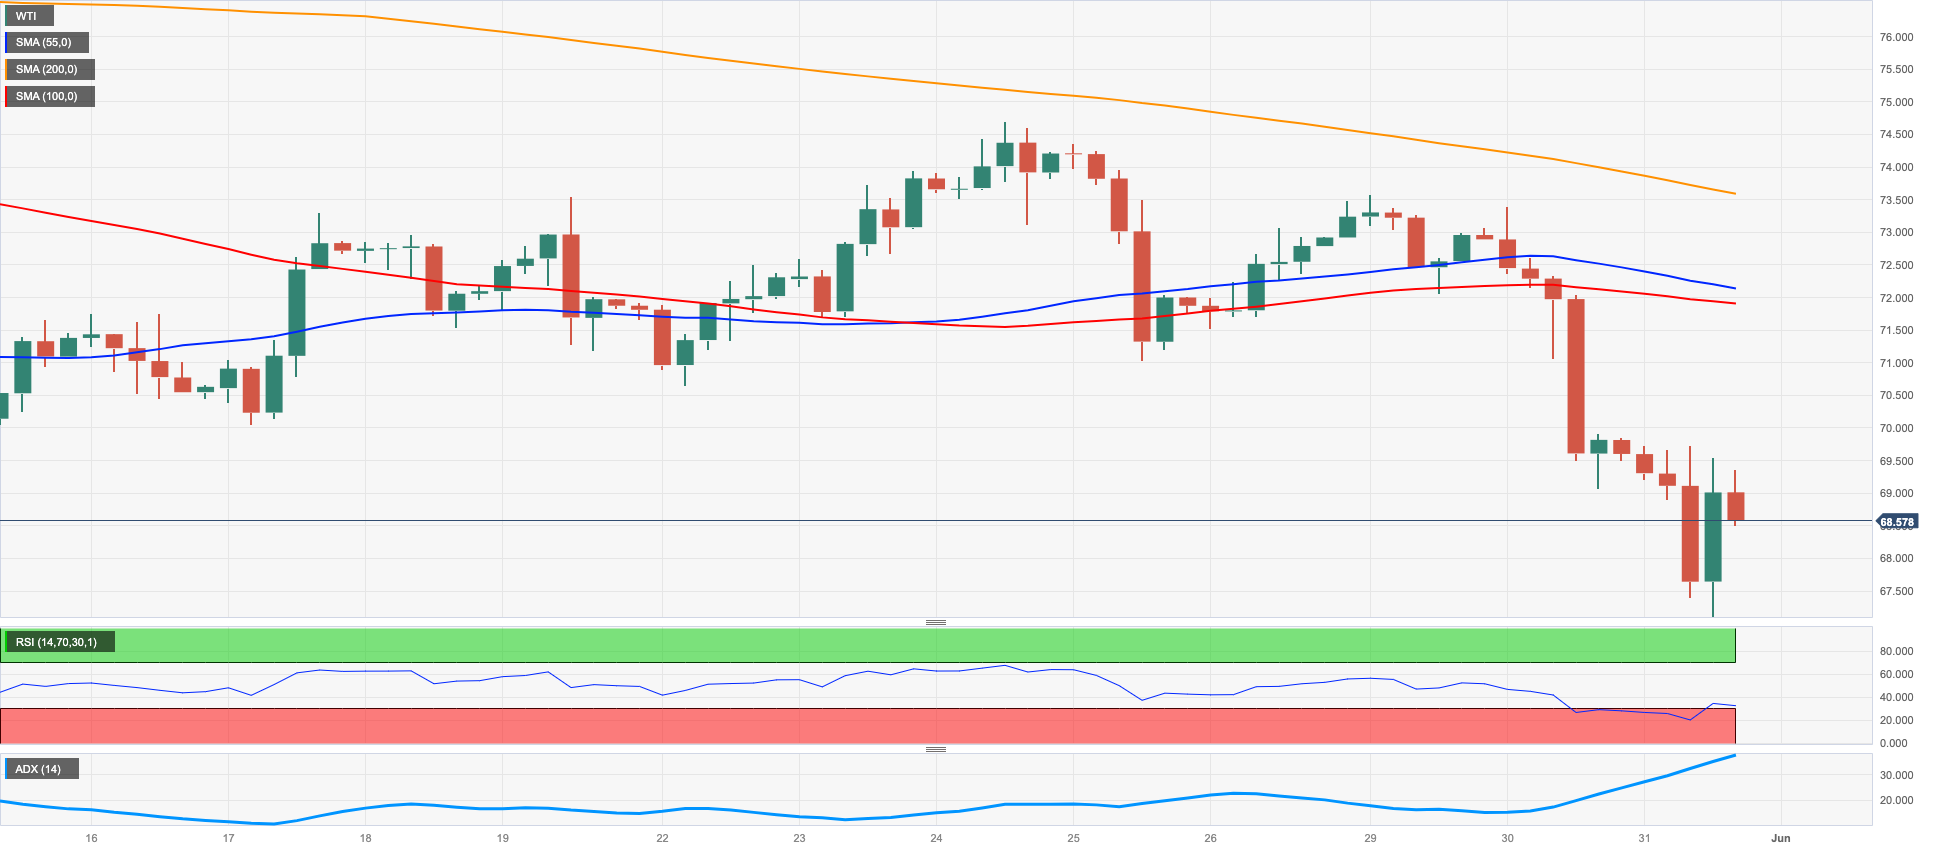
WTI prices added to Tuesday’s retracement and dropped to new 4-week lows near the $67.00 mark per barrel on Wednesday.
Demoralizing results from Chinese manufacturing and services gauges for the month of May published earlier in the Asian trading hours hurt traders’ sentiment and sponsored the second consecutive daily drop in the commodity.
In addition, the relentless ascent in the greenback pushed the USD Index (DXY) to new highs on the back of firmer speculation of another 25 bps rate hike by the Fed at the June 14 event.
There seems to be no positives for crude oil on Wednesday, as the EIA informed that crude oil production in the U.S. increased in March to 12.696 mbpd, which marks the highest level since March 2020, when the global energy demand was severely impacted by the COVID-19 pandemic.
Later in the NA session, the API will report on weekly US crude oil inventories for the week ended May 26.
WTI has definitely lost the grip this week. Against that, the immediate contention aligns at the 2023 low of $63.61 (May 4), backed by the December 2021 low of $62.46 (December 2), all prior to the key $60.00 per barrel. Just the opposite, the provisional 55-day SMA at $74.08 precedes the weekly high of $74.69 (May 24) and the transitory 100-day SMA at $75.78. North from here comes the weekly peak at $79.14 (April 24), which remains propped up by the key 200-day SMA at $79.59 and the important $80.00 zone. If the rebound becomes more robust, the 2023 peak of $83.49 (April 12) and the November 2022 top of $93.73 (November 7) await.
Resistance levels: $74.69 $76.89 $79.14 (4H chart)
Support levels: $67.08 $63.61 $62.42 (4H chart)
GER40
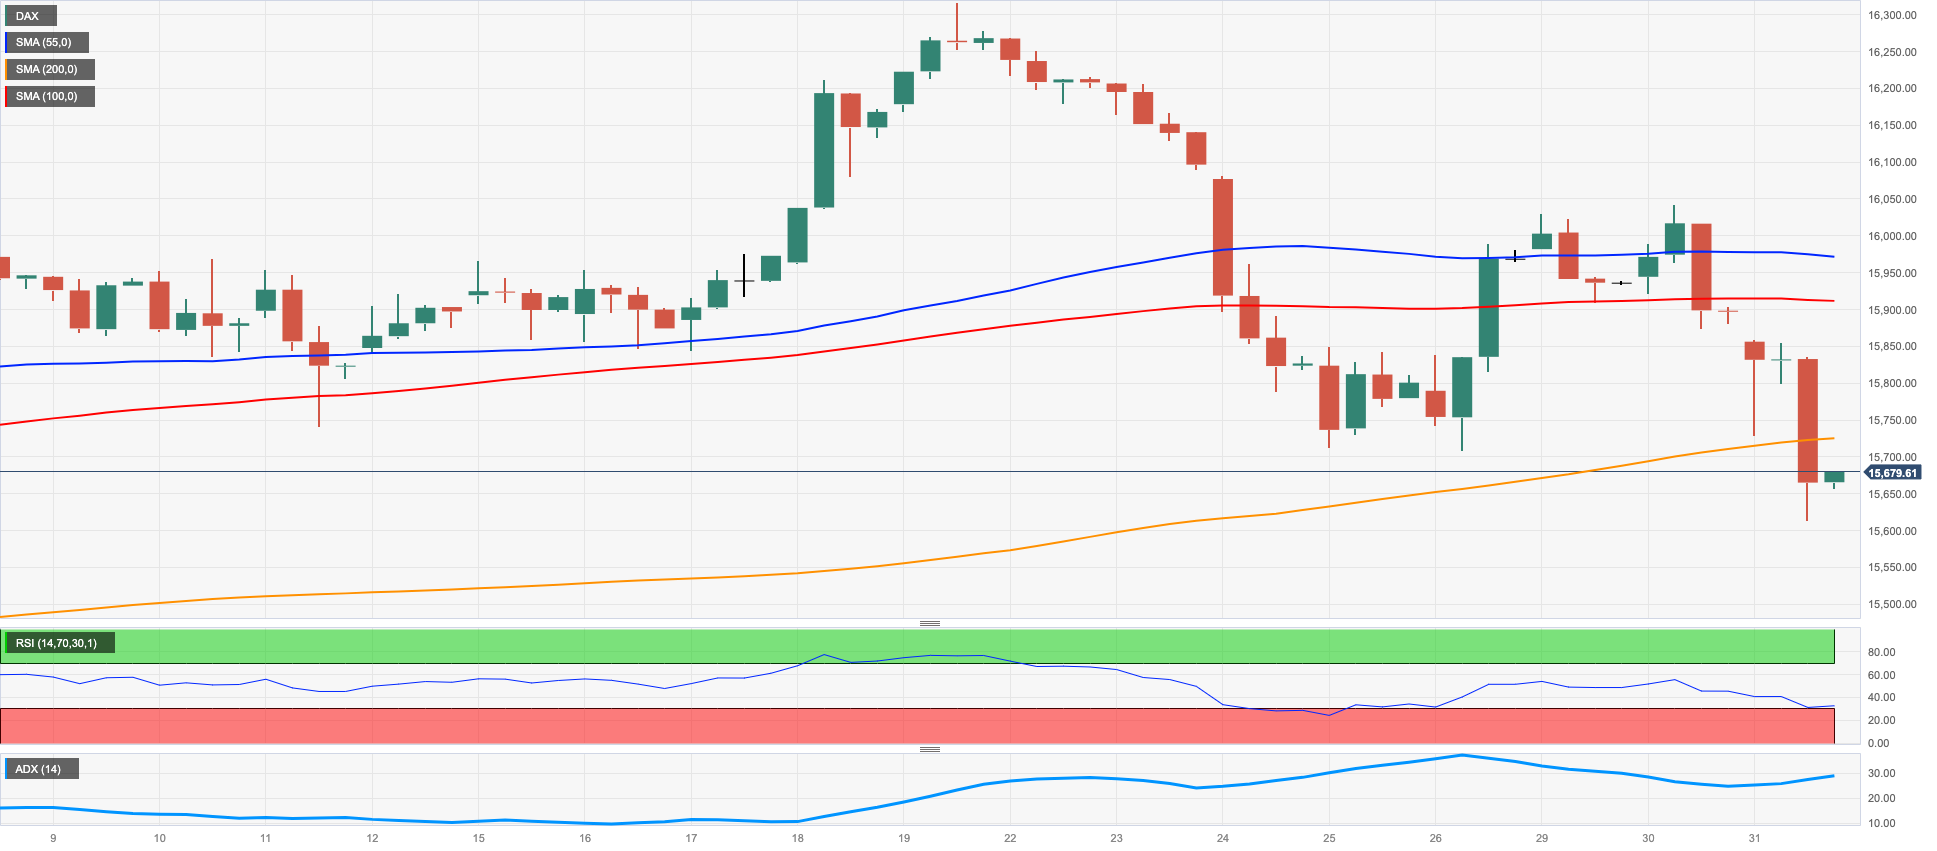
German stocks tracked by the DAX40 retreated sharply to monthly lows near the 15600 region on Wednesday.
It is worth noting that the index closed with losses in every session since Monday on the back of the resurgence of the risk-off sentiment and persistent unease ahead of the vote on the US debt ceiling.
In the German bonds market, the 10-year Bund yields broke below the 2.30% level, or new multi-day lows.
Interesting session in the domestic calendar saw Germany's Unemployment Change rise by 9K people, while the unemployment rate stayed at 5.6% for the current month. In addition, preliminary inflation estimates show that the CPI fell 0.1% MoM and rose 6.1% YoY.
The DAX40 seems to have broken below the consolidation phase. Sellers should first find support at the May low of 15629 (May 31) before reaching the interim 100-day SMA at 15492, which appears closely followed by the April low of 15482 (April 5). Down from here emerges minor support levels including 14809 (March 24) and the March low of 14458 (March 20). The important 200-day line SMA around 14448 could also play an important role in subsequent critical pullbacks. On the upside, the next hurdle of note comes at the all-time top of 16331 (May 19). The daily RSI eased below 42.
Best Performers: RWE AG ST, SAP, Munich Re Group
Worst Performers: Covestro, Continental AG, Porsche
Resistance levels: 16079 16331 17000? (4H chart)
Support levels: 15629 15482 14809 (4H chart)
NASDAQ
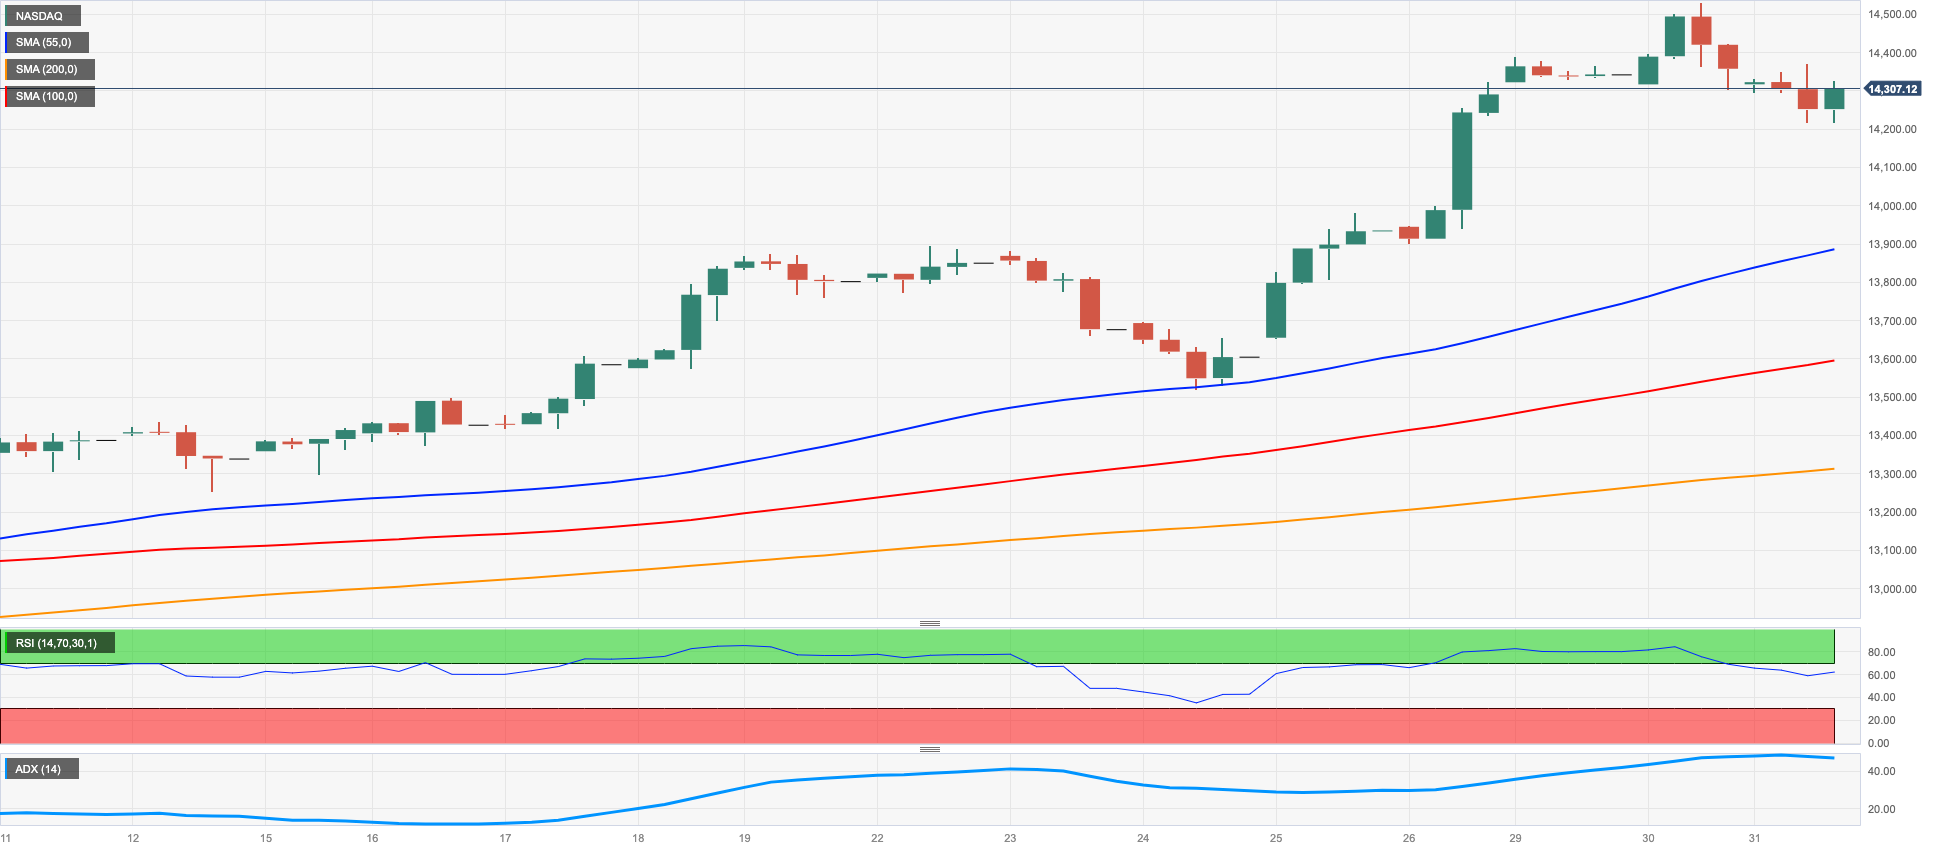
Tech equities measured by the reference Nasdaq 100 reversed two consecutive daily advances after coming under some selling pressure on Wednesday.
Indeed, the index shed some ground following Tuesday’s fresh YTD highs beyond the 14500 yardstick on the back of the generalized risk-off sentiment, the stronger dollar, and a renewed loss of momentum in megacaps.
Extra cautiousness among traders emerged ahead of the US debt ceiling vote, expected later in the US evening.
Some impasse seems to have turned up in the ongoing rise of the Nasdaq 100. If it surpasses the 2023 high of 14520 (May 30), it may open the door for a further surge towards the March 2022 top of 15265 (March 29) ahead of the round level at 16000. On the downside, the weekly low of 13520 (May 24) provides immediate support, followed by the 55-day SMA at 13144 and the May low of 12938 (May 4). This support level comes before the April low of 12724 (April 25), the 200-day SMA of 12145, the March low of 11695 (March 13), and the weekly lows of 11550 (January 25) and 11251 (January 19). A steeper slide might put the 2023 bottom at 10696 (January 6) in jeopardy. The RSI receded to the 71 area, still in the overbought territory.
Top Gainers: Intel, DexCom, Intuit
Top Losers: Marvell, NVIDIA, AMD
Resistance levels: 14520 15161 15265 (4H chart)
Support levels: 13520 13196 12938 (4H chart)
DOW JONES
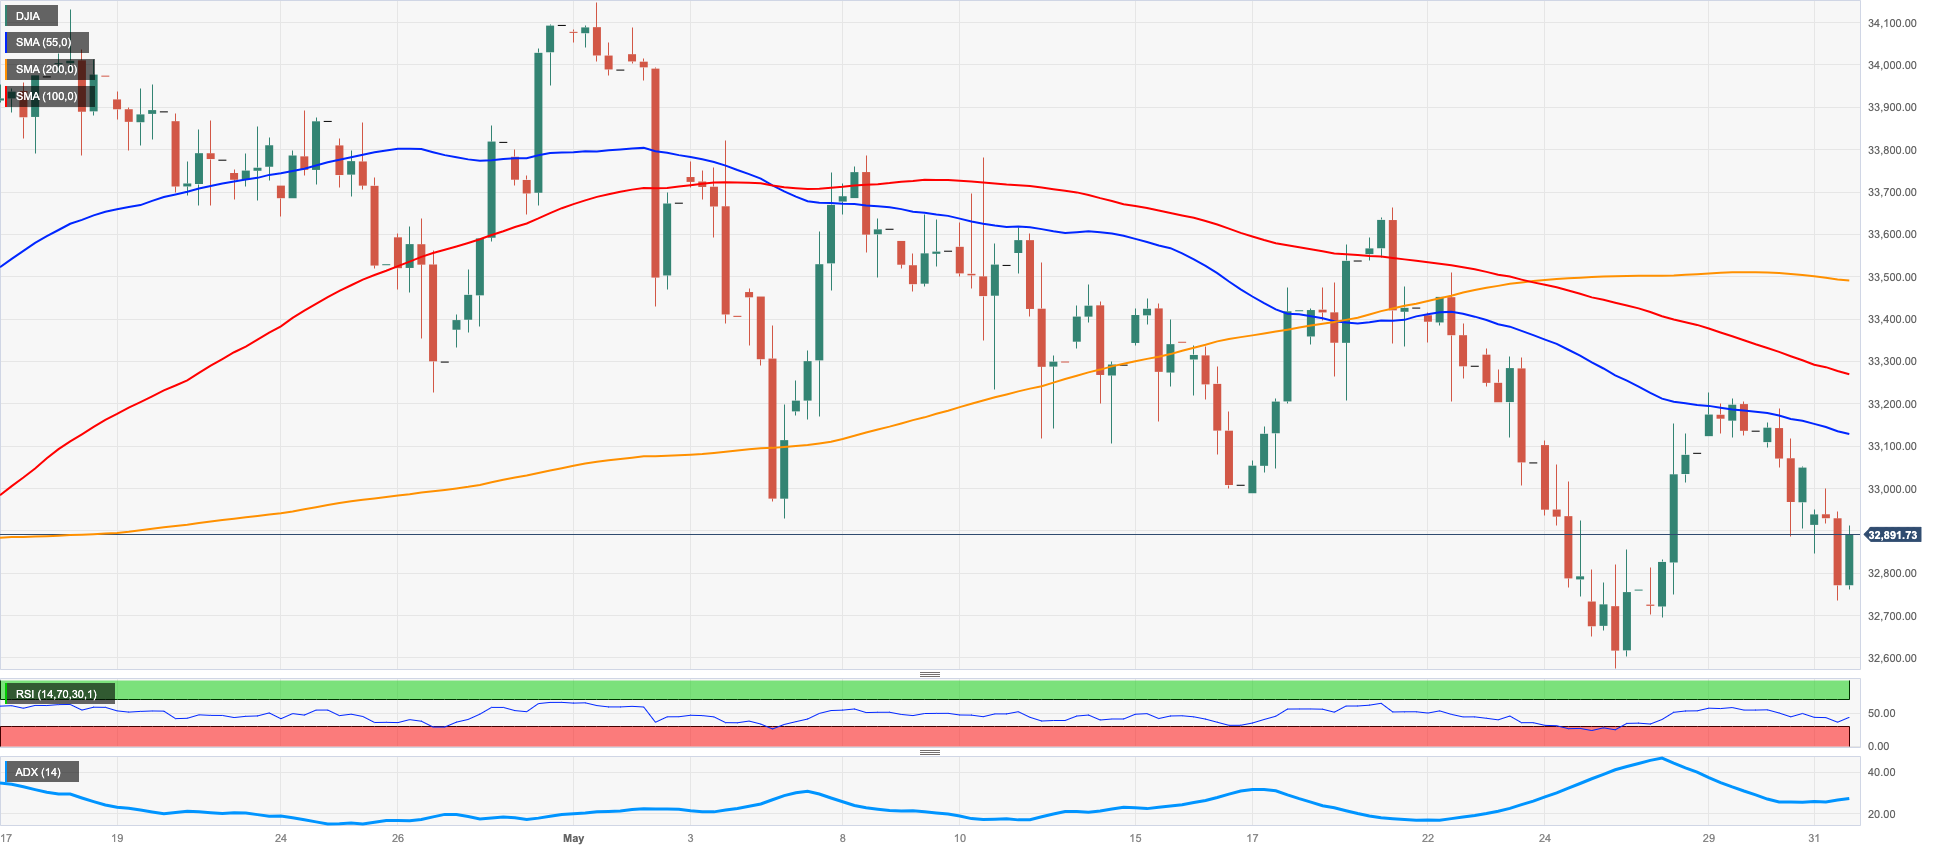
Stocks measured by the Dow Jones dropped for the second straight session and fully faded last Friday’s strong advance, revisiting at the same time the important 200-day SMA around the 32700 region on Wednesday.
The index came under pressure in response to increasing expectations of further tightening of monetary conditions by the Federal Reserve as soon as the June 14 gathering. This view was particularly exacerbated after US JOLTs Job Openings increased more than estimated in April, although late comments from Fed’s Harker and Jefferson reignited the idea of a pause next month instead.
Also adding to the downbeat mood among investors was the steady cautiousness after proposed legislation aiming to eliminate the current U.S. debt ceiling of $31.4 trillion and implement fresh reductions in federal spending reached the House of Representatives for deliberation on Tuesday. A vote on its approval is anticipated to take place later in the evening.
Overall, the Dow Jones retreated 0.37% to 32920, the S&P500 dropped 0.42% to 4187, and the tech-reference Nasdaq Composite deflated 0.30% to 12977.
In case the Dow Jones accelerates the decline, it could see the May low at 32586 (May 25) revisited ahead of the 2023 low of 31429 (March 15) and the 2022 low of 28660 (October 13). On the other hand, if the index surpasses the weekly high of 33652 (May 19), there is potential for a more significant recovery. It may then face resistance at the May top of 34257 (May 1), followed by the 2023 peak of 34342 (January 13) and the December 2022 pinnacle of 34712 (December 13). If the index is able to exceed these levels, it could reach the April 2022 high of 35492 (April 21). The day-to-day RSI deflated to the proximity of 41.
Top Performers: Intel, Verizon, Merck&Co
Worst Performers: 3M, Home Depot, JPMorgan
Resistance levels: 33162 33330 33652 (4H chart)
Support levels: 32586 31805 31429 (4H chart)
All Information & Updates provided by:

All information relating to the financial markets available on this page has been prepared and issued by FXStreet (Forexstreet SL, Spain, Reg: B62498233) on the basis of publicly available information and all information believed to be reliable and does not conflict with Kuwaiti local laws, and all necessary care has been taken to before the company to ensure that the facts mentioned are correct from the source.
NCM Investment nor any of its directors or employees shall in any way be held responsible for the contents of this news, and the information contained on this page is intended only to provide clients with publicly available information and should not be construed as investment advice, report or analysis and/or constitute an offer or invitation to buy or sell financial instruments of any kind.
RISK WARNING: Forex and CFDs are highly risky leveraged products, as losses can exceed deposits. Please ensure you understand all the risks and take independent advice if necessary. NCM will segregate the clients based on the criteria of the regulator and its bylaws. NCM does not provide any advisory service; the material published does not constitute advice or a recommendation for a transaction in any financial instrument. NCM accepts no responsibility for any use of the content presented and any consequences of that use. Anyone acting on the information provided does so at their own risk.