
- Contact Us:
-

-

-

-


Daily Market Updates
02 Jun 2023
USDJPY
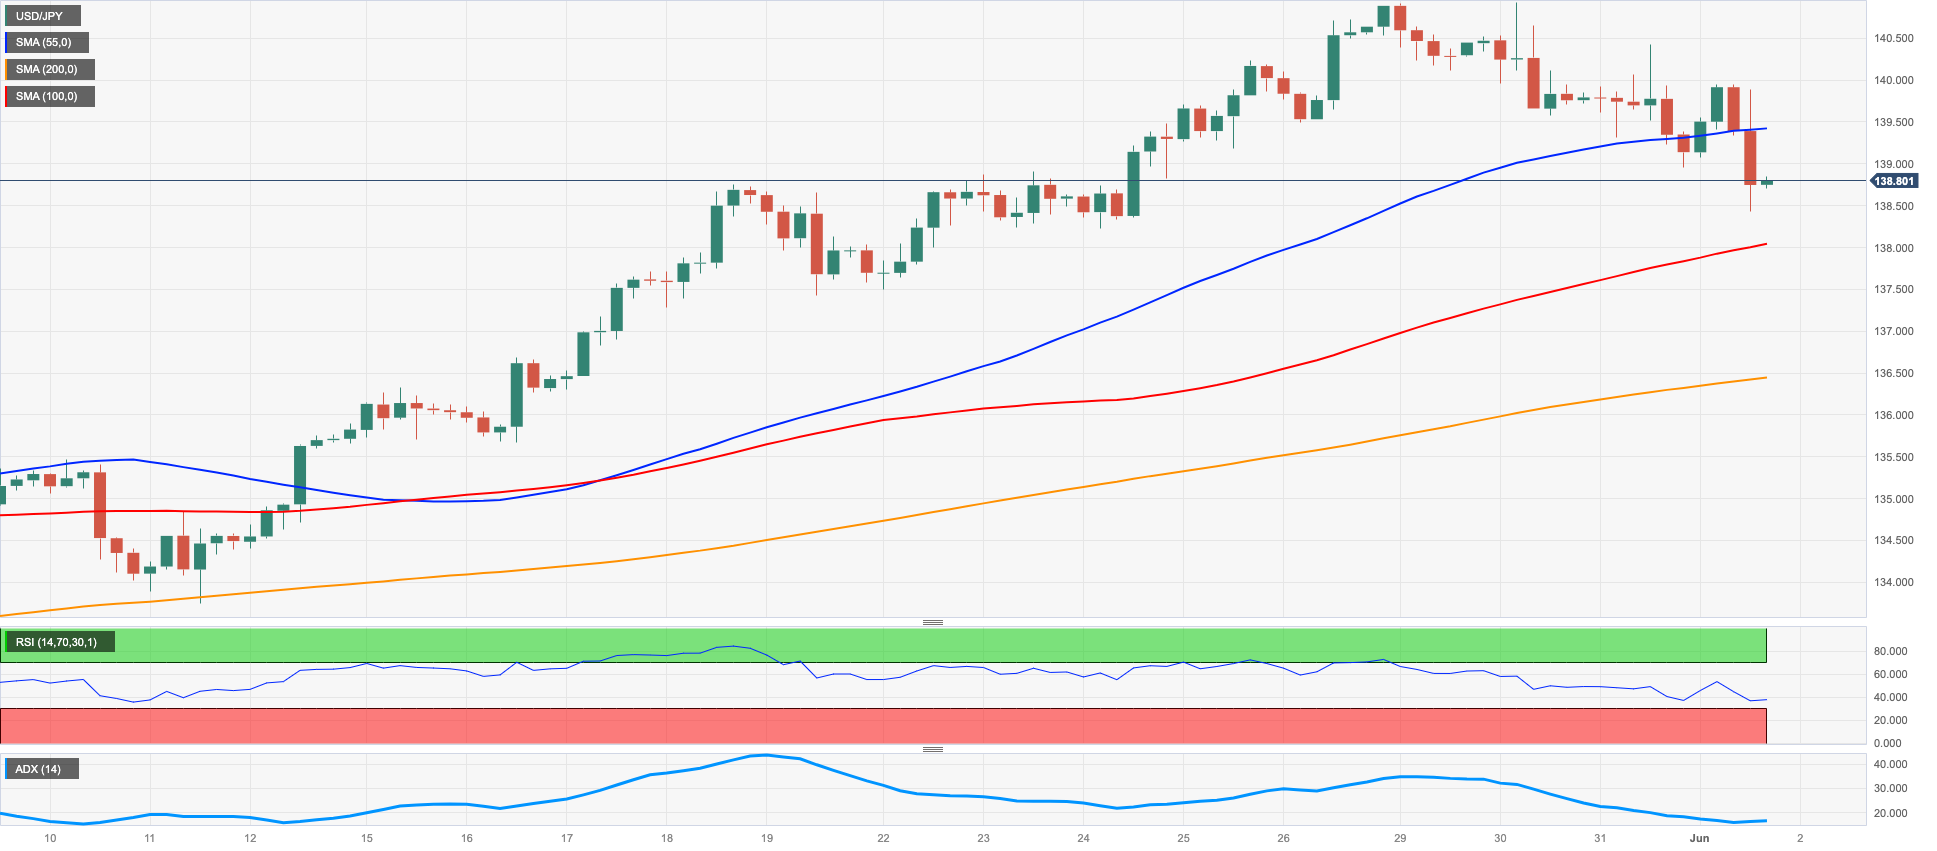
On Thursday, fresh weakness in the greenback and the persevering downward bias in US yields across the curve caused USD/JPY to record losses for the fourth consecutive session, this time revisiting multi-day lows near 138.40.
In fact, spot extended further the rejection from 2023 tops in levels just shy of 141.00 the figure (May 30) following the U-turn in expectations surrounding another 25 bps rate hike by the Fed later in the month, while cautiousness remained high ahead of the release of US Nonfarm Payrolls on Friday.
In the Japanese docket, Capital Spending expanded 11% YoY in the January-March period and Foreign Bond Investment rose to ¥1028.8B in the week to May 27.
USD/JPY now faces a key support at the 200-day SMA of 137.26 before hitting the transitory 55-day and 100-day SMAs of 134.78 and 133.81, respectively. In a negative trend, the pair may retest the weekly low of 133.01 (April 26), minor support at 132.01 (April 13), and the April low of 130.62 (April 5). In the case of a larger retracement, the March low of 129.63 (March 24) and the February low of 128.08 (February 8) might become prominent. On the upside, the next target of note emerges at the 2023 high of 140.91 (May 29) ahead of the weekly tops of 142.25 (November 21, 2022) and 148.84 (October 31, 2022). The daily RSI dropped below the 59 level.
Resistance levels: 140.41 140.93 141.61 (4H chart)
Support levels: 138.42 138.22 137.42 (4H chart)
GBPUSD
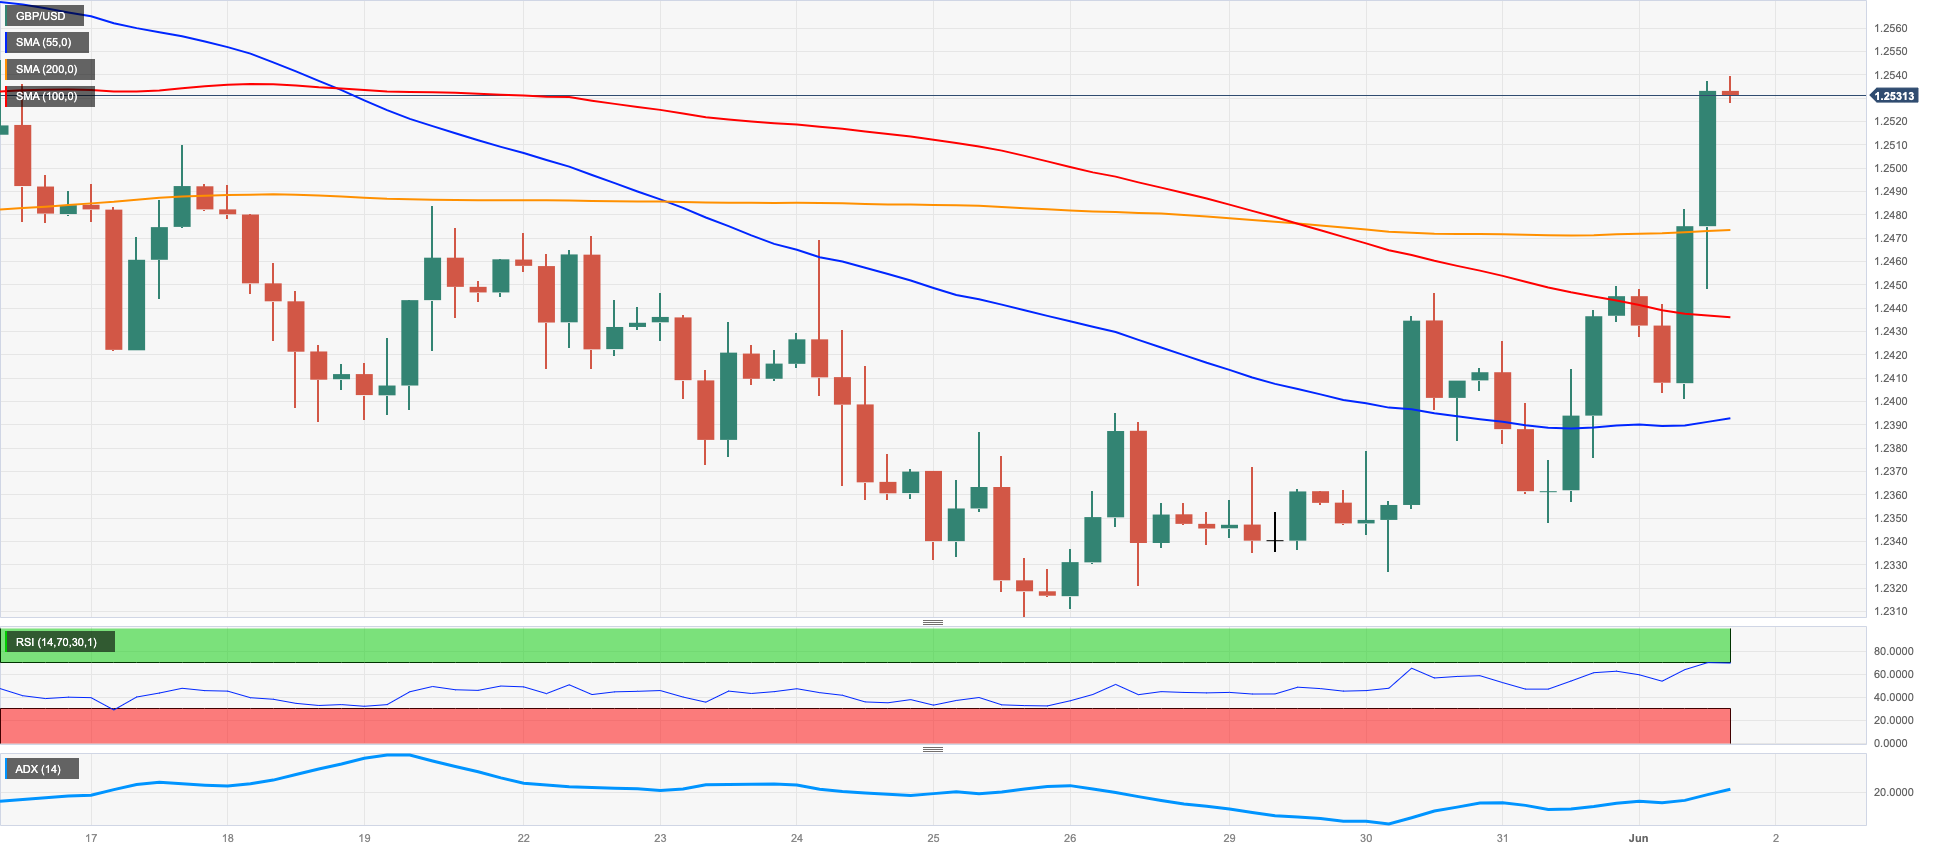
GBP/USD extended its solid upside momentum and climbed to fresh 2-week highs north of the 1.2500 barrier on Thursday.
The marked pullback in the greenback in response to investors’ repricing of an impasse at the Fed’s meeting in June lent much-needed oxygen to the British pound and the rest of the risk complex, sponsoring at the same time the fifth consecutive daily advance in Cable.
Also collaborating with the upbeat mood in the quid, speculation of extra rate hikes by the BoE in the next few months remained steady and pointed to the policy rate peaking around 5.50% (from the current 4.5%).
In the UK, Nationwide Housing Prices contracted 3.4% YoY in May. Additional results showed Mortgage Approvals recede to 48.69K in April, Mortgage Lending contract by £1.384B and the final Manufacturing PMI deflate to 47.1 during last month.
Extra recovery in GBP/USD could now revisit the 2023 peak of 1.2679 (May 10) prior to the 200-week SMA at 1.2865, and the psychological level of 1.3000. Having said that, the May low of 1.2308 (May 25) is the immediate downside target for Cable, followed by the temporary 100-day SMA at 1.2296 and the April low of 1.2274 (April 3). If the pair continues to decline, it could aim for the 200-day SMA at 1.1988, which is located ahead of the 2023 low of 1.1802 (March 8). The daily RSI improved further and trespassed the 58 mark.
Resistance levels: 1.2539 1.2546 1.2679 (4H chart)
Support levels: 1.2396 1.2308 1.2274 (4H chart)
AUDUSD
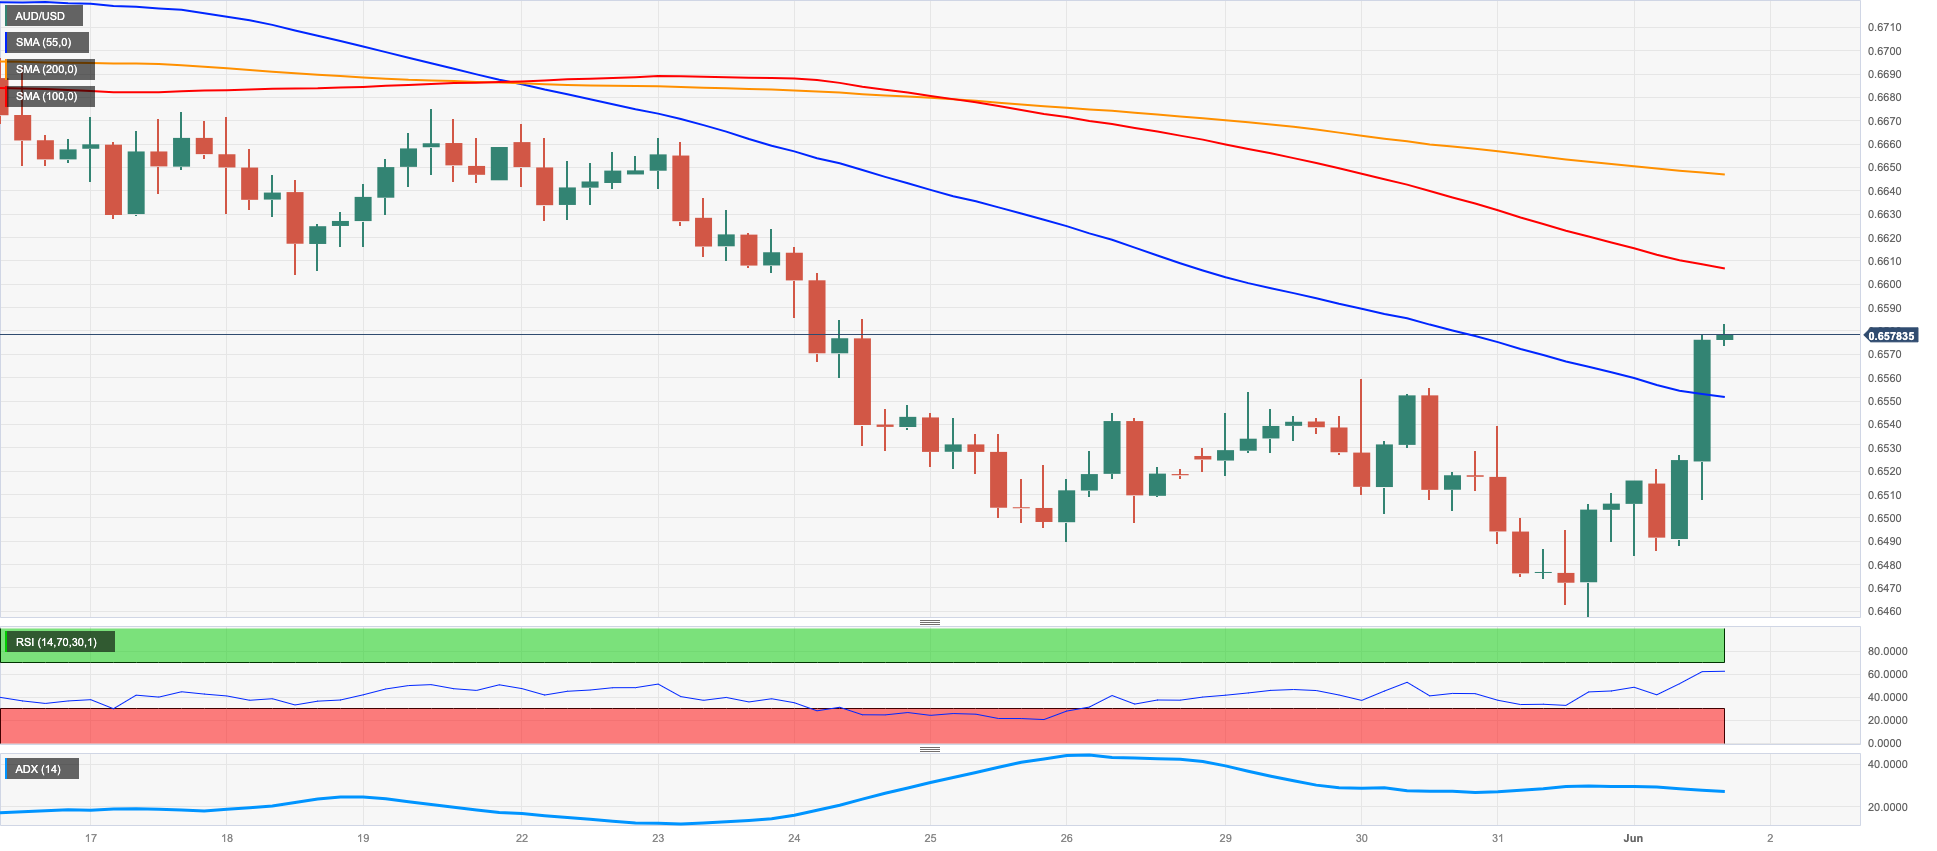
The marked knee-jerk in the greenback lent legs to the risk-linked galaxy and helped AUD/USD reverse part of the recent weakness and retest the 0.6580 region on Thursday, or multi-session tops.
Extra wings for the Aussie dollar came from the commodity complex and the modest recovery in copper prices and iron ore, while the better-than-estimated print from the Chinese Caixin Manufacturing PMI (50.9) also contributed to the daily uptick. The Caixin PMI is generally regarded as a survey that includes a larger proportion of export-oriented respondents, with relatively smaller businesses.
In Oz, the final Judo Bank Manufacturing PMI ticked a tad higher to 48.4 in May.
If the AUD /USD falls below the 2023 low of 0.6458 (May 31), it could drop to 0.6386 (November 10, 2022) and 0.6272 (November 3). In contrast, the 55-day and 200-day SMAs at 0.6665 and 0.6694, respectively, are immediate resistance levels, followed by the May high of 0.6818 (May 10) and the psychological milestone of 0.7000. The next resistance levels above this area are the weekly high of 0.7029 (Feb 14) and the 2023 high of 0.7157 (Feb 2). The RSI on the daily chart advanced past the 65 hurdle.
Resistance levels: 0.6554 0.6650 0.6675 (4H chart)
Support levels: 0.6458 0.6386 0.6272 (4H chart)
GOLD
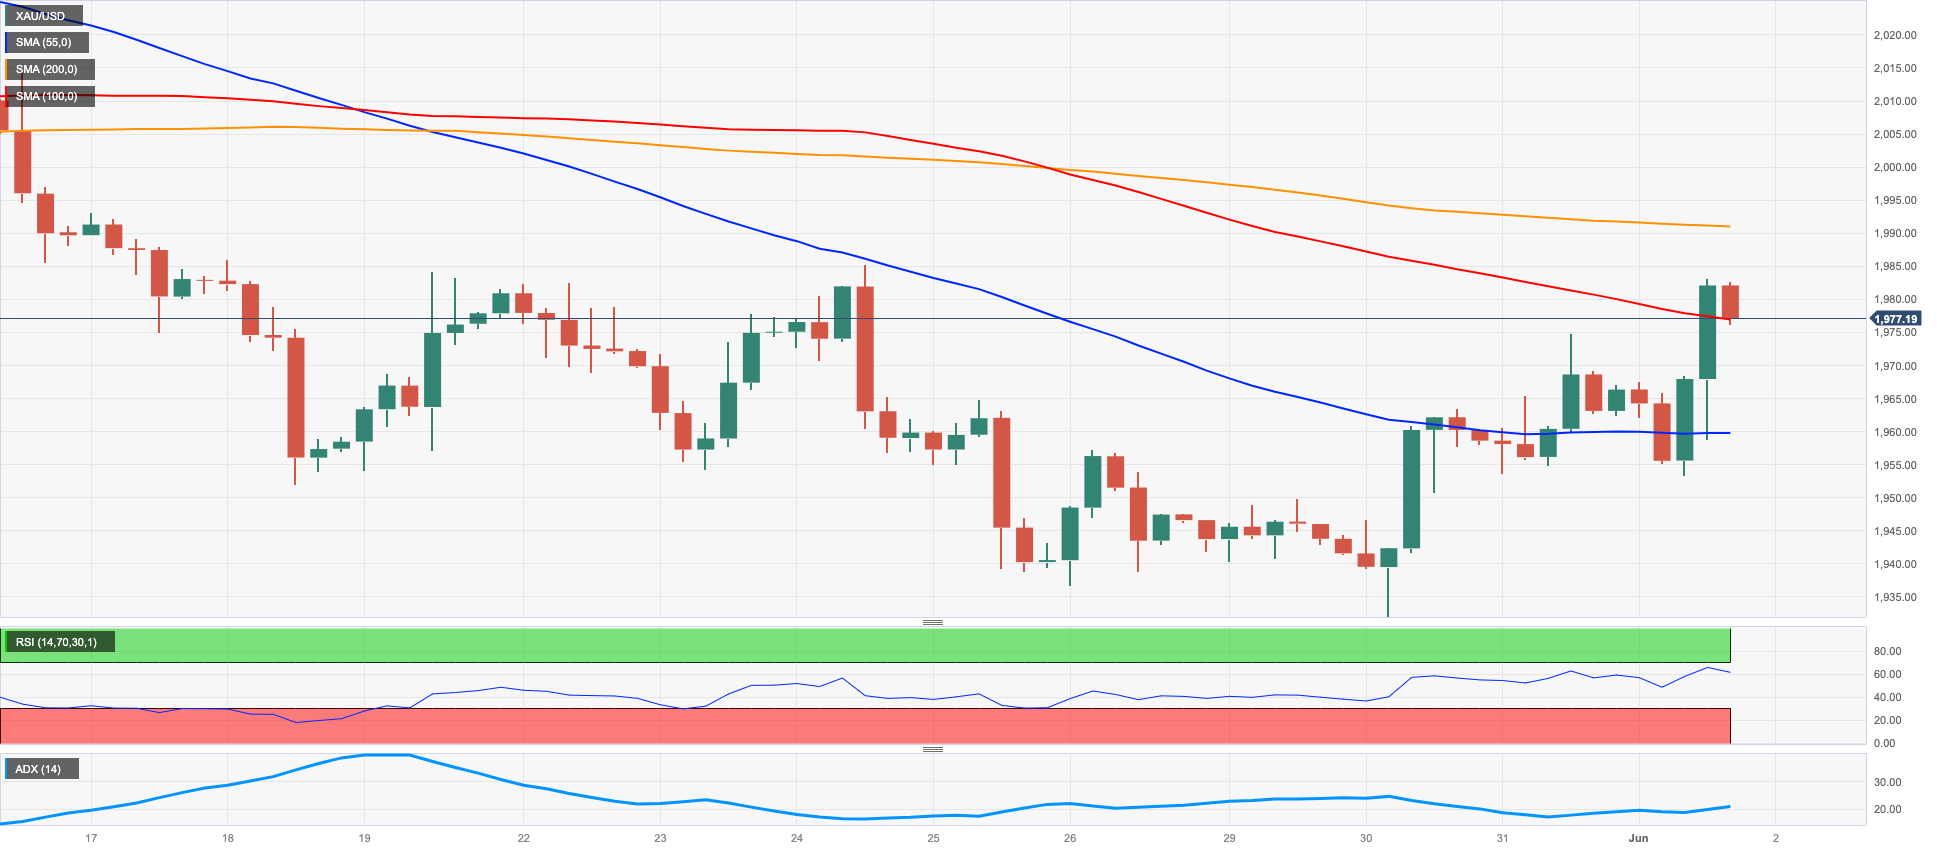
Gold prices added to Wednesday’s modest uptick and rose markedly to print multi-day highs past the $1980 mark per ounce troy on Thursday.
The strong retracement in the greenback coupled with the continuation of the selling pressure in US yields across the curve contributed to the weekly rebound in the yellow metal, which now refocused its attention to the key $2000 threshold.
In the meantime, bullion should face some increasing volatility as markets get closer to the publication of the US jobs report on Friday.
Gold continues to pick up pace following lows recorded earlier in the week. That said, preliminary opposition emerges at the 55-day SMA at $1989 before revisiting the major milestone of $2000. There are no notable resistance levels until the 2023 top of $2067 (May 4), which is supported by the 2022 high of $2070 (March 8) and the all-time peak of $2075 (August 7 2020). On the contrary, If bullion goes below the May low of $1932 (May 30), which appears to have some support from the temporary 100-day SMA, it is projected to fall lower towards the 200-day SMA at $1834, far before hitting the 2021 low of $1804 (February 28).
Resistance levels: $1983 $1991 $2022 (4H chart)
Support levels: $1932 $1885 $1809 (4H chart)
CRUDE WTI
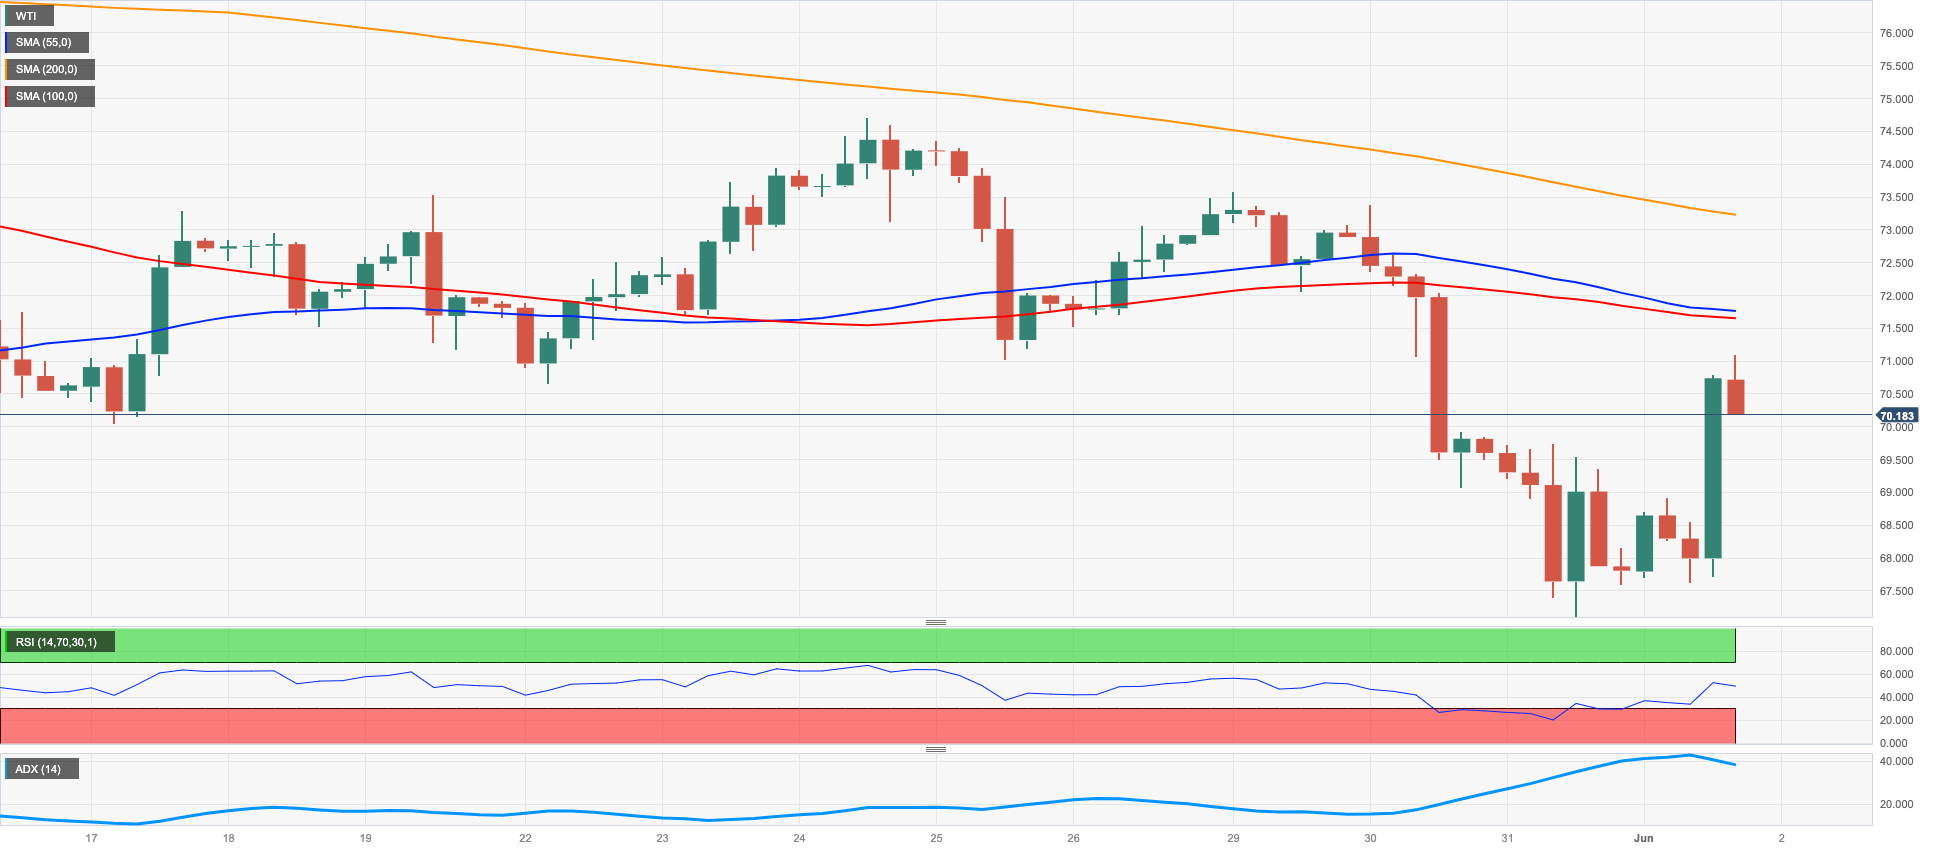
Prices of WTI rallied more than 4% and reclaimed the area just above the $71.00 mark per barrel on Thursday, abruptly reversing weekly lows near the $67.00 region (May 31) and ending two consecutive days with losses.
The reason behind the sharp advance in the commodity can be found in traders’ hopes of another oil output reduction that might be announced by Saudi Arabia at the OPEC+ meeting this weekend.
On the latter, it is worth recalling last week’s warning from the Saudi Energy Minister against those who bet on further weakness in prices of crude oil, which hinted at the possibility of a potential cut in oil production.
The softer tone in the US dollar also propped up the strong session in crude oil, which also managed to set aside the unexpected weekly build of US crude oil inventories.
On this, the EIA reported that US crude oil inventories unexpectedly increased by 4.488M barrels in the week to May 26, while supplies at Cushing rose by 1.628M barrels, Weekly Distillate Stocks went up by 0.985M barrels, and gasoline stockpiles went down less than estimated by 0.207M barrels.
WTI has experienced a significant decline this week and faces immediate contention at the weekly low of $67.08 (May 31) prior to the 2023 low of $63.61(May 4). This level is further reinforced by the December 2021 low of $62.46 (December 2), before reaching the key $60.00 mark per barrel. On the flip side, the interim 55-day SMA at $74.05 precedes the weekly top of $74.69 (May 24) and the provisional 100-day SMA at $75.73. Moving northward, the weekly peak at $79.14 (April 24) is supported by the key 200-day SMA at $79.59 just ahead of the important $80.00 zone. If the rebound strengthens further, the 2023 high of $83.49 (April 12) and the November 2022 top of $93.73 (November 7) are the next targets.
Resistance levels: $71.02 $73.44 $74.69 (4H chart)
Support levels: $67.08 $63.61 $62.42 (4H chart)
GER40
European equities navigated a "sea of green" on Thursday, as investors’ mood improved greatly after the US debt ceiling bill passed the House of Representatives and should see no obstacles to being approved by the Senate later on Thursday.
Indeed, market participants decided to look at the glass half-full and somewhat bypass another sticky print from inflation figures in the broader Euroland for the month of May and the subsequent hawkish narrative from many of the ECB’s rate setters—Lagarde included—who defended the continuation of the tightening cycle in the next couple of months at least.
Data-wise in Germany, Retail Sales contracted 4.3% in the year to April, and the final Manufacturing PMI came in a tad above the preliminary reading at 43.2 in May.
On another front, extra demand for the 10-year bund prompted yields to retreat to multi-session lows around 2/.25%.
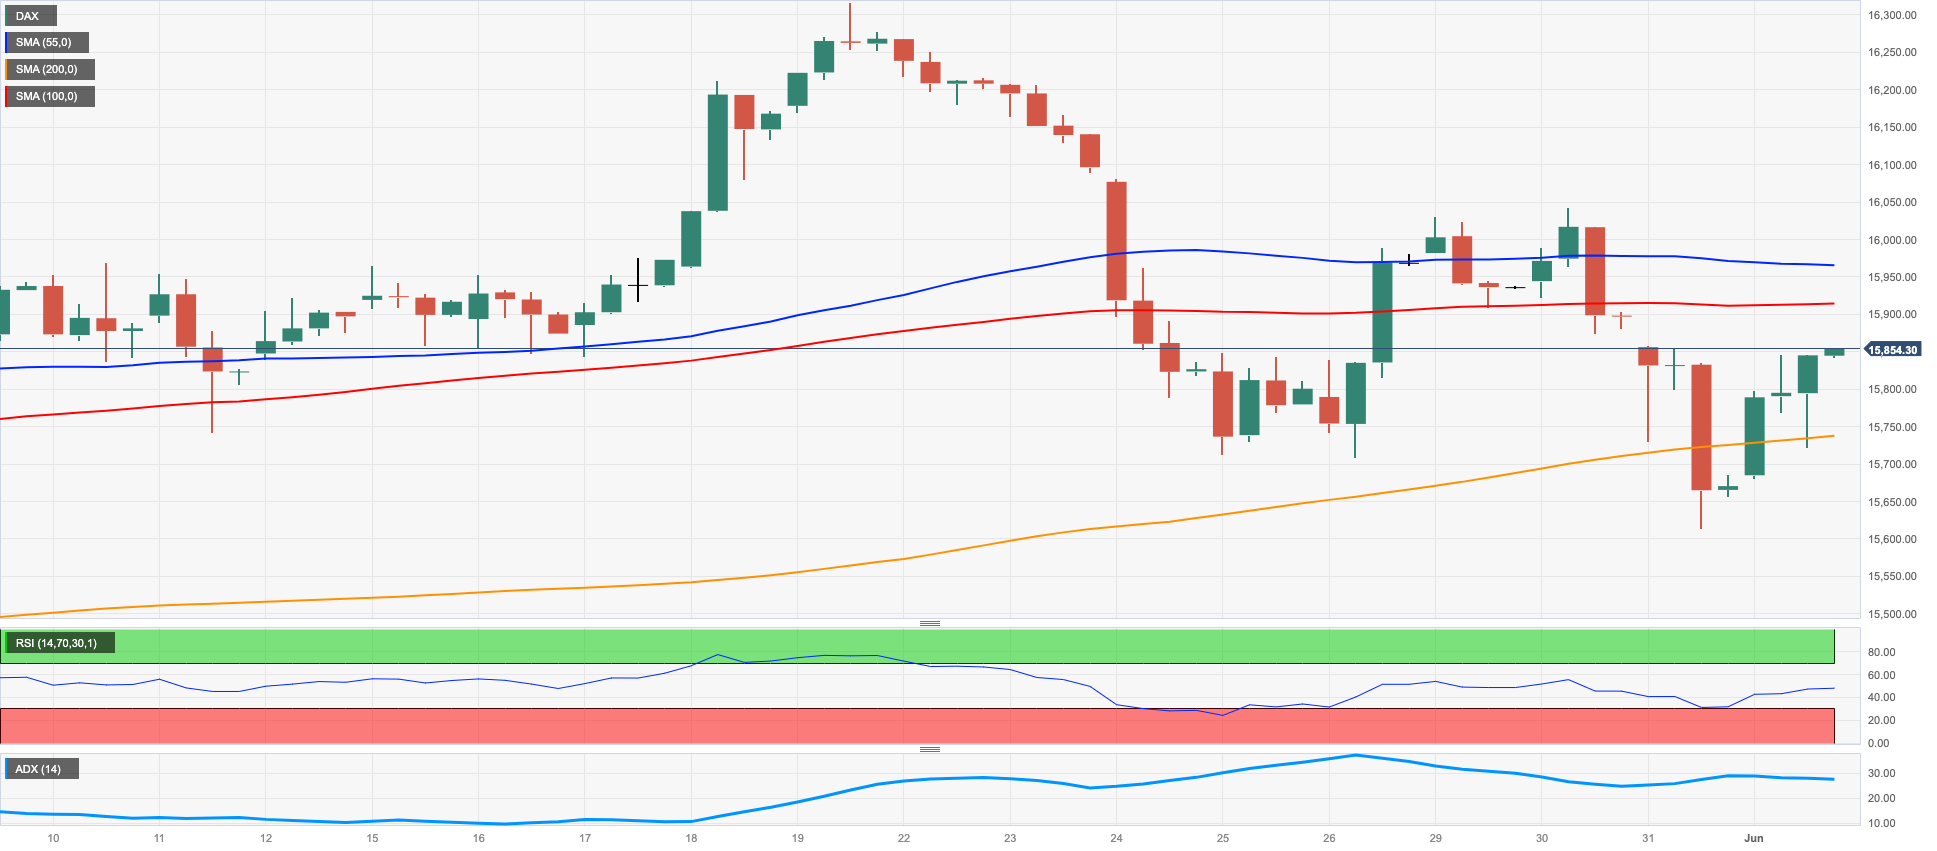
The DAX40 appears to have met a decent contention area at the May low of 15629 (May 31) before reaching the 100-day temporary SMA at 15503, which appears closely followed by the April low of 15482 (April 5). From here, minor support levels turn up, including 14809 (March 24) and the March low of 14458 (March 20). The key 200-day SMA at 14469 could also play an important role on subsequent critical pullbacks. On the upside, the next notable hurdle is at the all-time top of 16331 (May 19). The RSI on the daily chart climbed past 49.
Best Performers: Airbus Group, Hannover Rueck SE, Sartorius AG VZO
Worst Performers: Zalando SE, Vonovia, Adidas
Resistance levels: 16079 16331 17000? (4H chart)
Support levels: 15629 15482 14809 (4H chart)
NASDAQ
The generalized positive sentiment in the risk complex motivated the tech-reference Nasdaq 100 to quickly leave behind Wednesday’s pullback and retake the upside bias on Thursday.
It was all rosy skies for tech equities after the debt ceiling bill was on its way to be debated (and most likely approved) in the Senate and later signed by President Biden before the X-date on June 5 and the reassessment of a Fed’s pause later in the month, all bolstered by the sell-off in the greenback and further retracement in US yields.
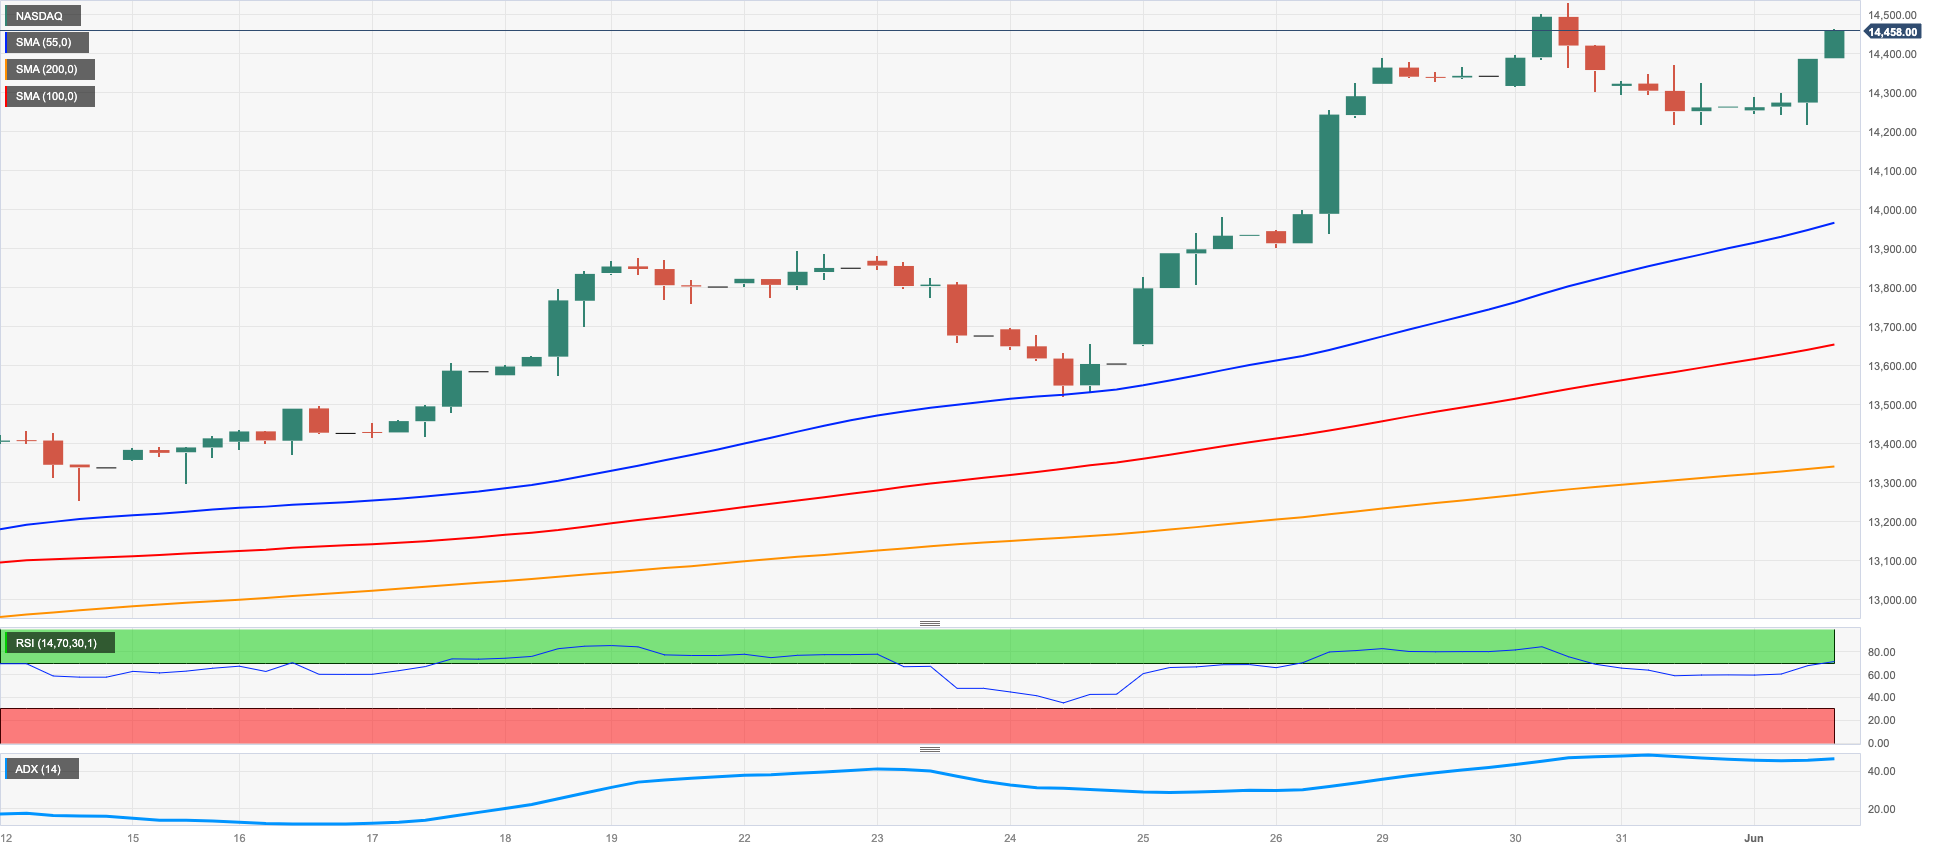
The continuous ascent in the Nasdaq 100 appears to have reached a snag. If it crosses the 2023 high of 14520 (May 30), it might open the door for a further rise into the March 2022 top of 15265 (March 29), prior to the round level of 16000. In case of occasional bearish attempts, the weekly low of 13520 (May 24) should offer initial contention followed by the interim 55-day SMA at 13184 and the May low of 12938 (May 4). This level of support occurs before the April low of 12724 (April 25), the 200-day SMA of 12149, the March low of 11695 (March 13), and the weekly lows of 11550 (January 25) and 11251 (January 19), all ahead of the 2023 bottom at 10696 (January 6). The everyday RSI ticked higher and surpassed the 73 level.
Top Gainers: PDD Holdings DRC, JD.com Inc Adr, Marvell
Top Losers: Lucid Group, Amgen, Dollar Tree
Resistance levels: 14520 15161 15265 (4H chart)
Support levels: 13520 13231 12938 (4H chart)
DOW JONES
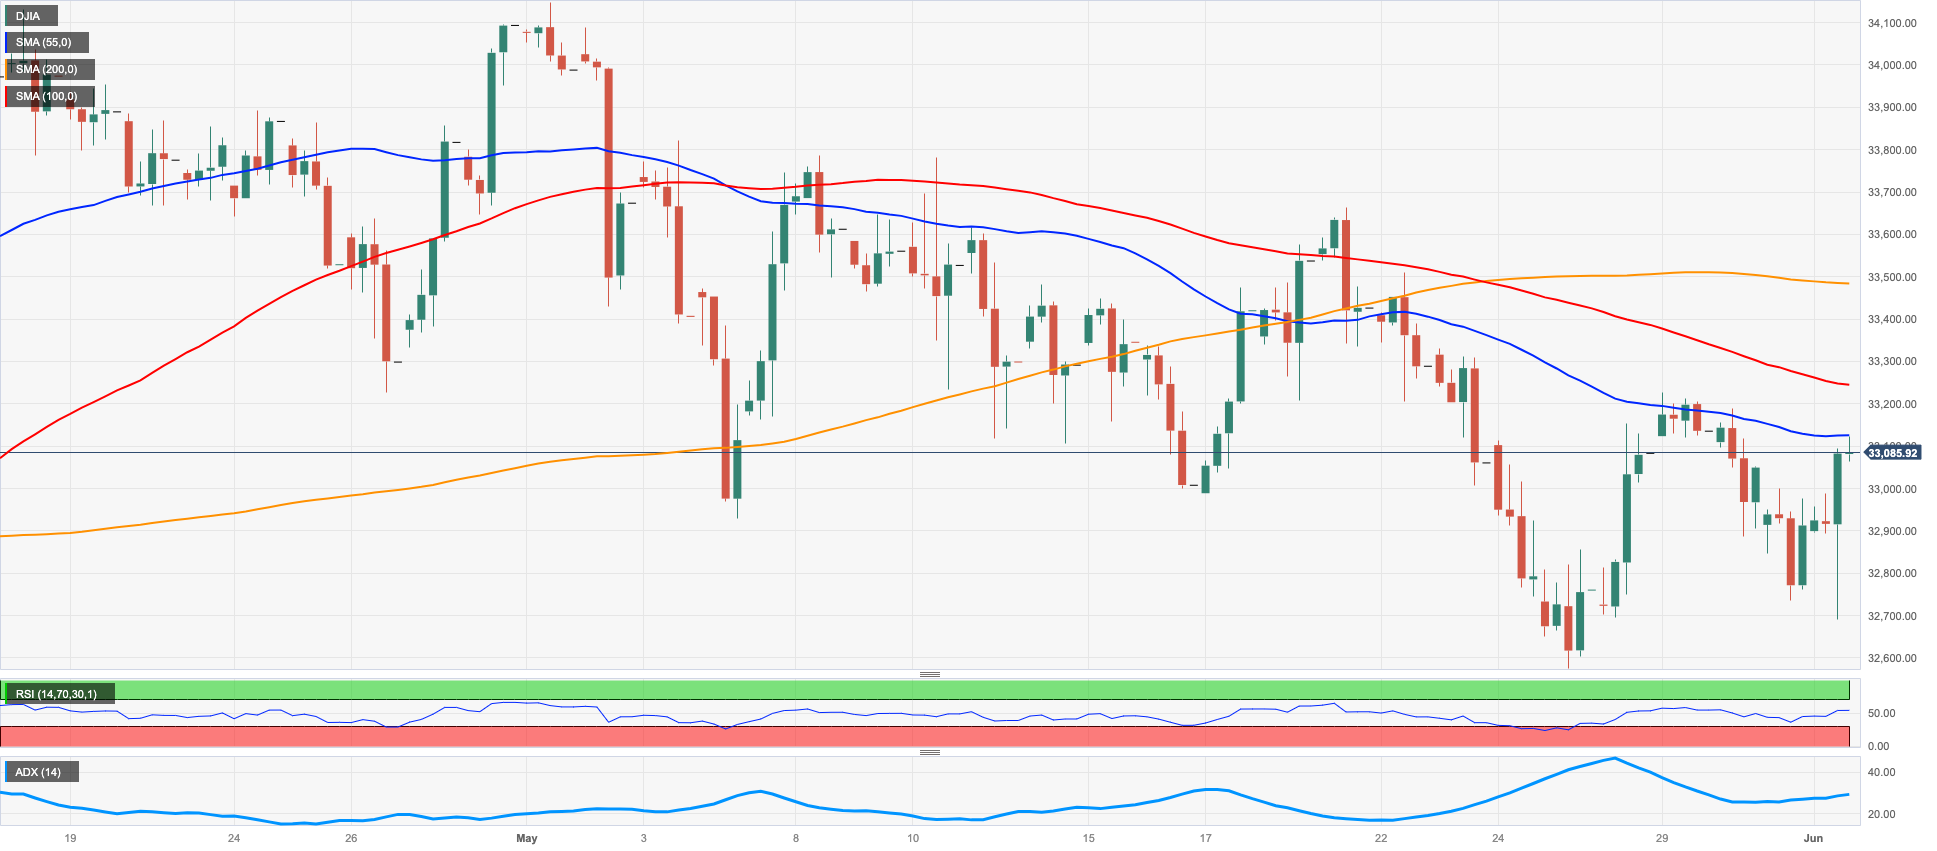
Finally, there was some respite for US stocks measured by the Dow Jones, as the index rose markedly and flirted with 3-day peaks around the 33100 region on Thursday.
Optimism ran high among investors in response to positive news from the US political area, where lawmakers passed the debt ceiling bill late on Wednesday, and rising expectations of an impasse by the Fed at its upcoming monthly gathering.
Further strength for risk-associated assets came in the form of a much weaker dollar and the persevering decline in US yields across the curve.
All in all, the Dow Jones gained 0.56% to 33093, the S&P500 advanced 0.90% to 4218, and the tech-benchmark Nasdaq Composite rose 1.16% to 13085.
Further recovery in the Dow Jones is expected to target transitory hurdles at the 55-day and 100-day SMAs at 33232 and 33335, respectively, ahead of the weekly top of 33652 (May 19). Once the latter is cleared, the index may then encounter resistance at the May high of 34257 (May 1), the 2023 peak of 34342 (January 13), and the December 2022 peak of 34712 (December 13). If the index can rise beyond this level, it might hit the April 2022 top of 35492 (April 21). Conversely, immediate support aligns at the May low of 32586 (May 25) before the 2023 low of 31429 (March 15) and the 2022 low of 28660 (October 13). The day-to-day RSI leapt past 46.
Top Performers: American Express, UnitedHealth, Caterpillar
Worst Performers: Salesforce Inc, Amgen, Goldman Sachs
Resistance levels: 33162 33328 33652 (4H chart)
Support levels: 32586 31805 31429 (4H chart)
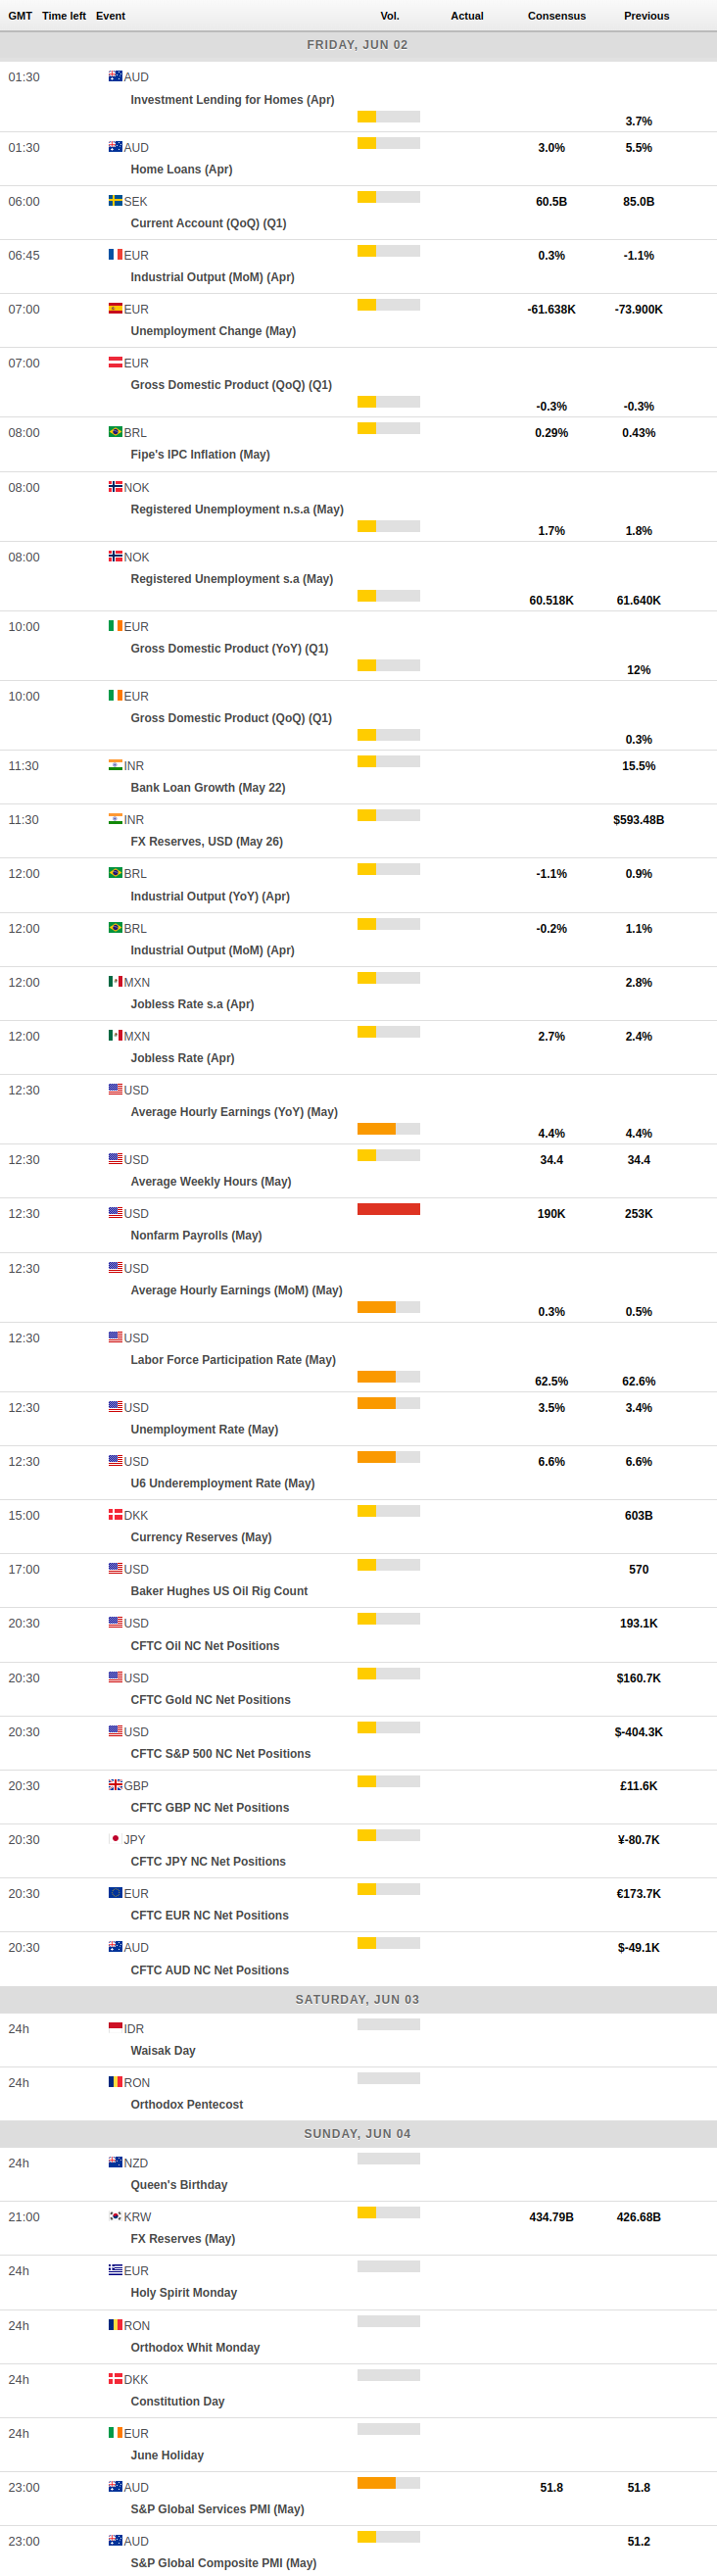
MACROECONOMIC EVENTS
All Information & Updates provided by:

All information relating to the financial markets available on this page has been prepared and issued by FXStreet (Forexstreet SL, Spain, Reg: B62498233) on the basis of publicly available information and all information believed to be reliable and does not conflict with Kuwaiti local laws, and all necessary care has been taken to before the company to ensure that the facts mentioned are correct from the source.
NCM Investment nor any of its directors or employees shall in any way be held responsible for the contents of this news, and the information contained on this page is intended only to provide clients with publicly available information and should not be construed as investment advice, report or analysis and/or constitute an offer or invitation to buy or sell financial instruments of any kind.
RISK WARNING: Forex and CFDs are highly risky leveraged products, as losses can exceed deposits. Please ensure you understand all the risks and take independent advice if necessary. NCM will segregate the clients based on the criteria of the regulator and its bylaws. NCM does not provide any advisory service; the material published does not constitute advice or a recommendation for a transaction in any financial instrument. NCM accepts no responsibility for any use of the content presented and any consequences of that use. Anyone acting on the information provided does so at their own risk.