
- Contact Us:
-

-

-

-


Daily Market Updates
05 Jun 2023
USDJPY
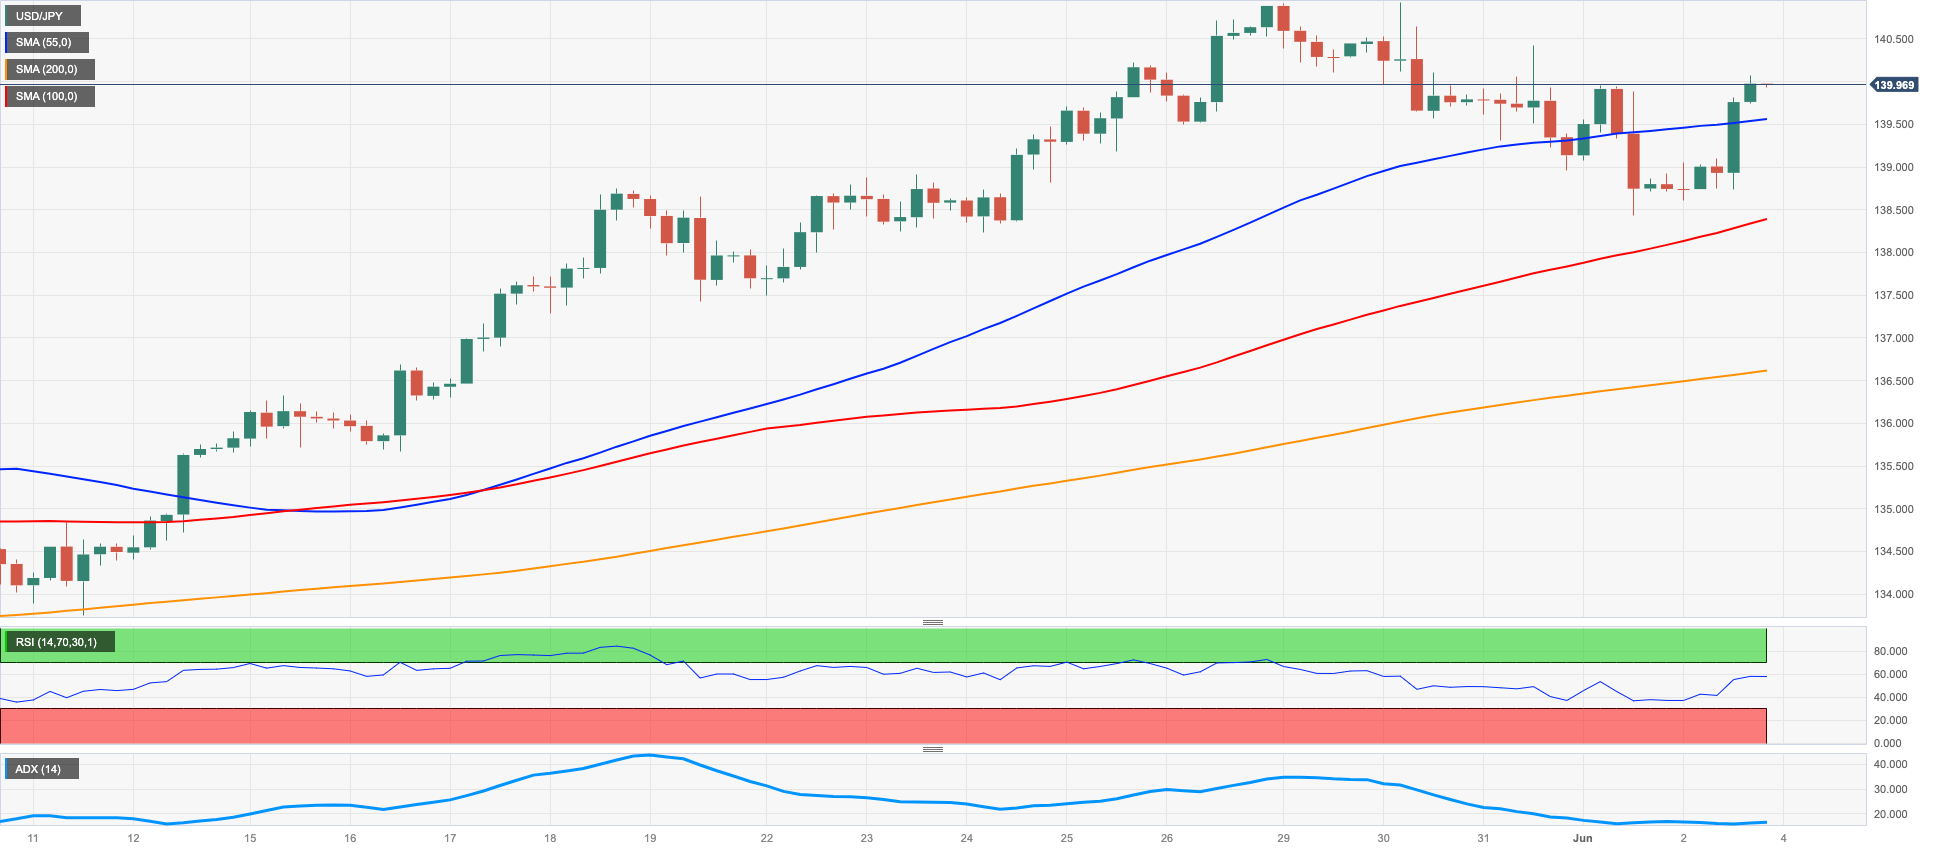
USD/JPY finally saw some relief from its recent weakness and staged a decent rebound north of the key 140.00 the figure on Friday.
In fact, the daily uptick came on the back of the strong NFP-led bounce in the greenback, while extra selling pressure hurt the yen after the US Senate approved the debt ceiling bill on Thursday, which alleviated the demand for the safe haven space.
Also propping up the pair’s strong daily advance, US yields rebounded markedly vs. the broad-based lack of traction of the JGB 10-year reference yields, which extended their consolidative mood above 0.40%.
There were no data releases or events in the Land of the Rising Sun.
In case USD/JPY clears the weekly low at 138.42 (June 1) it should then face the next support at the key 200-day SMA of 137.27 before hitting the temporary 55-day and 100-day SMAs of 134.91 and 133.92, respectively. If the pair continues to fall, it may retest the weekly low of 133.01 (April 26), minor support at 132.01 (April 13), and the April low of 130.62. (April 5). The March low of 129.63 (March 24) and the February low of 128.08 (February 8) may become prominent in the event of a greater retracement. On the upside, the next significant objective is the 2023 high of 140.91 (May 29), followed by weekly highs of 142.25 (November 21, 2022) and 148.84 (October 31, 2022). The daily RSI improved sharply and rose above 64.
Resistance levels: 140.07 140.41 140.93 (4H chart)
Support levels: 138.42 138.24 137.42 (4H chart)
GBPUSD
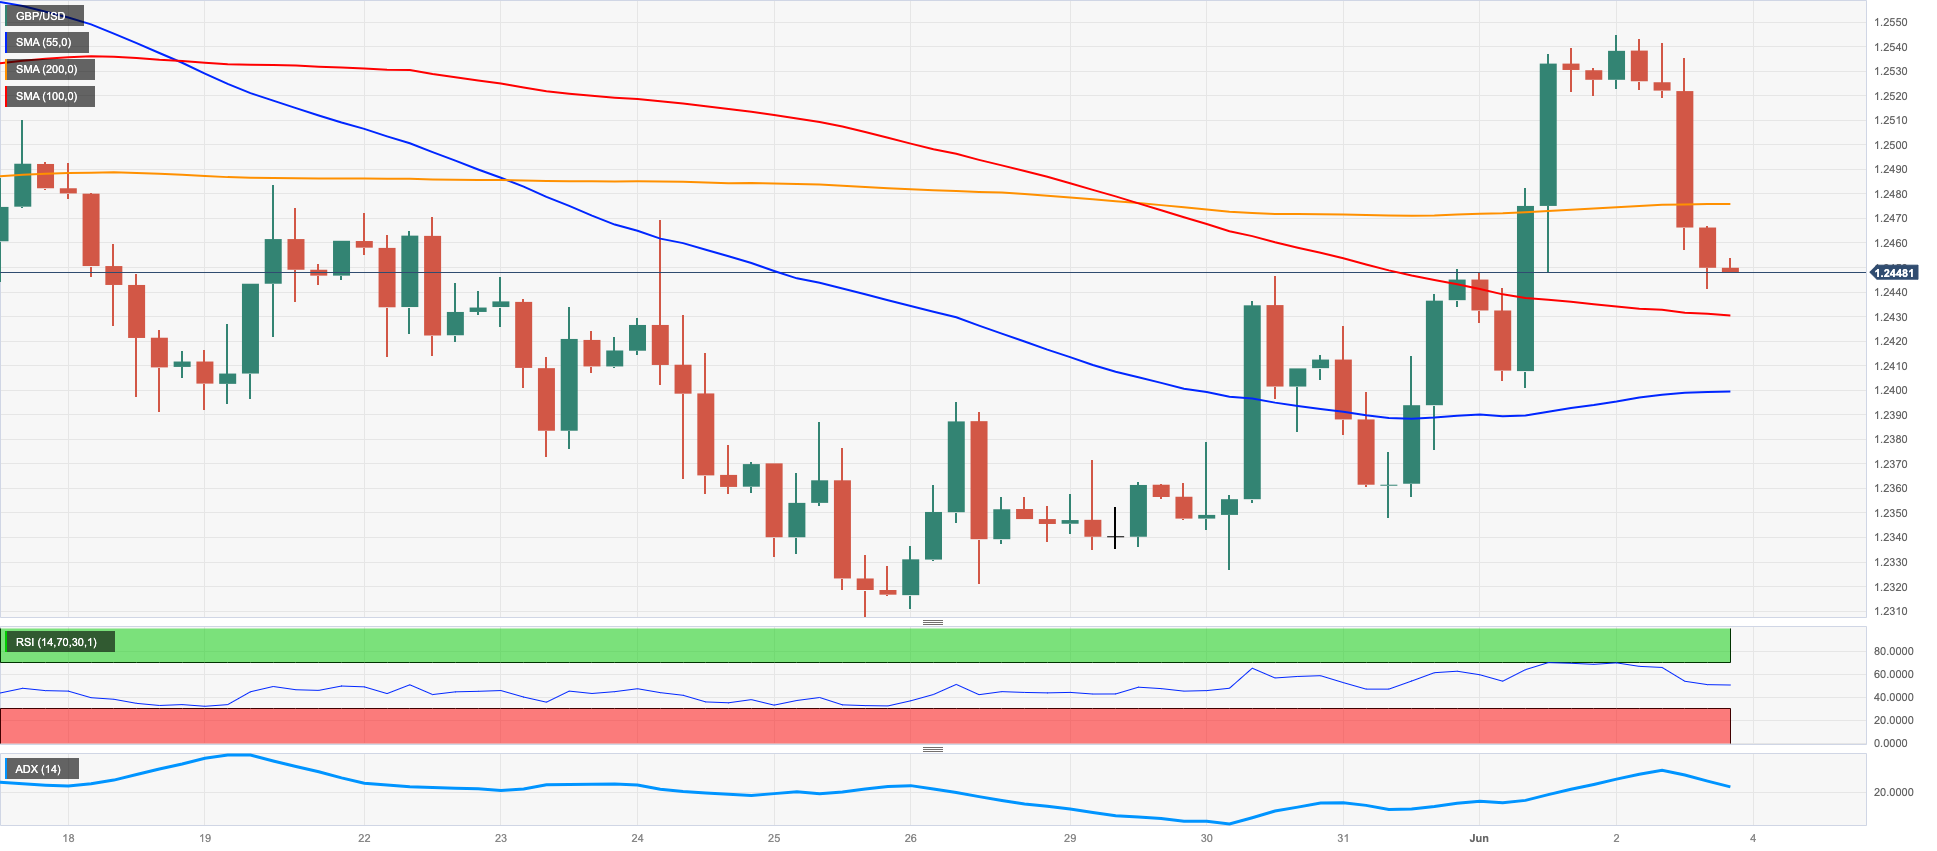
GBP/USD moved further up and flirted with the 1.2550 region, or 2-week tops, before coming all the way down to the mid-1.2400s in response to the abrupt change of course in the US dollar on Friday.
Indeed, the upside pressure in the buck gained extra impulse in the wake of the release of May’s Nonfarm Payrolls (+339K), encouraging the USD Index (DXY) to return to the 104.00 region after bottoming out near 103.40 earlier in the session.
In the meantime, speculation of extra tightening by the BoE in the next few months has also contributed to the strong rebound in the pair from last week’s lows in the 1.2300 neighbourhood. It is worth noting that investors now see a potential peak of the BoE’s hiking cycle at 5.50%.
The UK docket was empty on Friday.
GBP/USD may possibly revisit the 2023 top of 1.2679 (May 10) before reaching the 200-week SMA at 1.2865 and the psychological milestone of 1.3000. On the contrary, Cable's immediate downside objective is the May low of 1.2308 (May 25), followed by the temporary 100-day SMA at 1.2299 and the April low of 1.2274 (April 3). If the pair continues to fall, it might target the 200-day SMA at 1.1992, which is placed ahead of the 2023 low of 1.1802 (March 8). The daily RSI below the 51 mark.
Resistance levels: 1.2544 1.2679 1.2772 (4H chart)
Support levels: 1.2441 1.2400 1.2347 (4H chart)
AUDUSD
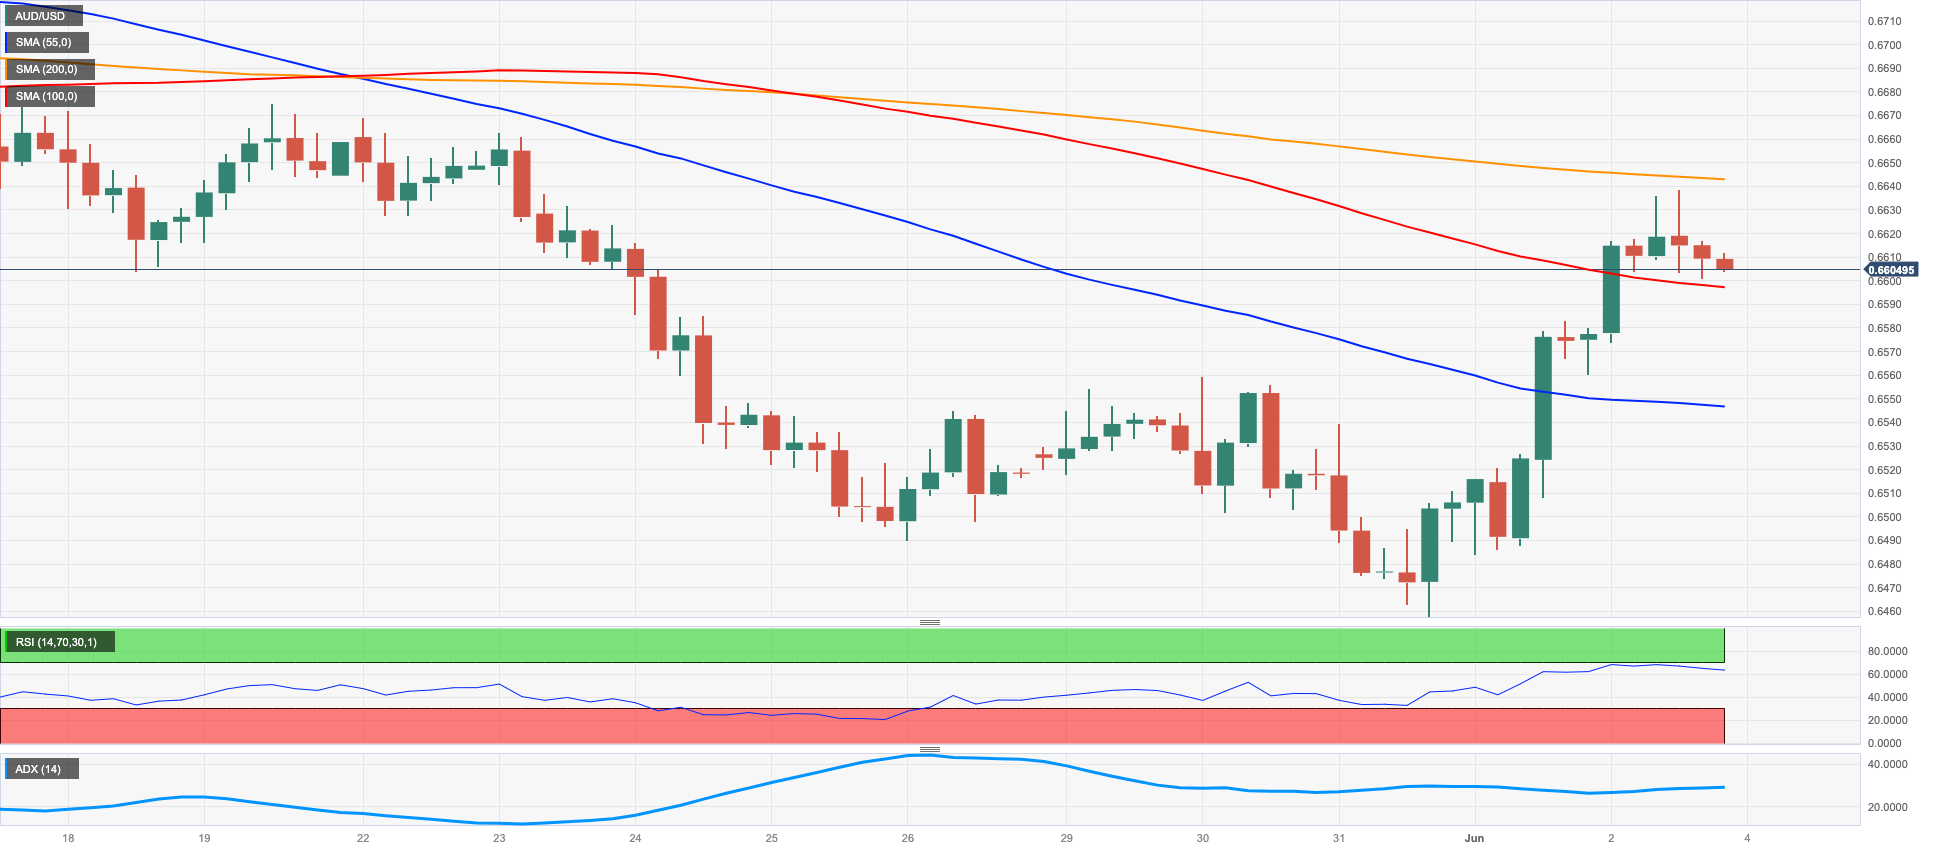
The Aussie dollar saw its upside accelerate markedly, which motivated AUD/USD to reclaim the 0.6600 barrier and beyond on Friday.
Spot clinched new multi-session highs despite the strong rebound in the greenback, particularly exacerbated following the firmer-than-expected Payrolls in May, which somehow managed to mitigate the bout of weakness sparked by comments from Fed’s Harker and Jefferson on Wednesday.
In addition, another positive session in the commodity complex underpinned further the upbeat sentiment around AUD, with both copper prices and iron ore extending the recent bounce.
Meanwhile, in Australia, Home Loans contracted at a monthly 3.8% in April and Investment Lending for Homes dropped 0.9% in the same period.
If the recovery picks up pace, then AUD/USD should revisit the interim 55-day SMA at 0.6664 ahead of the more relevant 200-day SMAs at 0.669. Further north emerges the May high of 0.6818 (May 10) prior to the psychological mark of 0.7000 seconded by the weekly top of 0.7029 (Feb 14) and the 2023 peak of 0.7157 (Feb 2). By contrast, if the pair drops below the 2023 low of 0.6458 (May 31), it could accelerate losses to the weekly low at 0.6386 (November 10) before the November 2022 low of 0.6272 (November 3). The everyday RSI leapt to the boundaries of the 49 yardstick.
Resistance levels: 0.6638 0.6675 0.6709 (4H chart)
Support levels: 0.6550 0.6458 0.6386 (4H chart)
GOLD
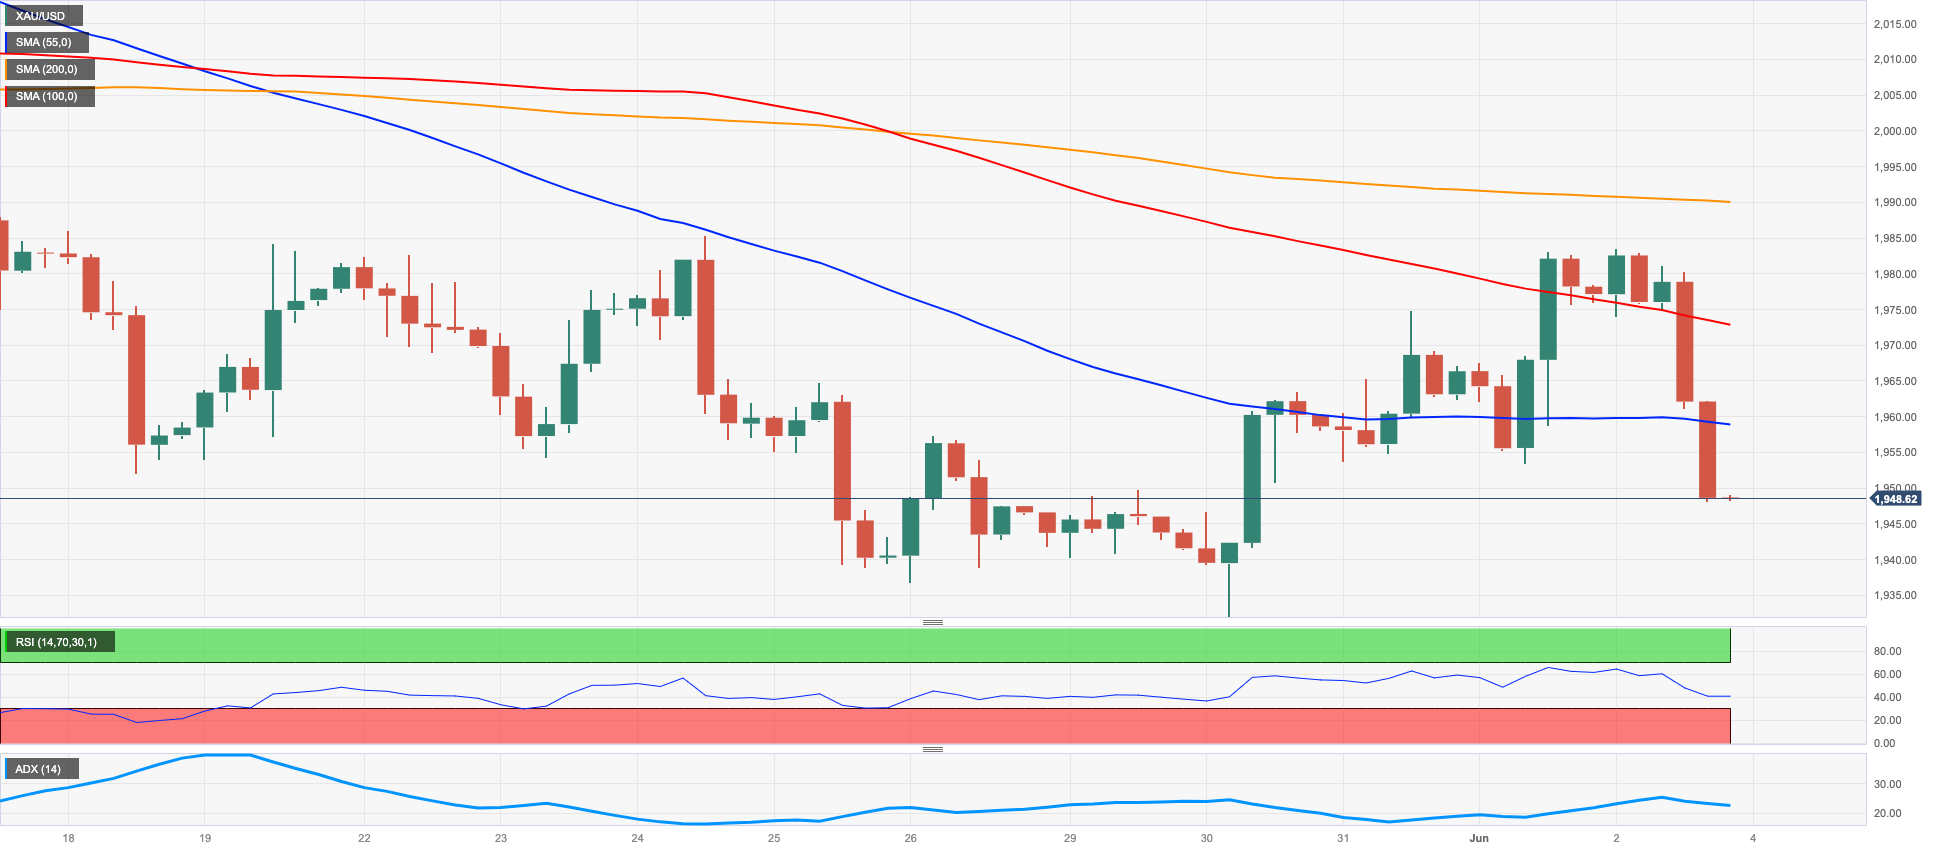
Prices of gold saw their 2-day recovery suddenly halted on Friday. Indeed, the yellow metal faltered once again above the $1980 mark per ounce troy and triggered a corrective move to the vicinity of $1950 at the end of Friday’s session.
The daily pullback in the precious metal came in response to the sharp bounce in the greenback, helped by the equally solid rebound in US yields across the curve, which saw their recent strong weakness somewhat alleviated after US Nonfarm Payrolls surprised to the upside in May.
Moving forward, bullion is expected to keep monitoring expectations around the Fed’s interest rate decision later in the month, with consensus now favouring a pause in the current normalization of monetary conditions.
Gold's upward momentum now appears somewhat dented. However, it faces initial resistance at the 55-day SMA around $1990 before potentially reaching the significant milestone of $2000. Notably, there are no prominent levels of resistance until it reaches the 2023 top at $2067 (May 4) ahead of the 2022 peak of $2070 (March 8) and the all-time high of $2075 (August 7, 2020). On the other hand, there is initial support at the May low of $1932 (May 30), which appears reinforced by the proximity of the interim 100-day SMA. Further decline could see the 200-day SMA at $1835 revisited well before reaching the 2023 low of $1804 (February 28).
Resistance levels: $1983 $1990 $2022 (4H chart)
Support levels: $1948 $1932 $1885 (4H chart)
CRUDE WTI
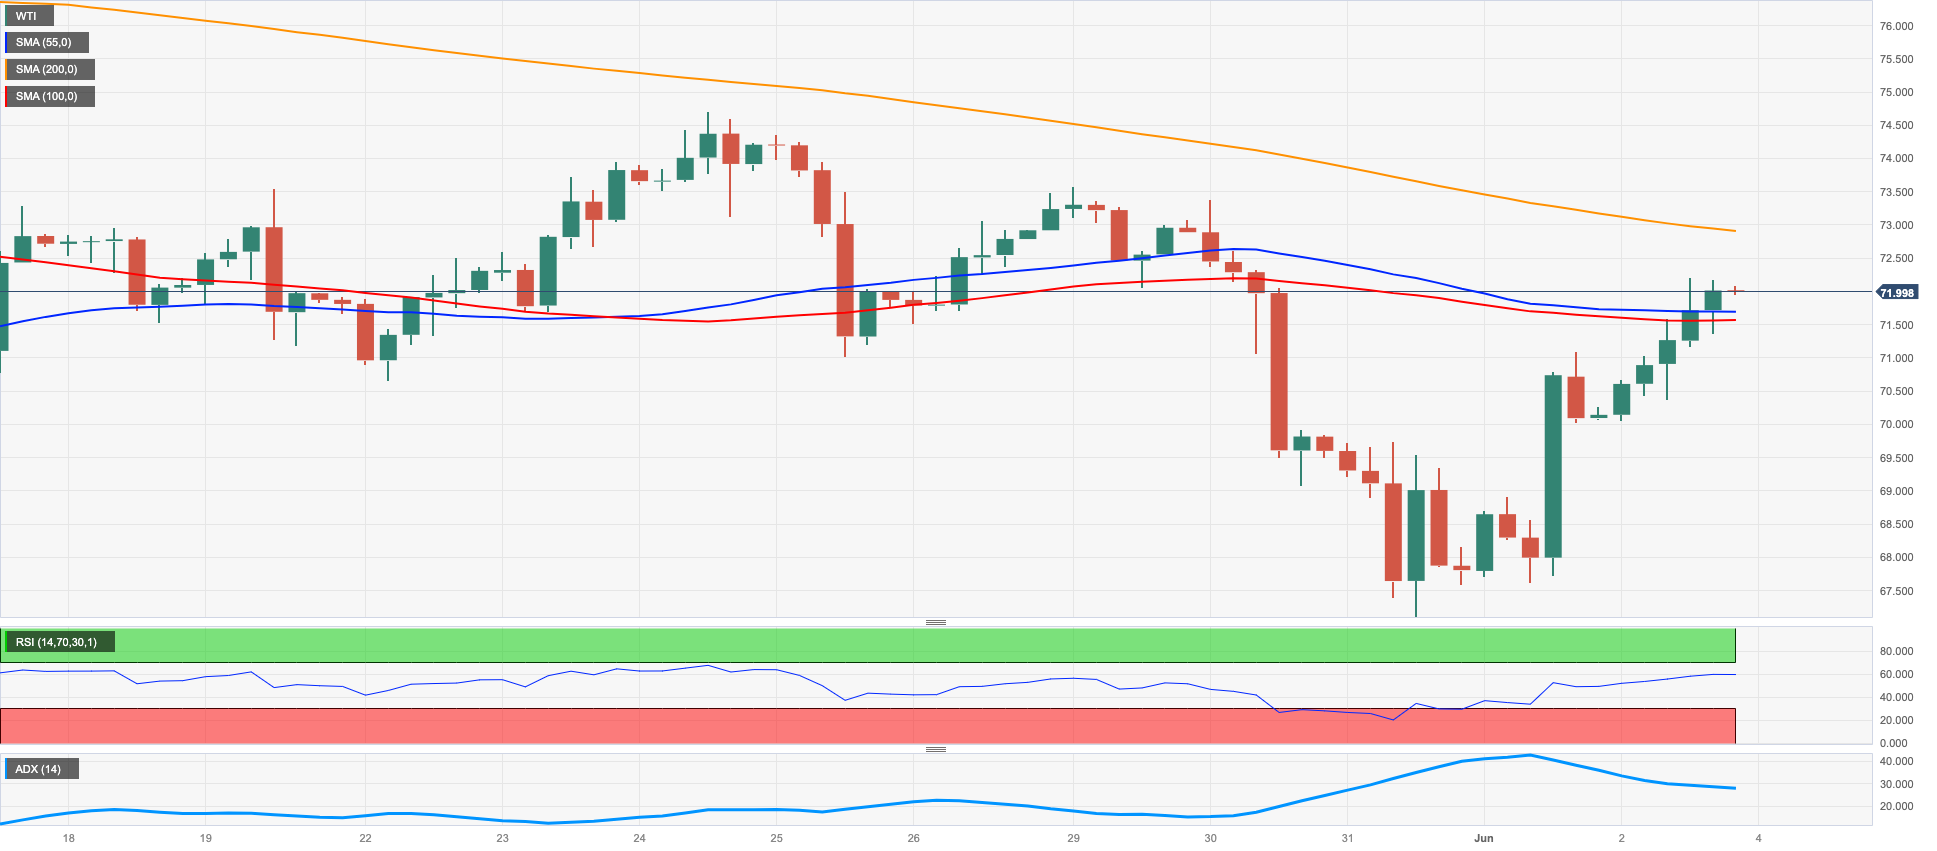
WTI prices rose for the second session in a row, regaining ground lost in the first part of the week and briefly exceeding the critical $72.00 per barrel threshold on Friday.
Further optimism among traders resurfaced after the US Senate passed the debt ceiling bill late on Thursday, which now waits for President Biden’s firm to avert a historical default.
In addition, expectations of the Fed’s pause in its hiking cycle at its upcoming meeting on June 14 also supported the positive performance of the commodity in the second half of the week.
Extra support for crude oil came from rising expectations that OPEC+ could announce another reduction in oil output at its meeting on June 4.
Closing the weekly docket for crude oil, the US oil rig count tracked by driller Baker Hughes dropped by 15 in the week to June 2 to 555 total active oil rigs.
Despite the strong bounce in the last couple of sessions, WTI closed the week with modest losses. That said, the weekly low of $67.08 (May 31) turns up as the immediate contention ahead of the 2023 low of $63.61 (May 4). This level is supported further by the December 2021 low of $62.46 (December 2) prior to the critical $60.00 per barrel threshold. On the other side, the initial hurdle comes at the temporary 55-day SMA of $74.09 before the weekly high of $74.69 (May 24) and the transitory 100-day SMA of $75.66. Further north appears the weekly peak at $79.14 (April 24) and the crucial 200-day SMA at $79.39, just ahead of the significant $80.00 zone. If the comeback continues, the next goals are the 2023 high of $83.49 (April 12) and the November 2022 high of $93.73 (November 7).
Resistance levels: $72.14 $73.51 $74.69 (4H chart)
Support levels: $67.08 $63.61 $62.42 (4H chart)
GER40
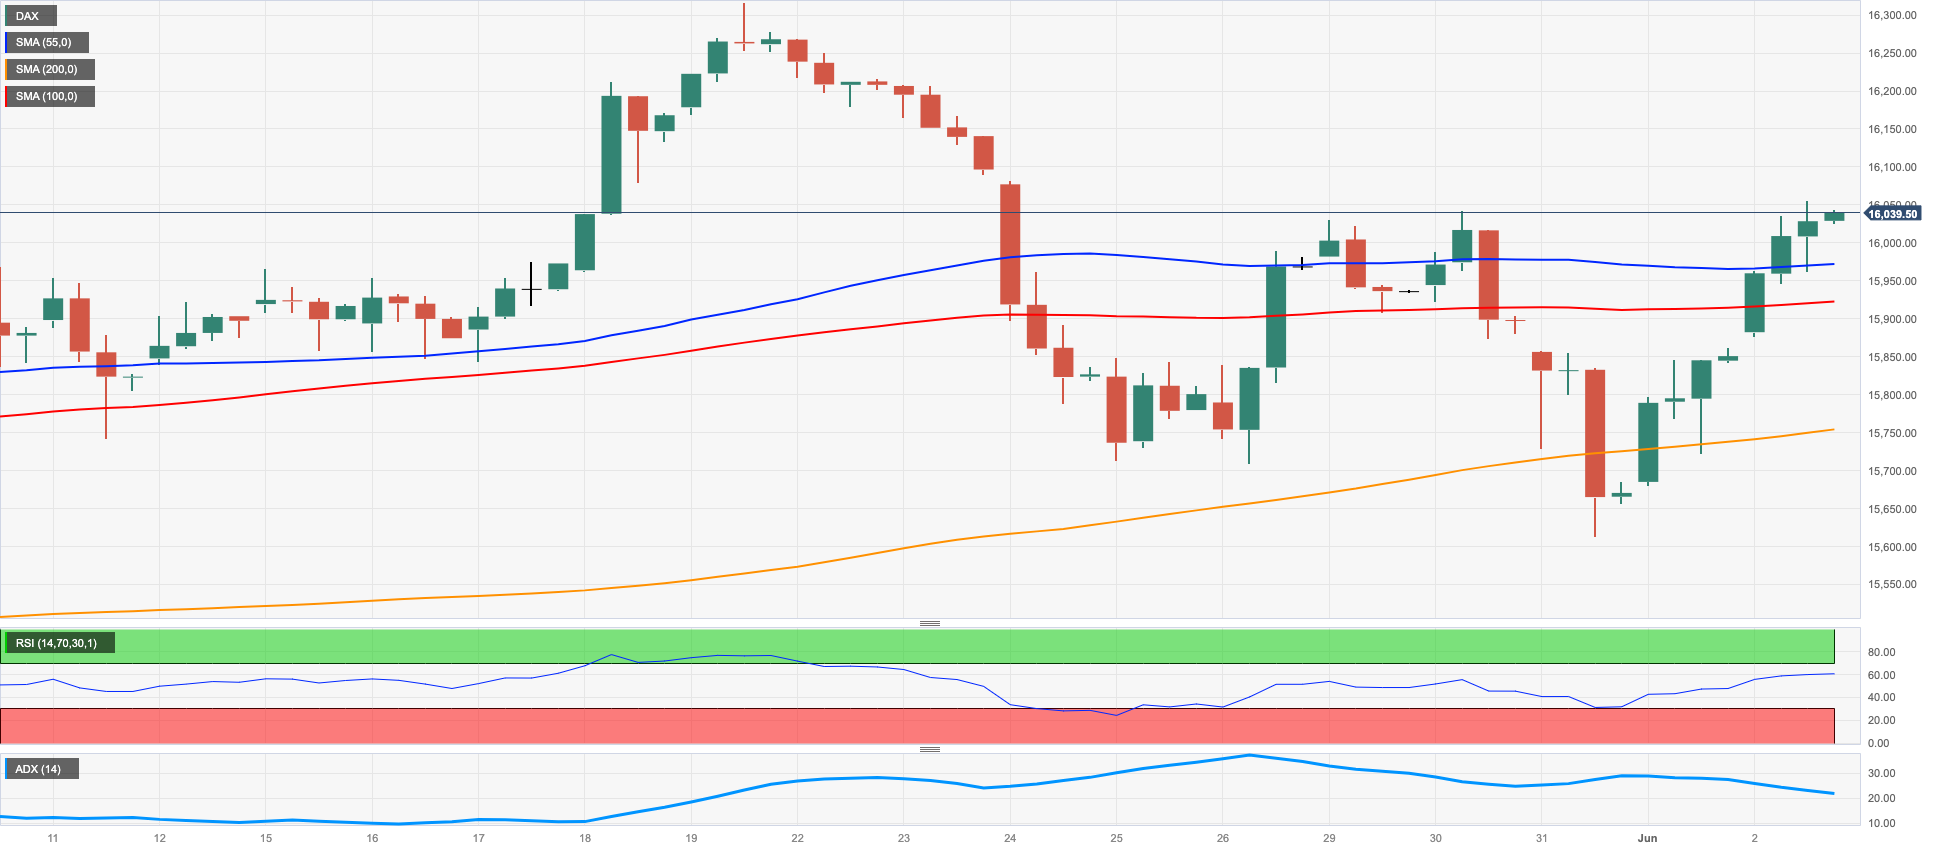
Another auspicious session in the European markets saw Germany’s reference DAX40 clinch its second advance in a row, this time flirting with multi-day highs past the key 16000 barrier on Friday.
The generalized upbeat mood in stocks was reinforced after the US Senate passed the US debt ceiling bill late on Thursday, while extra oxygen came after the release of the US jobs report, which showed another solid job creation, although inflation wage components cooled down further during May, giving the Fed sufficient (?) leeway to pause its hiking cycle later in the month.
In the German debt market, the 10-year bund yields reversed five consecutive sessions of losses, in line with the performance of their US peers.
Further upside in the DAX40 is expected to challenge the all-time high of 16331 (May 19). Contrarily, there is an immediate support at the transitory 55-day SMA at 15688, which precedes the May low of 15629 (May 31) and comes ahead of the interim 100-day SMA at 15516. This was followed closely by the April low of 15482 (April 5) before the minor support at 14809 (March 24) and the March low of 14458 (March 20), which looks propped up by the key 200-day SMA. The daily RSI rebounded beyond the 55 barrier.
Best Performers: Covestro, Adidas, Continental AG
Worst Performers: Deutsche Telekom, Hannover Rueck SE, E.ON SE
Resistance levels: 16079 16331 17000? (4H chart)
Support levels: 15909 15629 15482 (4H chart)
NASDAQ
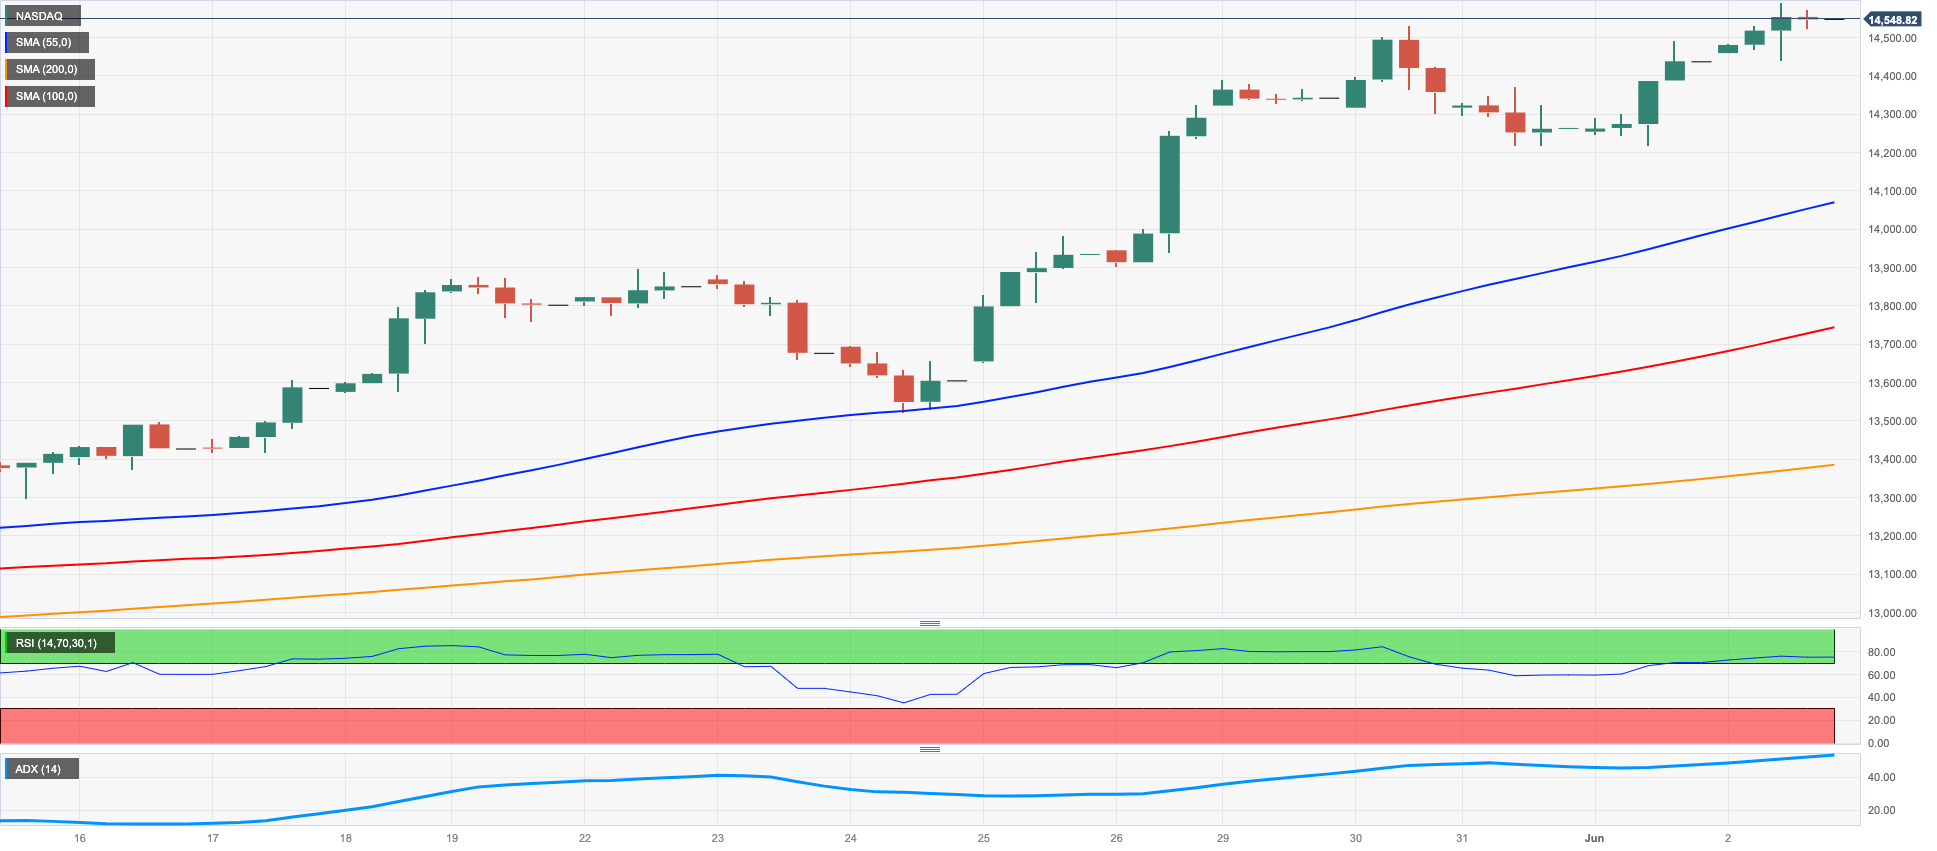
The rally in the US tech sector remained everything but alleviated for yet another session on Friday. Indeed, stocks measured by the Nasdaq 100 reached levels last seen back in April 2022 around the 14600 region on the back of the marked improvement in the US political scenario after the US Senate passed the Biden-McCarthy debt ceiling proposal on Thursday.
In addition, speculation that the Fed might skip a rate hike in June continued to run high and underpinned further the upside bias in the rate-sensitive index, which closed with gains in the last six weeks.
If the Nasdaq 100 breaks over the 2023 high of 14595 (June 2), it might pave the way for a further surge into the March 2022 top of 15265 (March 29), before the round level of 16000. In the event of a bearish effort, the weekly low of 13520 (May 24) should be the first line of defense, followed by the intermediate 55-day SMA at 13226 and the May low of 12938. (May 4). This level of support comes before to the April low of 12724 (April 25), the 200-day SMA of 12153, the March low of 11695 (March 13), and the weekly lows of 11550 (January 25) and 11251 (January 19), all of which occur prior to the 2023 bottom at 10696 (January 6). The daily RSI remained well in the overbought territory beyond the 75 yardstick.
Top Gainers: Lululemon Athletica, Zscaler, Airbnb
Top Losers: T-Mobile US, Crowdstrike Holdings, Sirius XM
Resistance levels: 14595 15161 15265 (4H chart)
Support levels: 14219 13520 12938 (4H chart)
DOW JONES
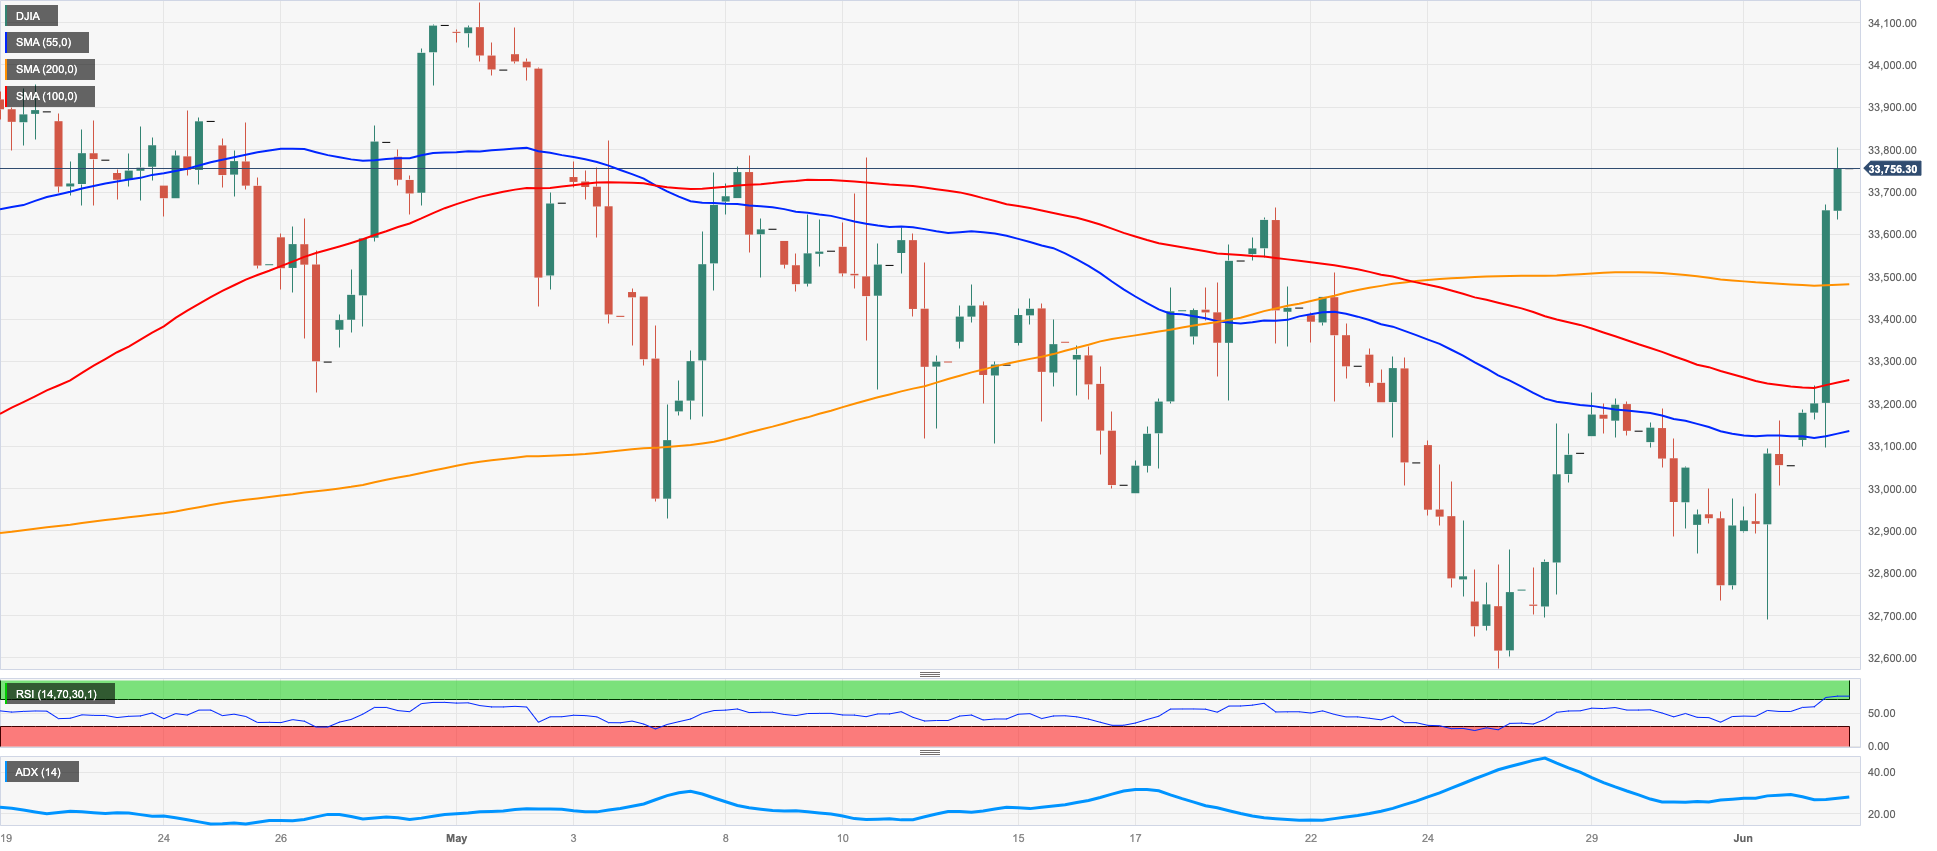
Equities tracked by the Dow Jones rose markedly and clocked new 4-week highs past the 33800 level at the end of the week, adding to Thursday’s decent gains at the same time.
Stocks navigated in a context of rising optimism after the federal government averted a default following the Senate’s approval of the debt ceiling bill late on Thursday. The so-called Fiscal Responsibility Act of 2023 is now ready to be signed by President Biden before X-date (June 5).
Also boosting the upside bias emerged further cracks in the US labour market after a measure of wage inflation (Average Hourly Earnings) slowed the pace in May despite the strong job creation (+339K jobs).
Maybe something markets could start mulling over is: In an interview late on Friday, former Treasury Secretary Lawrence Summers believes the Fed should be willing to raise interest rates by a half percentage point in July if it decides not to tighten lending this month.
On the whole, the Dow Jones rose 2.13% to 33764, the S&P500 gained 1.48% to 4283, and the tech-heavy Nasdaq Composite advanced 1.07% to 13240.
In light of the recent strong advance, the Dow Jones is expected to focus on the May high of 34257 (May 1) followed by the 2023 top of 34342 ( January 13) and the December 2022 peak of 34712 (December 13). If the index manages to surpass the latter, it may reach the April 2022 high of 35492 (April 21). Just the opposite, immediate support is found at the May low of 32586 (May 25) prior to the 2023 low of 31429 (March 15), and the 2022 low of 28660 (October 13). The day-to-day RSI jumped past the 48 mark.
Top Performers: 3M, Caterpillar, Dow
Worst Performers: Verizon, Salesforce Inc, Apple
Resistance levels: 33805 34257 34712 (4H chart)
Support levels: 32586 31805 31429 (4H chart)
MACROECONOMIC EVENTS

All Information & Updates provided by:

All information relating to the financial markets available on this page has been prepared and issued by FXStreet (Forexstreet SL, Spain, Reg: B62498233) on the basis of publicly available information and all information believed to be reliable and does not conflict with Kuwaiti local laws, and all necessary care has been taken to before the company to ensure that the facts mentioned are correct from the source.
NCM Investment nor any of its directors or employees shall in any way be held responsible for the contents of this news, and the information contained on this page is intended only to provide clients with publicly available information and should not be construed as investment advice, report or analysis and/or constitute an offer or invitation to buy or sell financial instruments of any kind.
RISK WARNING: Forex and CFDs are highly risky leveraged products, as losses can exceed deposits. Please ensure you understand all the risks and take independent advice if necessary. NCM will segregate the clients based on the criteria of the regulator and its bylaws. NCM does not provide any advisory service; the material published does not constitute advice or a recommendation for a transaction in any financial instrument. NCM accepts no responsibility for any use of the content presented and any consequences of that use. Anyone acting on the information provided does so at their own risk.