
- Contact Us:
-

-

-

-


Daily Market Updates
07 Jun 2023
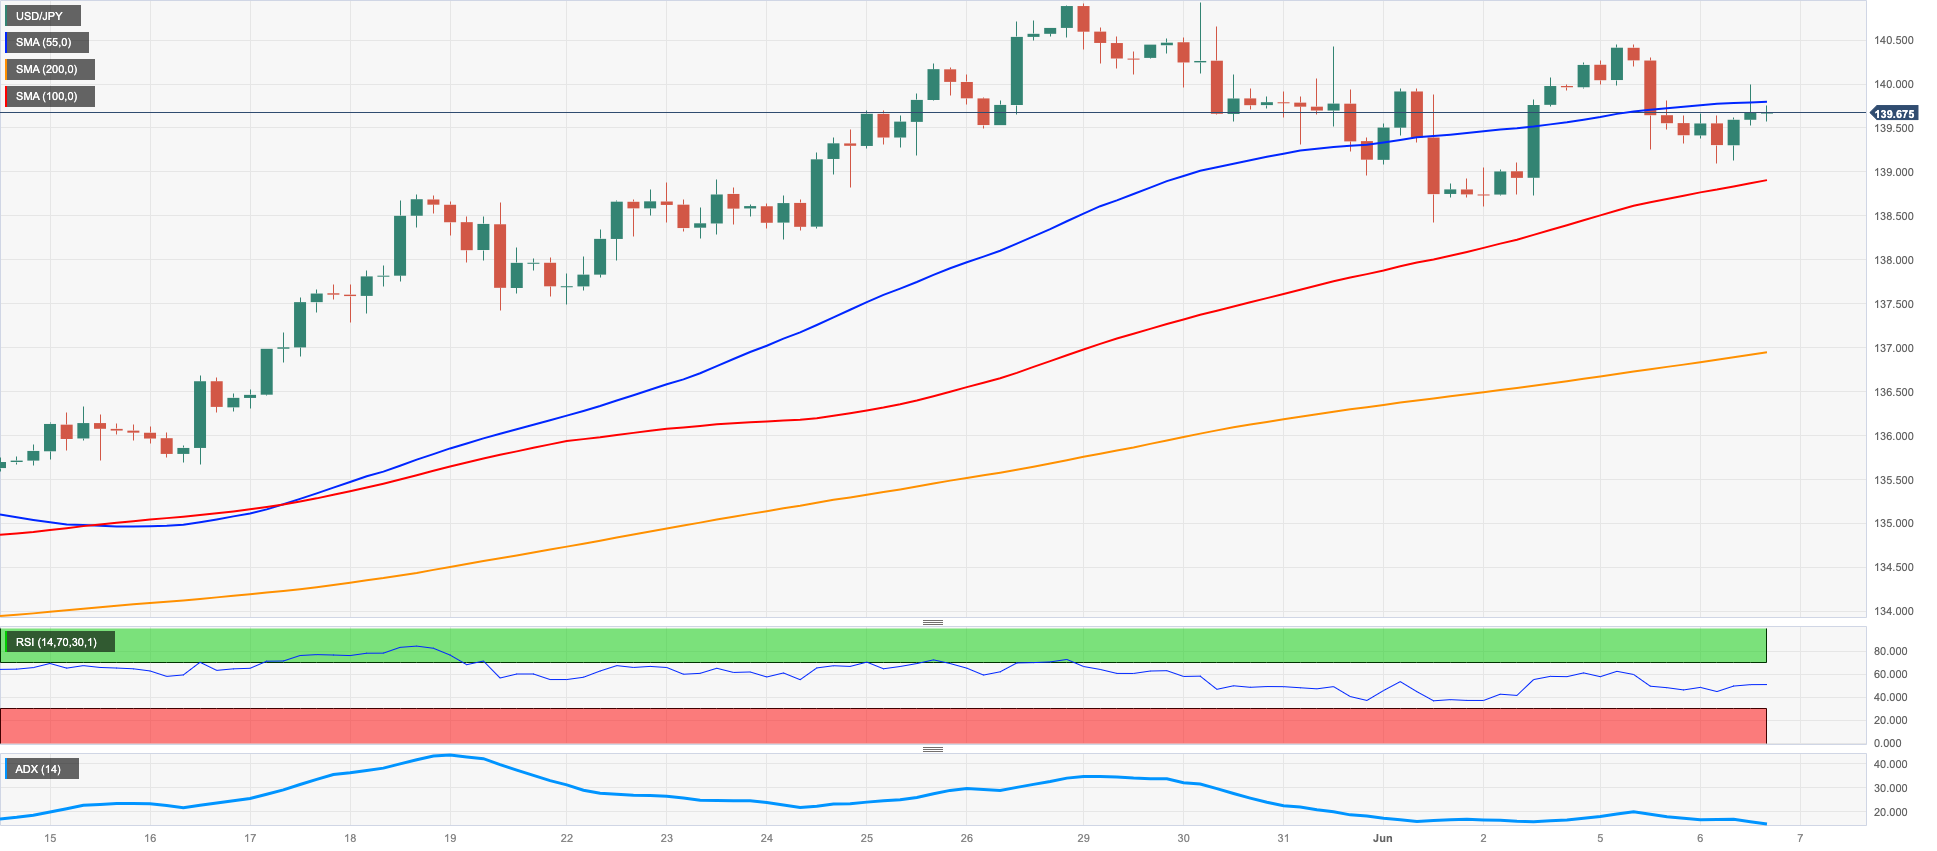
USDJPY
USD/JPY regained the smile and left behind Monday’s pullback, advancing to the boundaries of the 140.00 hurdle amidst the recovery in the greenback and higher US yields across the curve.
Indeed, the knee-jerk in the risk complex helped the dollar’s bounce, which at the same time met extra wings in the upside bias in US yields.
In the Japanese money market, the JGBP 10-year yields prolonged the sidelined performance just above the 0.40% level.
In the Japanese calendar, Household Spending contracted at an annualized 4.4% in April.
If USD/JPY manages to break below the June low of 138.42 (recorded on June 1), the next support level would be at the crucial 200-day SMA of 137.28. Should it continue to decline, the pair would then encounter the transitory 55-day and 100-day SMAs at 135.22 and 134.16 respectively. Any further downward movement could lead to a retest of the weekly low of 133.01 (recorded on April 26), with minor support levels at 132.01 (recorded on April 13) and the April low of 130.62 (April 5). In the event of a more significant retracement, the March low of 129.63 (recorded on March 24) and the February low of 128.08 (recorded on February 8) could become prominent support levels. By contrast, the next significant objective is the 2023 high of 140.91 (recorded on May 29), followed by the weekly tops of 142.25 (recorded on November 21, 2022) and 148.84 (recorded on October 31, 2022). The everyday RSI rose further and flirted with 62.
Resistance levels: 140.45 140.93 141.1 (4H chart)
Support levels: 139.09 138.42 138.24 (4H chart)
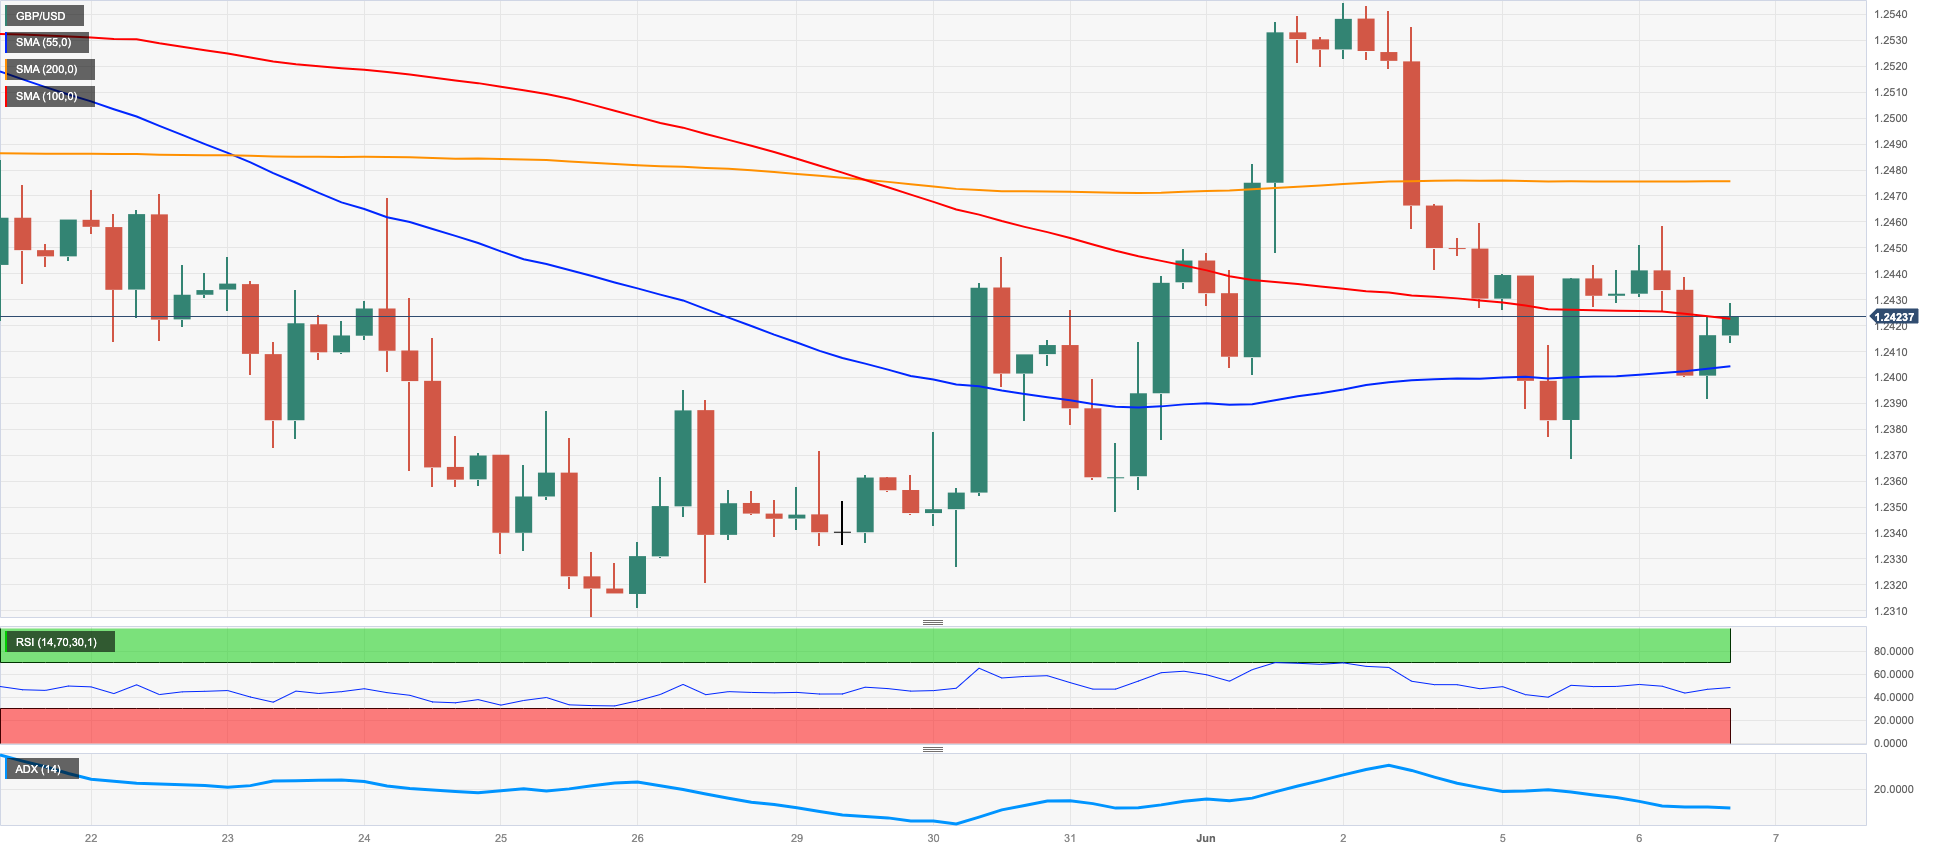
GBPUSD
GBP/USD accelerated its decline and tested once again the sub-1.2400 region on Tuesday, falling for the third session in a row.
Increasing US yields across the curve and the re-emergence of risk-off sentiment have underpinned the persistent bid bias in the greenback. This has depressed the price action around the risk complex and weighed further on the British pound.
In the UK, the BRC Retail Sales Monitor expanded 3.7% in the year to May, and the S&P Global Construction PMI rose a tad to 51.6 during the last month.
GBP/USD is currently facing a significant resistance level at 1.2544, which is the June high recorded on June 2. This level is a crucial barrier that needs to be breached before the pair can reach its 2023 top of 1.2679, which was recorded on May 10. Beyond that lies the 200-week SMA of 1.2865, and eventually the psychological level of 1.3000. On the downside, the immediate target is the May low of 1.2308, which was recorded on May 25. This level is reinforced by the temporary 100-day SMA at 1.2302, and it comes before the April low of 1.2274, which was recorded on April 3. If spot continues its downward trajectory, the next significant support level is the 200-day SMA at 1.1999, which is just above the 2023 bottom of 1.1802 recorded on March 8. The daily RSI grinded lower to the proximity of 48.
Resistance levels: 1.2458 1.2544 1.2679 (4H chart)
Support levels: 1.2368 1.2347 1.2308 (4H chart)
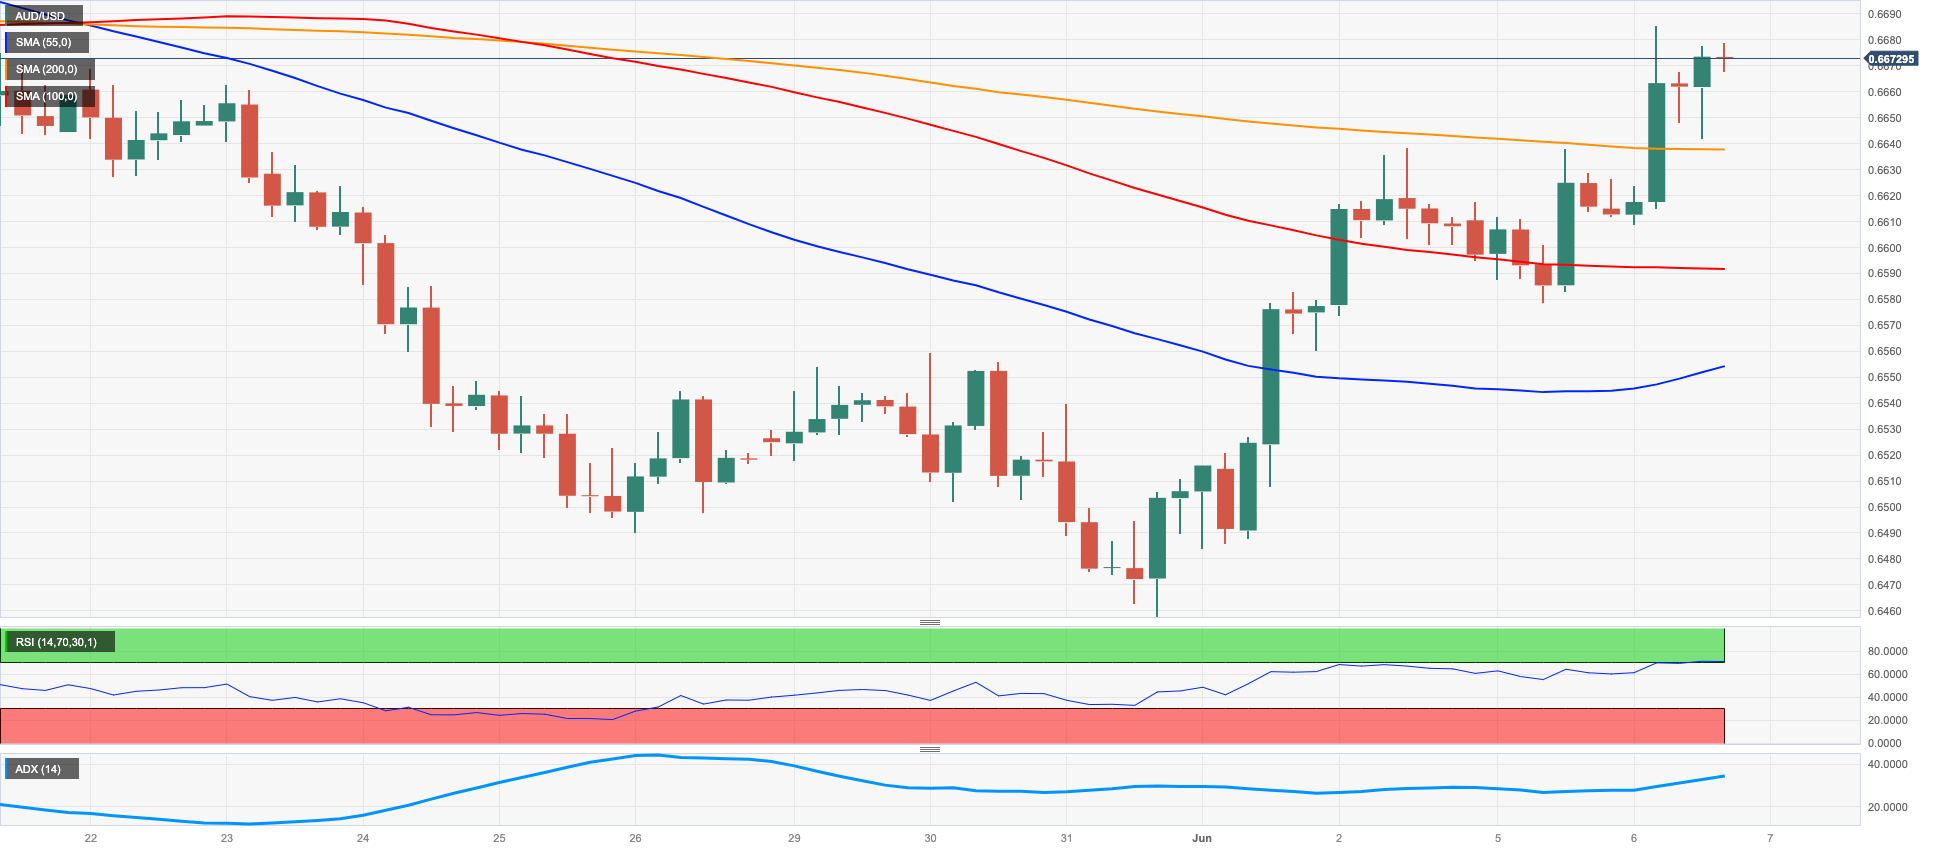
AUDUSD
AUD/USD rose for the fourth straight session and flirted with the key 200-day SMA near the 0.6700 barrier before giving away some gains on Tuesday.
Indeed, the Aussie dollar found another reason to extend further its recent recovery in the somewhat hawkish tone from the RBA after it raise the OCR by 25 bps to 4.10% at its meeting earlier on Tuesday.
On another direction, the rebound in the greenback and the mixed performance of the commodity universe seem to have limited the upside potential in the pair on Tuesday.
Back to the RBA, the bank reiterated its pledge to bring inflation back to the target and left the door open to further tightening, which remains dependent on the progress of inflation and the economy. The RBA also noted that the labour market remains extremely tight despite conditions appear to have softened somewhat as of late. The bank acknowledged that it is aware of the possibility that persistently high inflation expectations could lead to even higher increases in both prices and wages, especially considering the current state of the economy, which has limited spare capacity, and the fact that the unemployment rate is still very low. The board remains vigilant and cautious about this potential risk.
In the wake of the RBA rate decision, Treasurer Chalmers noted that the interest rate raise reflects the more persevering inflation pressures, at the time when he expected the economy to avoid recession.
In the docket, and other than the RBA event, Australia’s Current Account widened to A$12.3B in Q1 and final figures showed Building Permits contracted 8.1% MoM in April and 24.1% YoY, while Private House Approvals shrank at a monthly 3.8% in the same month.
If the recovery continues, AUD/USD should challenge the key 200-day SMA at 0.6691 just before the temporary 100-day SMA at 0.6746. Further north, the May high of 0.6818 (May 10) emerges ahead of the psychological threshold of 0.7000, which is followed by the weekly high of 0.7029 (February 14) and the 2023 peak of 0.7157 (February 2). On the flip side, if the pair goes below the 2023 low of 0.6458 (May 31), losses might reach the weekly low of 0.6386 (November 10) before falling to the November 2022 low of 0.6272 (November 3). The daily RSI edged higher to the proximity of 56.
Resistance levels: 0.6685 0.6709 0.6818 (4H chart)
Support levels: 0.6579 0.6551 0.6458 (4H chart)
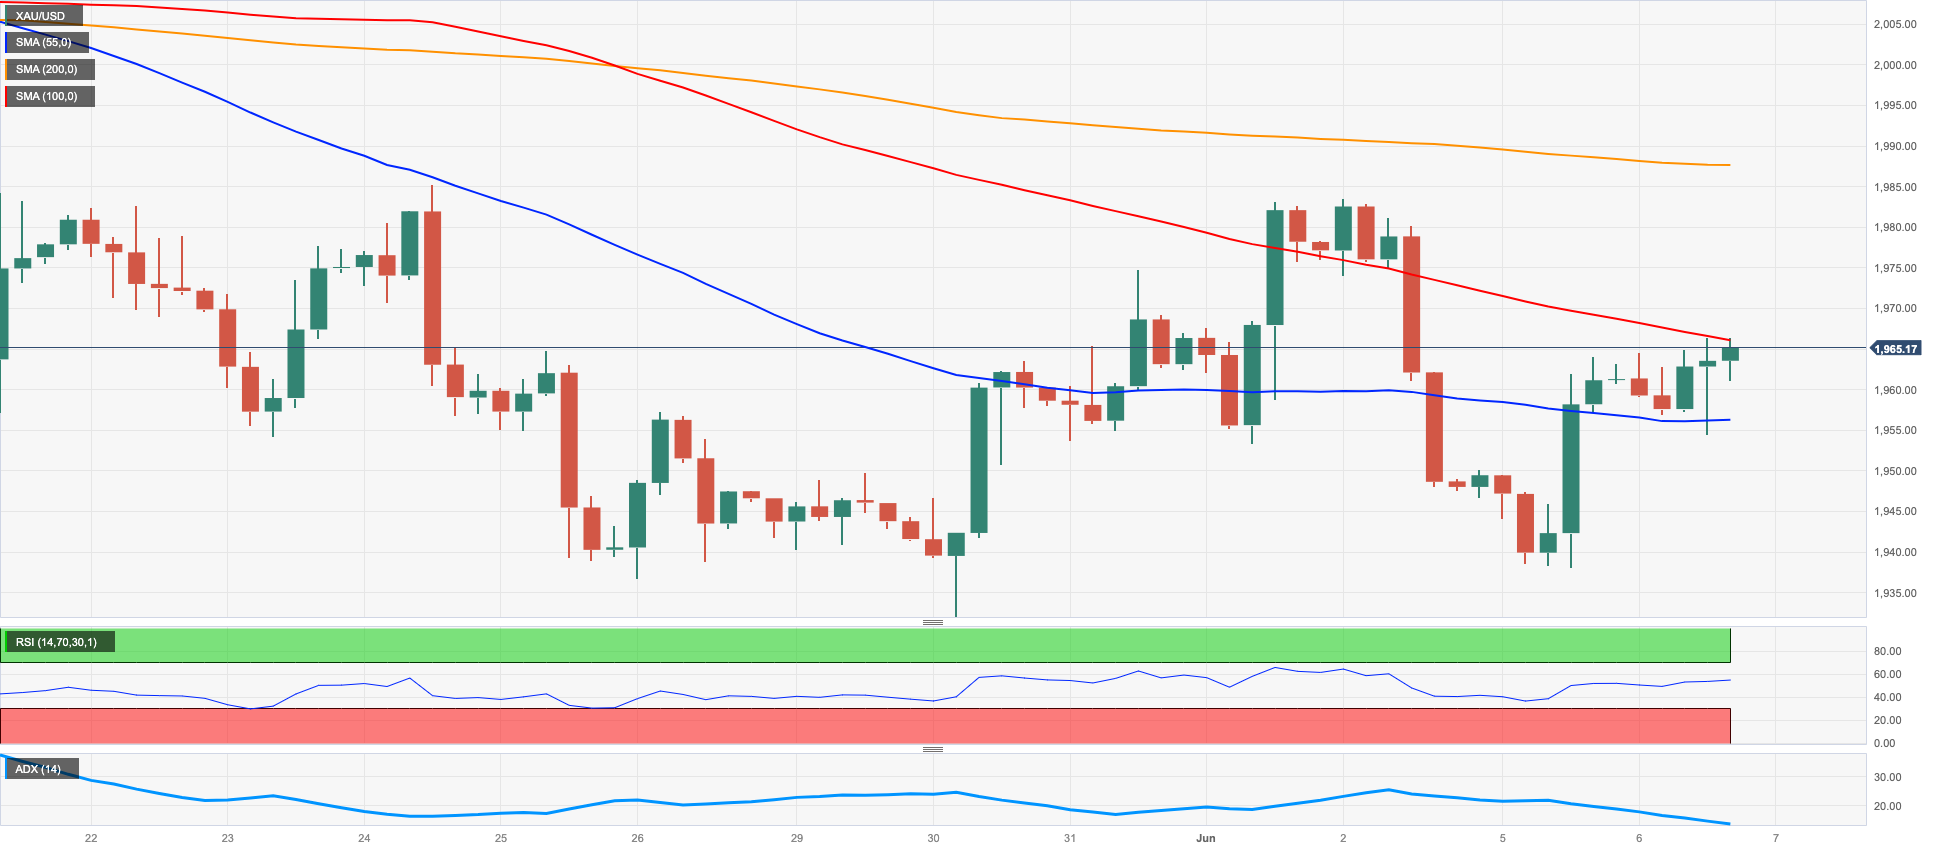
GOLD
Price action in the yellow metal remained inconclusive on Tuesday against the backdrop of the stronger dollar and the decent bounce in US yields across the curve.
As a matter of fact, bullion traded within a narrow range following the resurgence of the risk aversion, recording modest gains around the $1960 region per ounce troy amidst the broad-based knee-jerk in the risk complex and steady expectations of a Fed’s pause at the June 14 gathering.
Gold faces the next up-barrier at the June high at $1983 (June 2), which appears to be underpinned by the 55-day SMA at $1988, before possibly reaching the important $2000 level. Further up, there are no significant resistance levels until the 2023 high at $2067 (May 4) ahead of the 2022 top at $2070 (March 8) and the all-time peak at $2075 (August 7, 2020). Having Said that, there is initial support at the May low of $1932 (May 30), which appears propped up by the vicinity of the 100-day line SMA. If the decline continues, the 200-day SMA at $1837 could be recaptured before reaching the low at $1804 (February 28, 2023).
Resistance levels: $1962 $1988 $2022 (4H chart)
Support levels: $1932 $1885 $1809 (4H chart)
CRUDE WTI
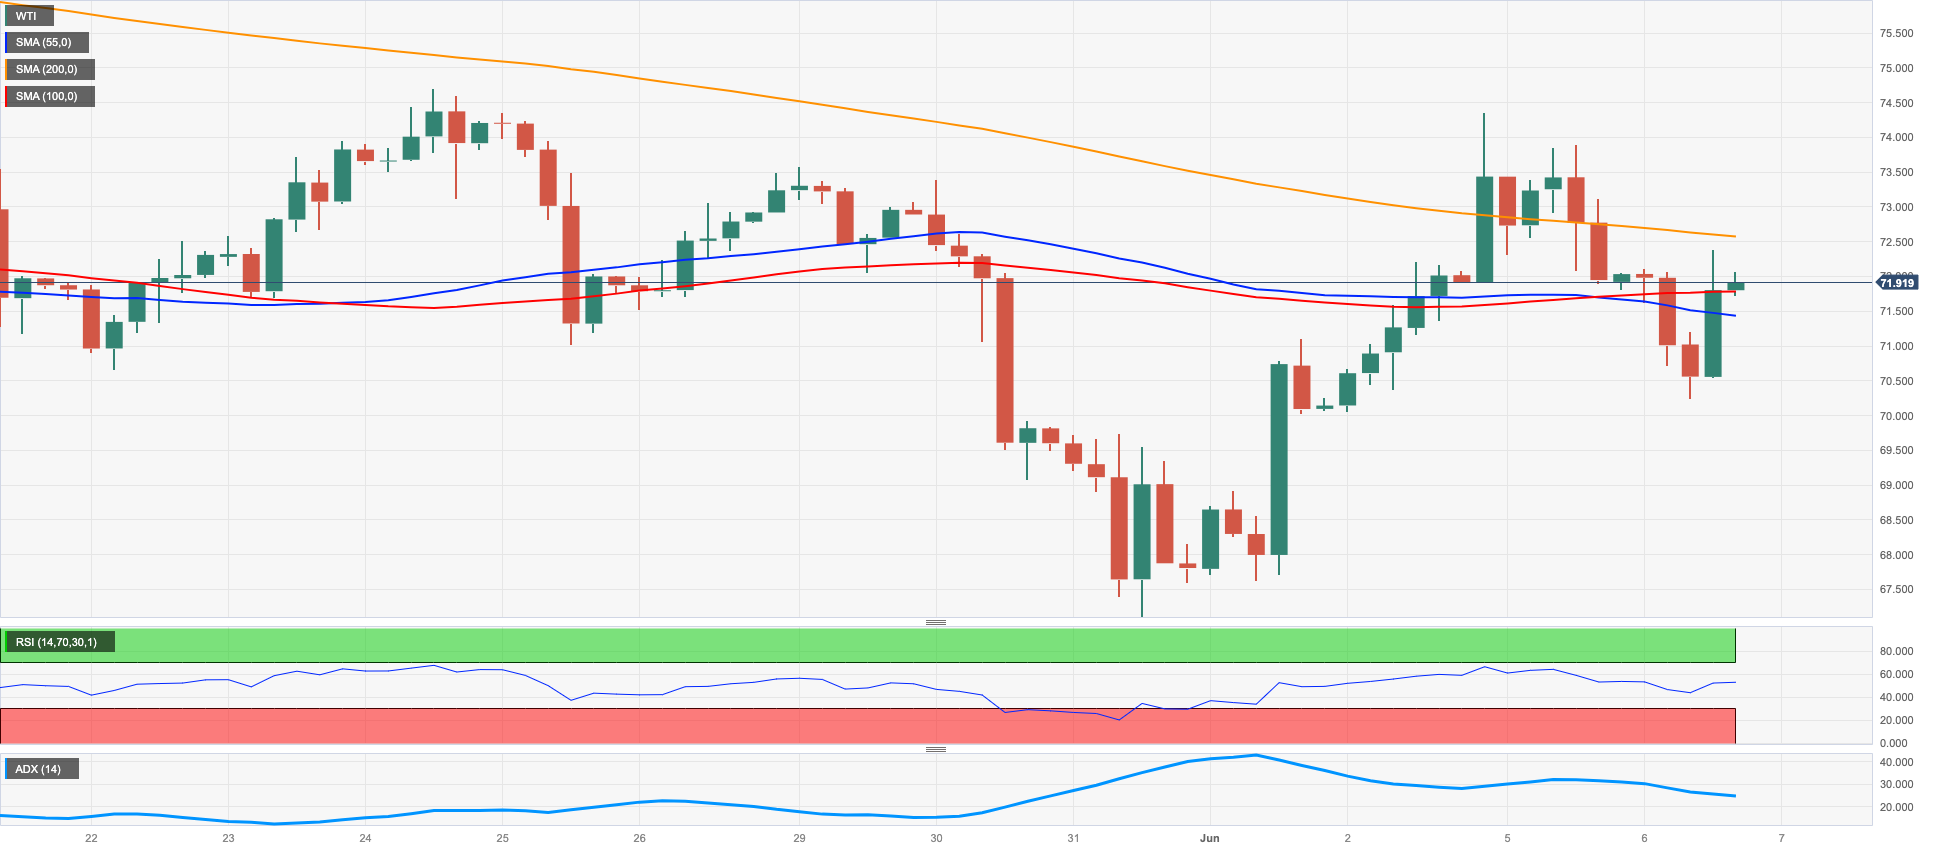
WTI prices managed to offset the earlier drop to the boundaries of the $70.00 mark per barrel and reclaim the $72.00 region late on Tuesday.
In the meantime, price action around the commodity hovered around concerns over the Chinese uneven recovery and the likelihood of a US recession, while the recent announcement of crude oil output cuts by Saudi Arabia seems to have limited the downside in prices.
Some support for crude oil prices also came after the EIA revised up its forecasts for crude oil demand for the current year by 30 kbpd (to 1.59 mbpd), while it reduced its projections for the next year by 20 kbpd (to 1.70b mbpd)
Later in the NA session, the API will report on US crude oil inventories for the week ended June 2.
For WTI, the interim 100-day SMA of $75.52 appears immediately to the upside, followed by the weekly high of $79.14 (April 24) and the important 200-day SMA of $79.29, both of which precede the key $80.00 per barrel barrier. If the comeback continues, the 2023 top of $83.49 (April 12) and the November 2022 peak of $93.73 are the next targets (November 7). On the contrary, the weekly low of $67.08 (May 31) emerges as the immediate challenger to the 2023 low of $63.61 (May 4). This level is also supported by the December 2021 low of $62.46 (December 2) prior to the fundamental $60.00 threshold per barrel.
Resistance levels: $74.92 $76.89 $79.14 (4H chart)
Support levels: $70.08 $67.08 $63.61 (4H chart)
GER40
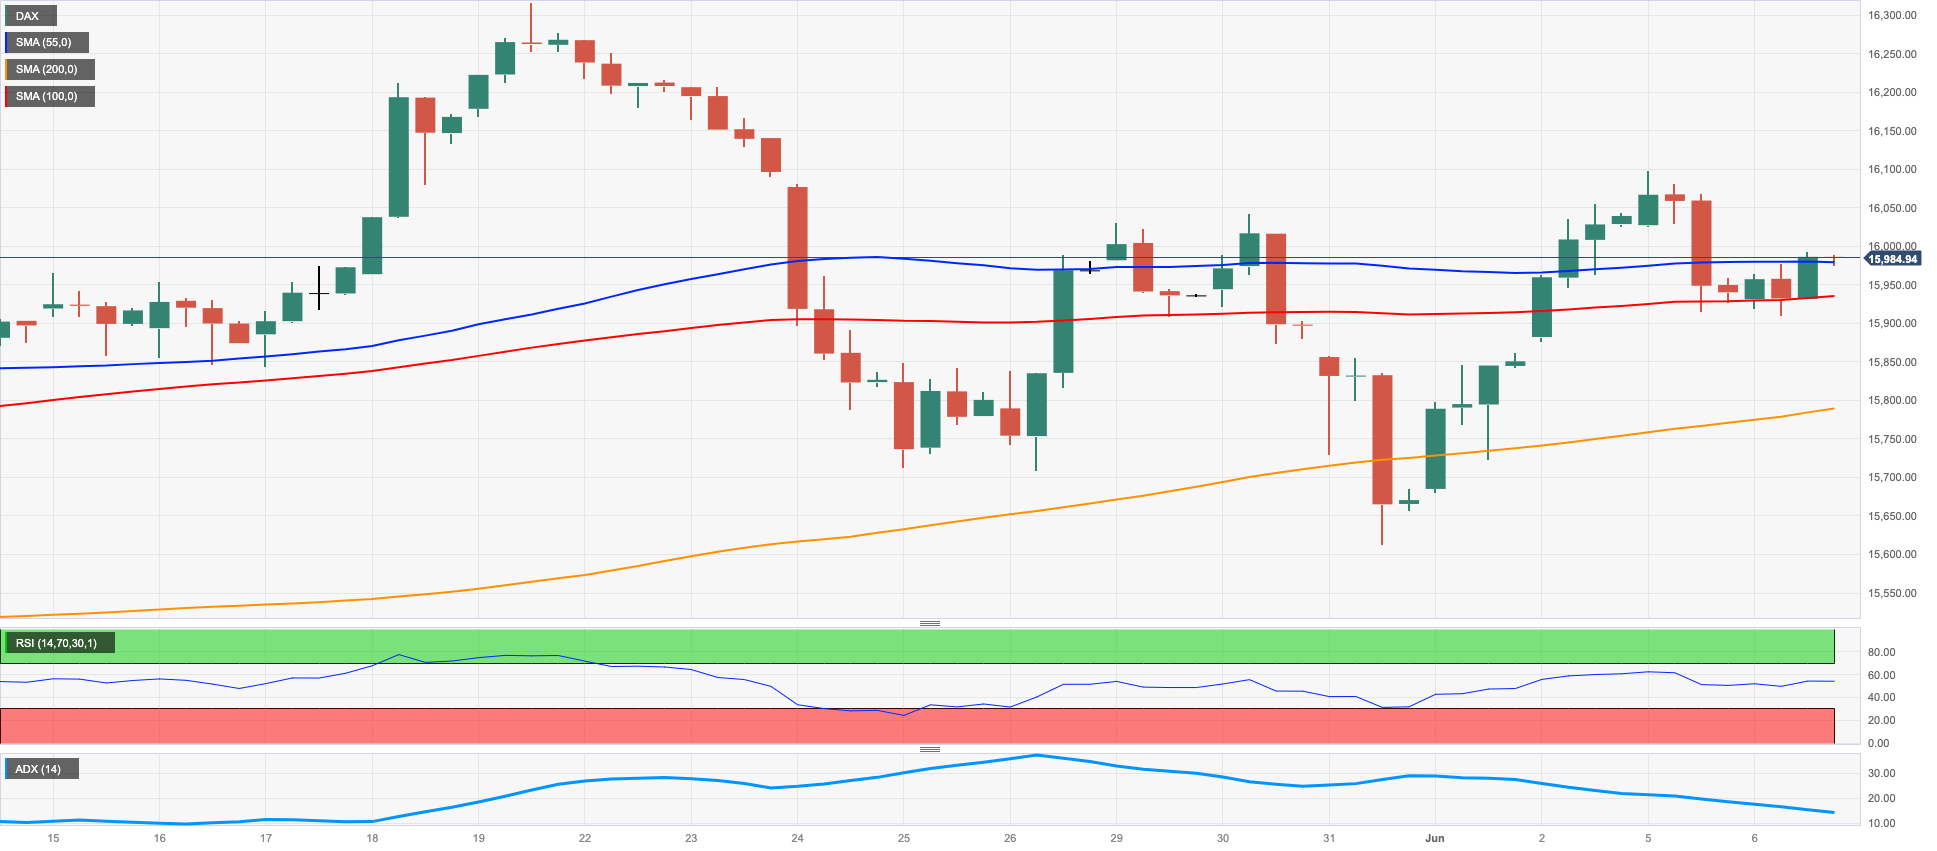
European markets reversed the pessimistic start of the week and ended Tuesday’s session mostly amidst black figures.
Germany’s reference DAX40 posted humble gains and approached the key round level of 16000, as investors gauged consumers’ declining inflation expectations vs. the likelihood of further tightening by the ECB, all following the release of the bank’s Consumer Expectation Survey earlier on Tuesday.
The daily uptick in the index came in contrast to the pullback in 10-year bund yields, which remained capped at the 2.40% level.
In the domestic docket, the HCOB Construction PMI rose to 43.9 in May (from 42.0), and Factory Orders saw a contraction of 0.4% in April vs. the previous month.
Further possible gains in the DAX40 are expected to attempt the all-time high of 16331 (May 19). Instead, the temporary 55-day SMA at 15729 should offer initial support prior to the May low of 15629 (May 31) and ahead of the provisional 100-day SMA at 15535. Further south emerges the April low of 15482 (April 5), which comes before the minor support at 14809 (March 24) and the crucial 200-day SMA at 14511, all followed by the March low of 14458 (March 20). The everyday RSI rose a tad past 53.
Best Performers: Sartorius AG VZO, MTU Aero, Vonovia
Worst Performers: Zalando SE, Dr Ing hc F Porsche AG Pfd, Deutsche Telekom AG
Resistance levels: 16079 16331 17000? (4H chart)
Support levels: 15658 15629 15482 (4H chart)
NASDAQ
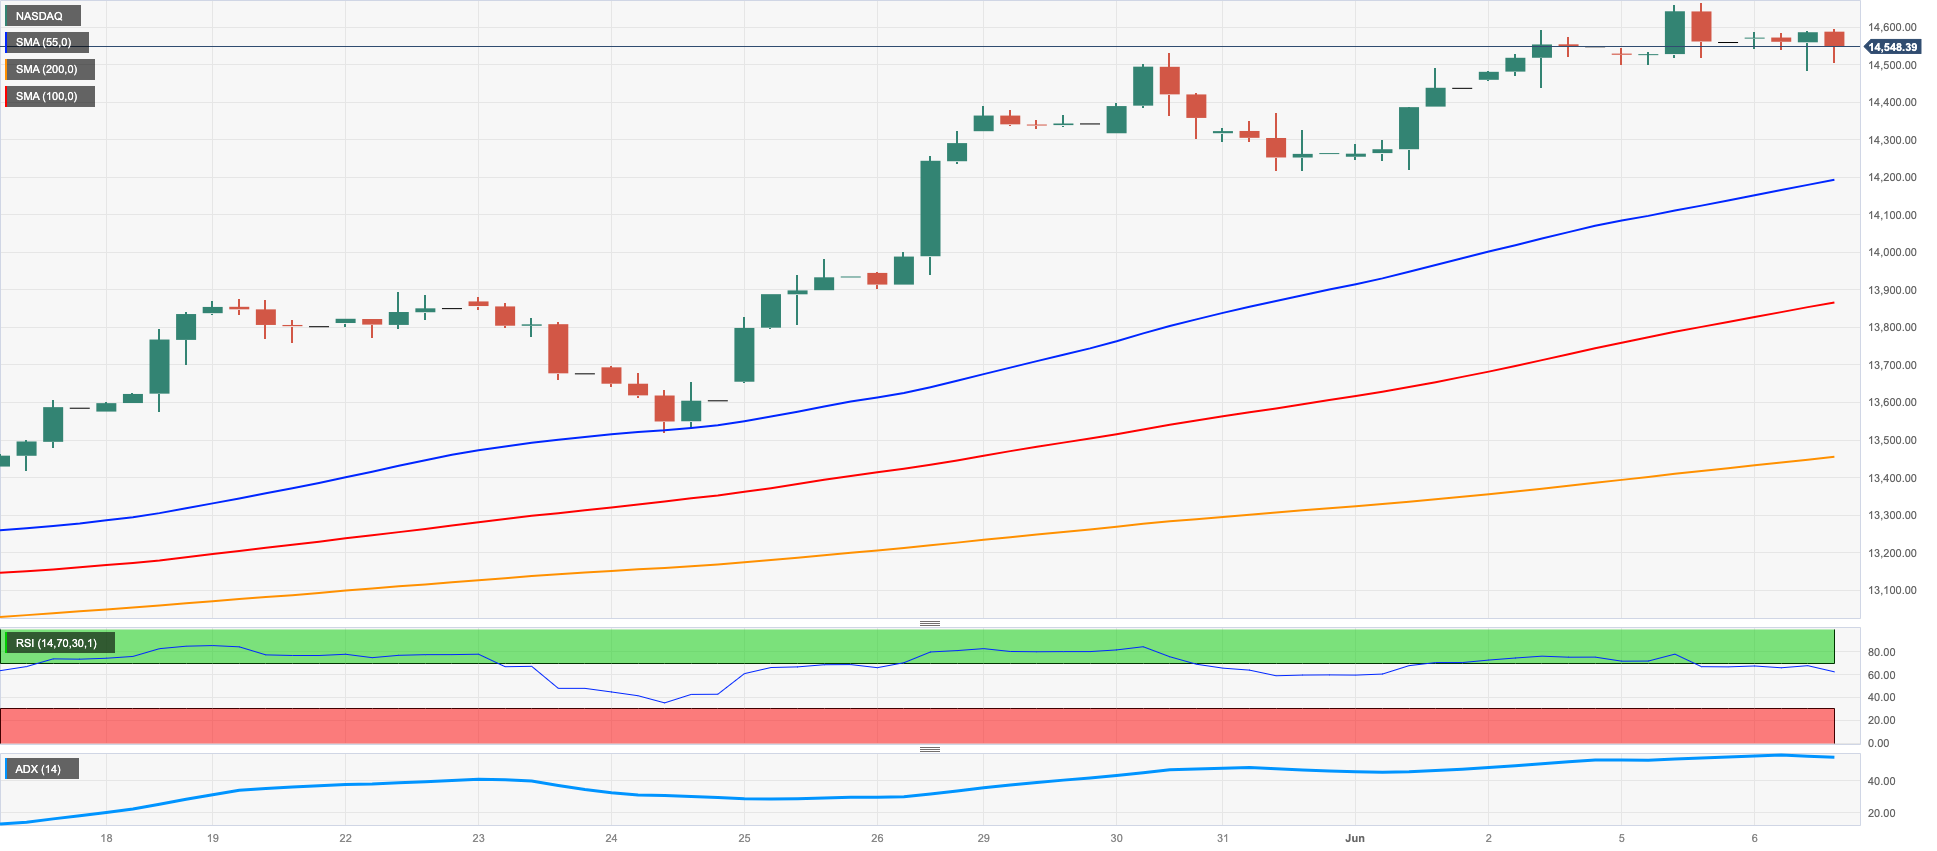
Tech stocks measured by the Nasdaq 100 retreated modestly following Monday’s fresh 2023 peaks around 14600 on Tuesday.
The knee-jerk in the tech benchmark came on the back of a further loss of momentum by megacap Apple (particularly after investors assessed the release of the Vision Pro augmented reality headset on Monday) in combination with the rebound in US yields and the stronger note of the dollar.
If the Nasdaq 100 surpasses its 2023 high of 14662 (June 5), it could potentially continue to rise towards the March 2022 peak of 15265 (March 29) before reaching the level of 16000. The other way around, the first level of defense against the bearish market would be the weekly low of 13520 (May 24), followed by the 55-day interim SMA at 13298 and the May low of 12938 (May 4). Before reaching the 2023 bottom at 10696 (January 6), there are other levels of support that should be considered, including the April low of 12724 (April 25), the 200-day SMA of 12164, the March low of 11695 (March 13), and the weekly lows of 11550 (January 25) and 11251 (January 19). The day-to-day RSI remained in the overbought territory near 74.
Top Gainers: PDD Holdings DRC, AMD, Warner Bros Discovery Inc
Top Losers: Fortinet, Broadcom, Illumina
Resistance levels: 14662 15161 15265 (4H chart)
Support levels: 14216 13520 12938 (4H chart)
DOW JONES
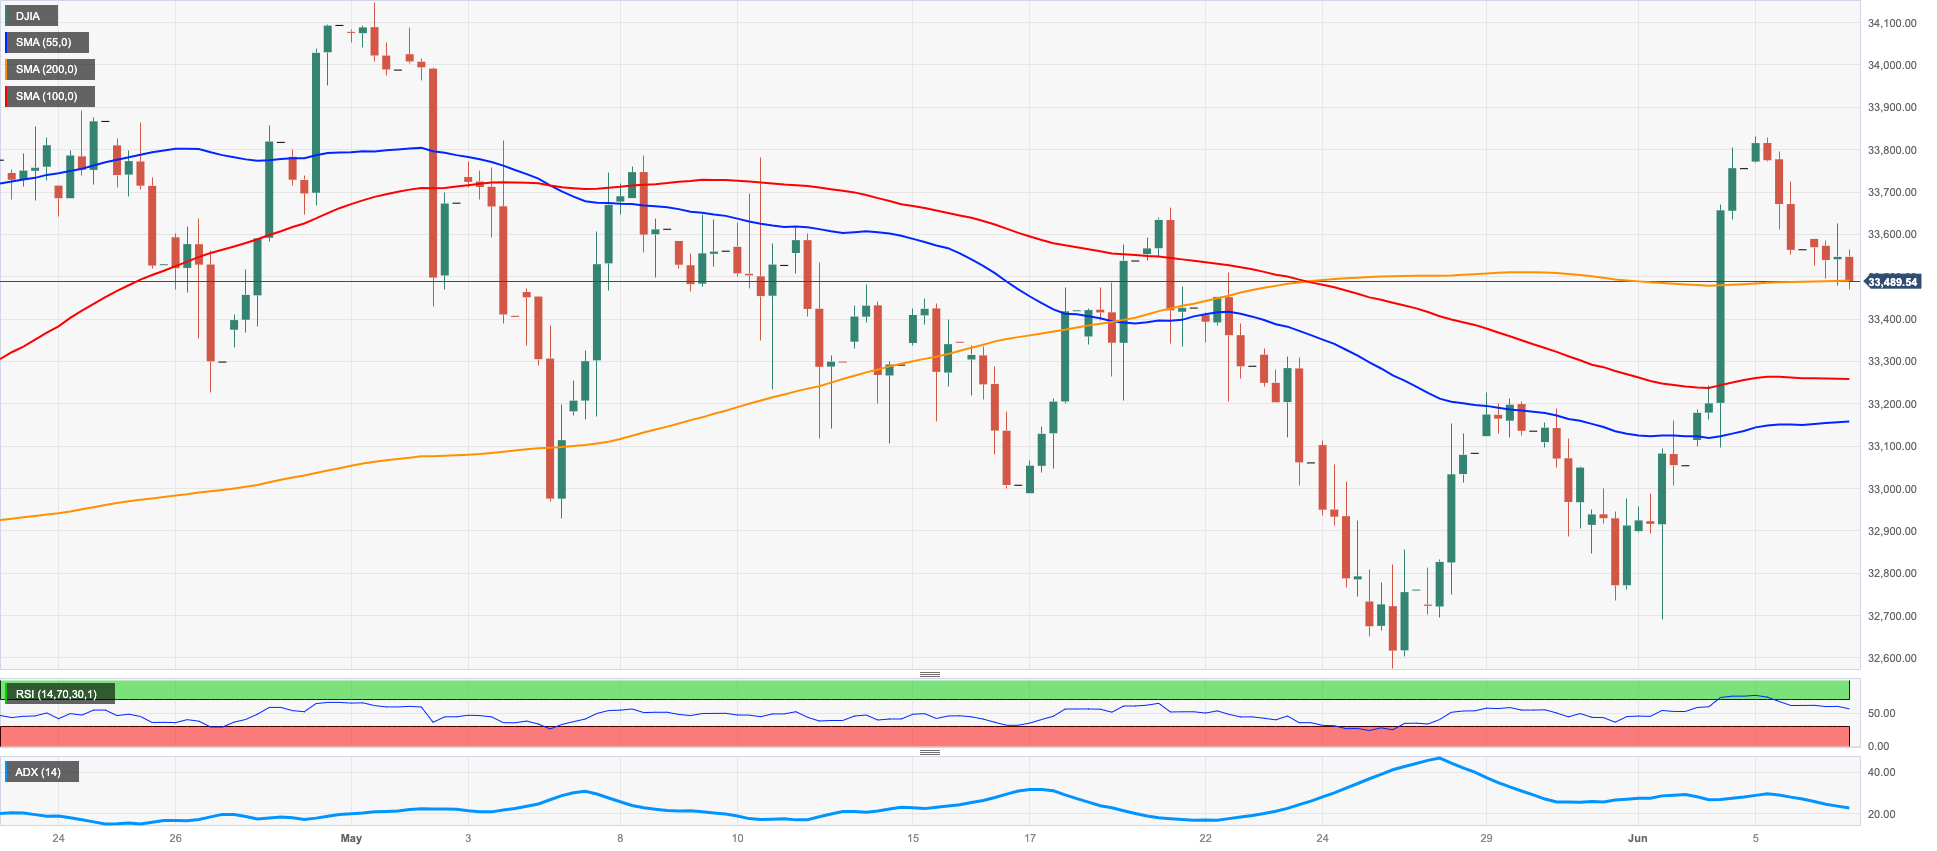
The US stocks reference Dow Jones extended the negative start of the week and dropped to 2-day lows below the 33500 region on turnaround Tuesday.
The bearish sentiment in equities resurfaced in response to fresh concerns over the likelihood that the normalization process by the Federal Reserve might still have further legs to go despite consensus around the June 14 gathering continuing to favour a pause.
On the whole, the Dow Jones deflated 0.11% to 33526, the S&P500 rose 0.07% to 4277, and the tech-heavy Nasdaq Composite advanced 0.16% to 13251.
The upside momentum in the Dow Jones now appears somewhat dented. However, the index is anticipated to keep its focus to the May high of 34257 (May 1), followed by the 2023 peak of 34342 (January 13), and the December 2022 top at 34712 (December 13). If it surpasses the latter, it may then aim for the April 2022 high of 35492 (April 21). On the downside, immediate contention can be found at the 200-day SMA at 32757, before reaching the May low of 32586 (May 25) and the 2023 low of 31429 (March 15). Further downward, the next significant level is the 2022 low at 28660 (October 13). The daily RSI receded below the 54 mark.
Top Performers: Intel, American Express, Dow
Worst Performers: UnitedHealth, Merck&Co, McDonald’s
Resistance levels: 33805 34257 34712 (4H chart)
Support levels: 33325 32586 31805 (4H chart)
MACROECONOMIC EVENTS

All Information & Updates provided by:

All information relating to the financial markets available on this page has been prepared and issued by FXStreet (Forexstreet SL, Spain, Reg: B62498233) on the basis of publicly available information and all information believed to be reliable and does not conflict with Kuwaiti local laws, and all necessary care has been taken to before the company to ensure that the facts mentioned are correct from the source.
NCM Investment nor any of its directors or employees shall in any way be held responsible for the contents of this news, and the information contained on this page is intended only to provide clients with publicly available information and should not be construed as investment advice, report or analysis and/or constitute an offer or invitation to buy or sell financial instruments of any kind.
RISK WARNING: Forex and CFDs are highly risky leveraged products, as losses can exceed deposits. Please ensure you understand all the risks and take independent advice if necessary. NCM will segregate the clients based on the criteria of the regulator and its bylaws. NCM does not provide any advisory service; the material published does not constitute advice or a recommendation for a transaction in any financial instrument. NCM accepts no responsibility for any use of the content presented and any consequences of that use. Anyone acting on the information provided does so at their own risk.