
- Contact Us:
-

-

-

-


Daily Market Updates
08 Jun 2023
USDJPY
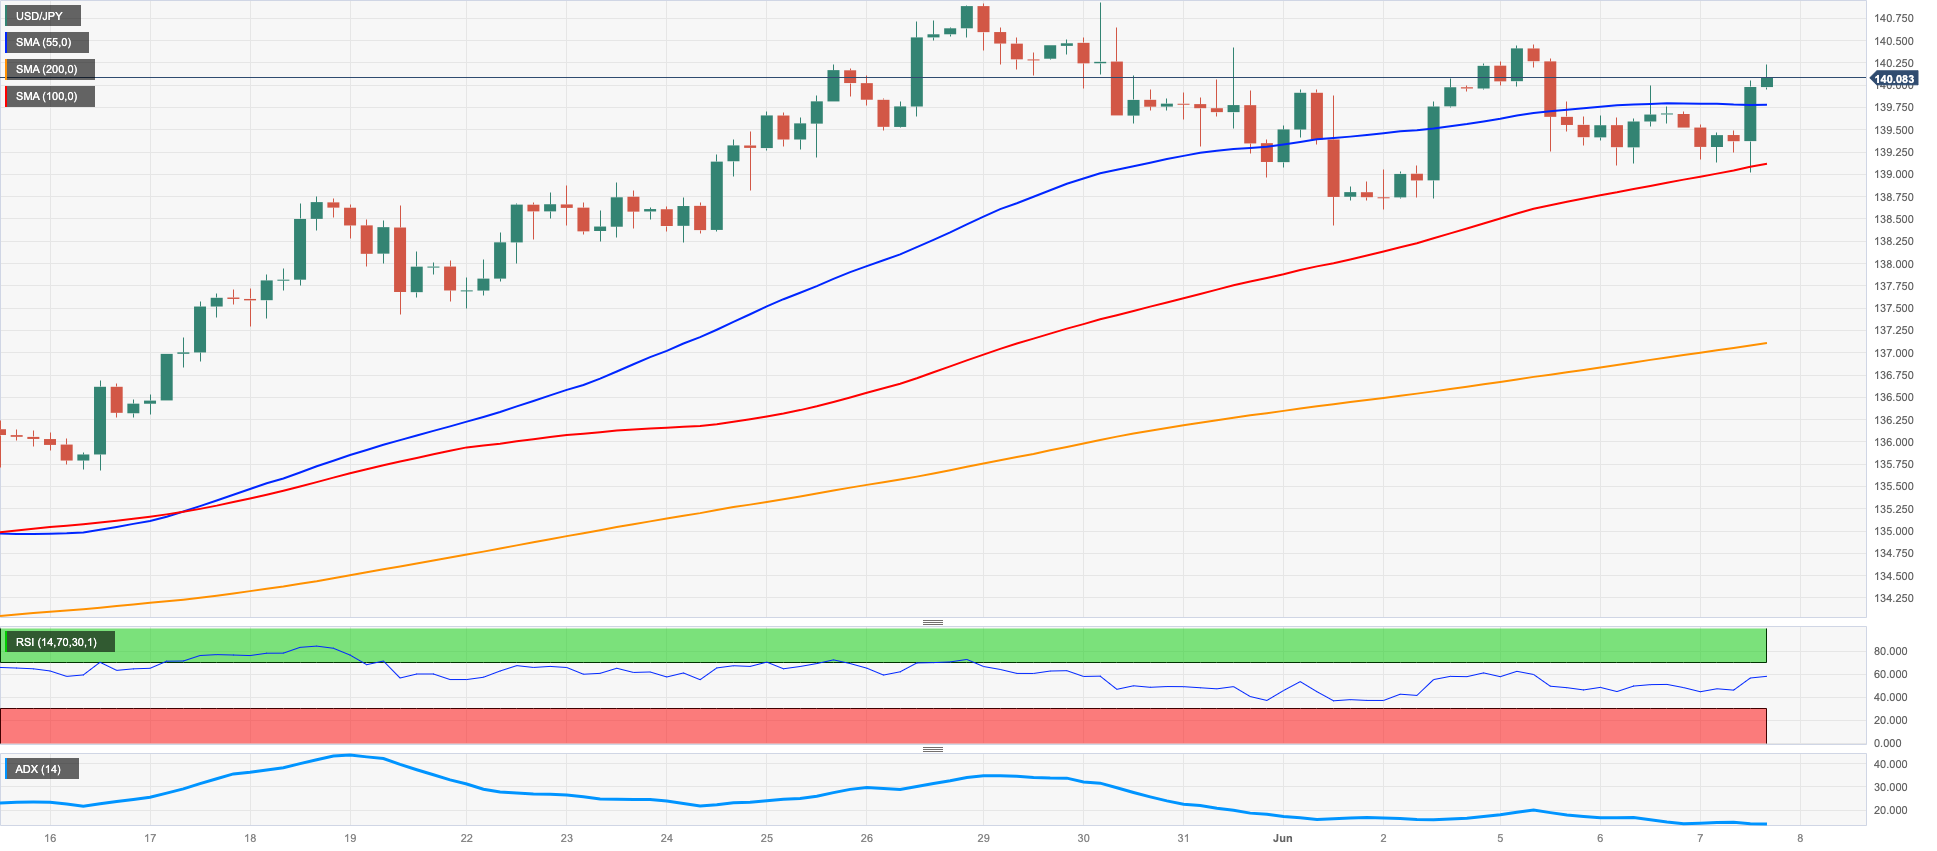
The optimism around USD/JPY remained unchanged, and the pair added to Tuesday’s gains just beyond the key 140.00 hurdle on Wednesday.
The pair’s move higher came despite the corrective retracement in the greenback, although the marked rebound in US yields across the curve and the improvement in the risk complex weighed on the Japanese currency midweek.
On the political front, PM Kishida announced a package of policy proposals encircling numerous challenges that need attention, such as childcare policy, labour market reform, supply chains, and the transition towards a greener economy. Kishida emphasized the goal of resolving social issues, which in turn would generate new sources of economic growth and contribute to the establishment of a sustainable and inclusive society.
In the docket, preliminary readings for the month of April saw the Coincident Index improve marginally to 99.4 and the Leading Economic Index climb to 97.6.
If the USD/JPY falls below the June low of 138.42 (June 1), the next support level would be at the critical 200-day SMA of 137.29. If the pair continues to fall, it will come into contact with the provisional 55-day and 100-day SMAs at 135.37 and 134.27, respectively. Any further decline might result in a retest of the weekly low of 133.01 (April 26), with minor support levels at 132.01 (April 13) and 130.62 (April 5). If there is a further retracement, the March low of 129.63 (March 24) and the February low of 128.08 (February 8) might become important support levels. The day-today RSI advanced a tad past the 64 mark.
Resistance levels: 140.45 140.93 141.1 (4H chart)
Support levels: 139.09 138.42 138.24 (4H chart)
GBPUSD
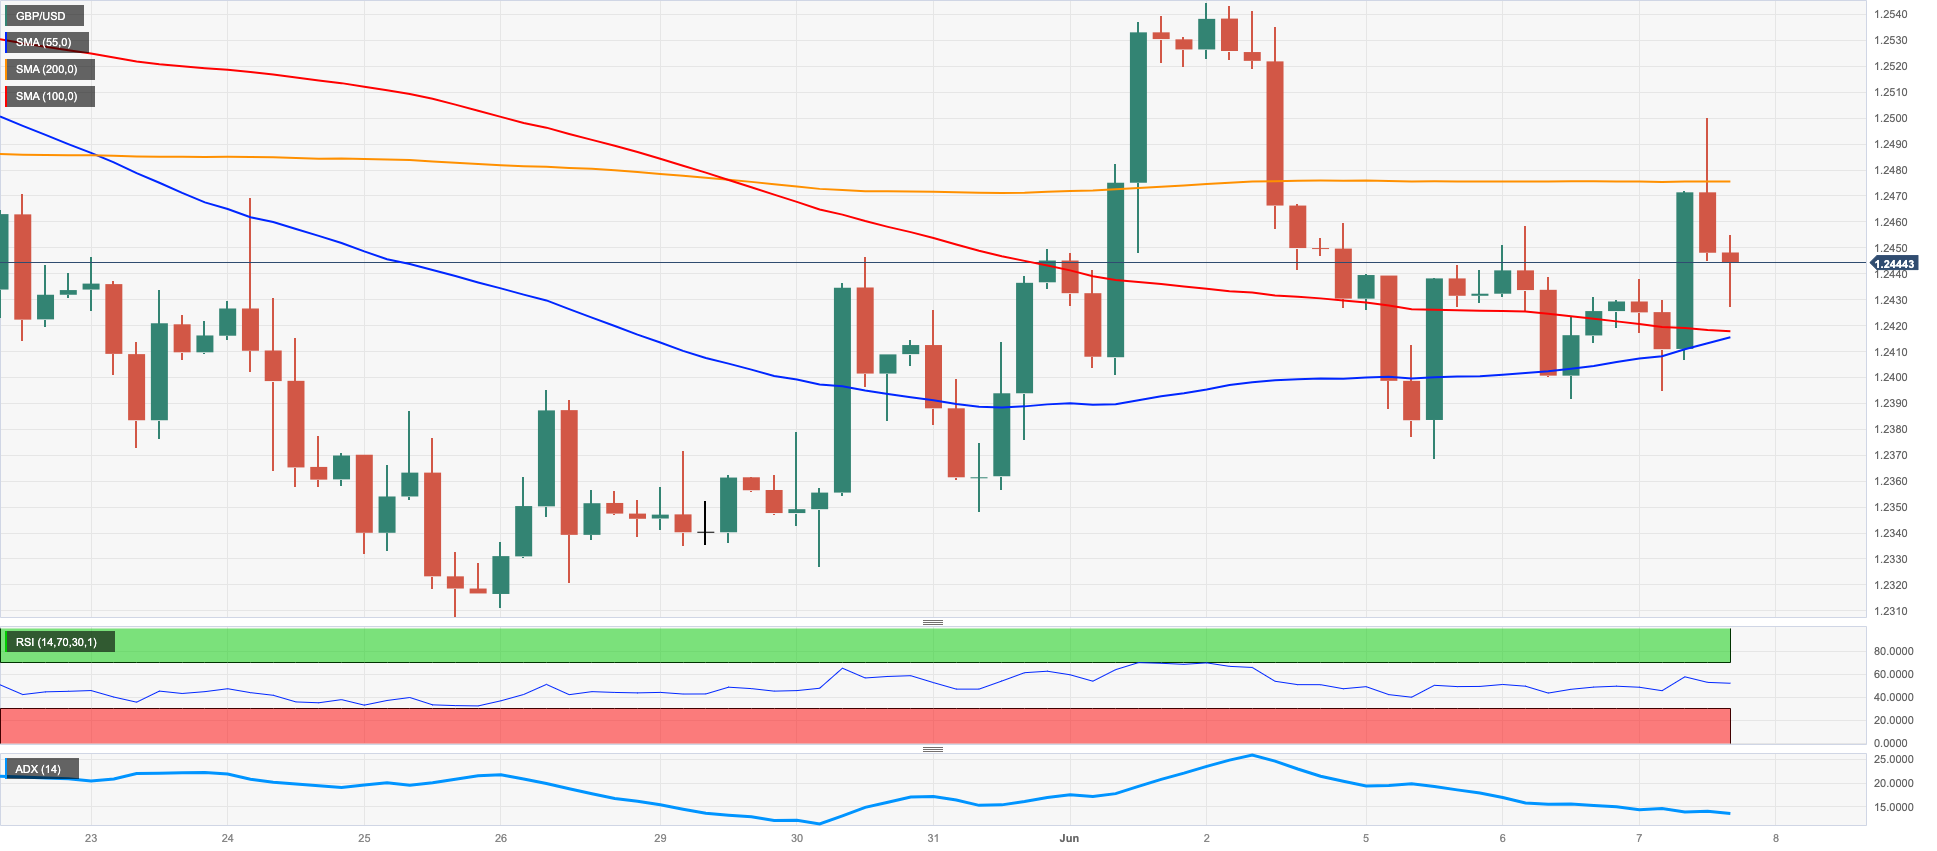
GBP/USD managed to regain some balance and reverse three straight sessions of losses on Wednesday, revisiting at the same time the area just pips below 1.2500 the figure, or 3-day highs.
The offered stance in the greenback coupled with the better tone in the risk-linked space helped the Sterling recoup part of the ground lost in the first half of the week, while the rebound to monthly highs in the UK 10-year Gilt yields also propped up gains in the quid.
In the UK docket, the Halifax House Price Index came in flat on a monthly basis in May and retreated 1.0% vs. the same month in 2022.
GBP/USD currently faces significant resistance at the June high at 1.2544 (June 2). This level is a crucial barrier that needs to be broken before the pair can reach its 2023 top at 1.2679 (May 10). Beyond that emerges the 200-week SMA is at 1.2868 and finally the psychological level of 1.3000. On the other hand, the immediate target is the May low at 1.2308 (May 25), which appears underpinned by the temporary 100-day SMA at 1.2303 and is ahead of the April low of 1.2274 (April 3). If the pair continues its downtrend, the next important support level is the 200-day SMA at 1.2003, which is just above the 2023 low of 1.1802 recorded (March 8). The RSI on the daily chart surpassed the 50 threshold.
Resistance levels: 1.2499 1.2544 1.2679 (4H chart)
Support levels: 1.2368 1.2347 1.2308 (4H chart)
AUDUSD
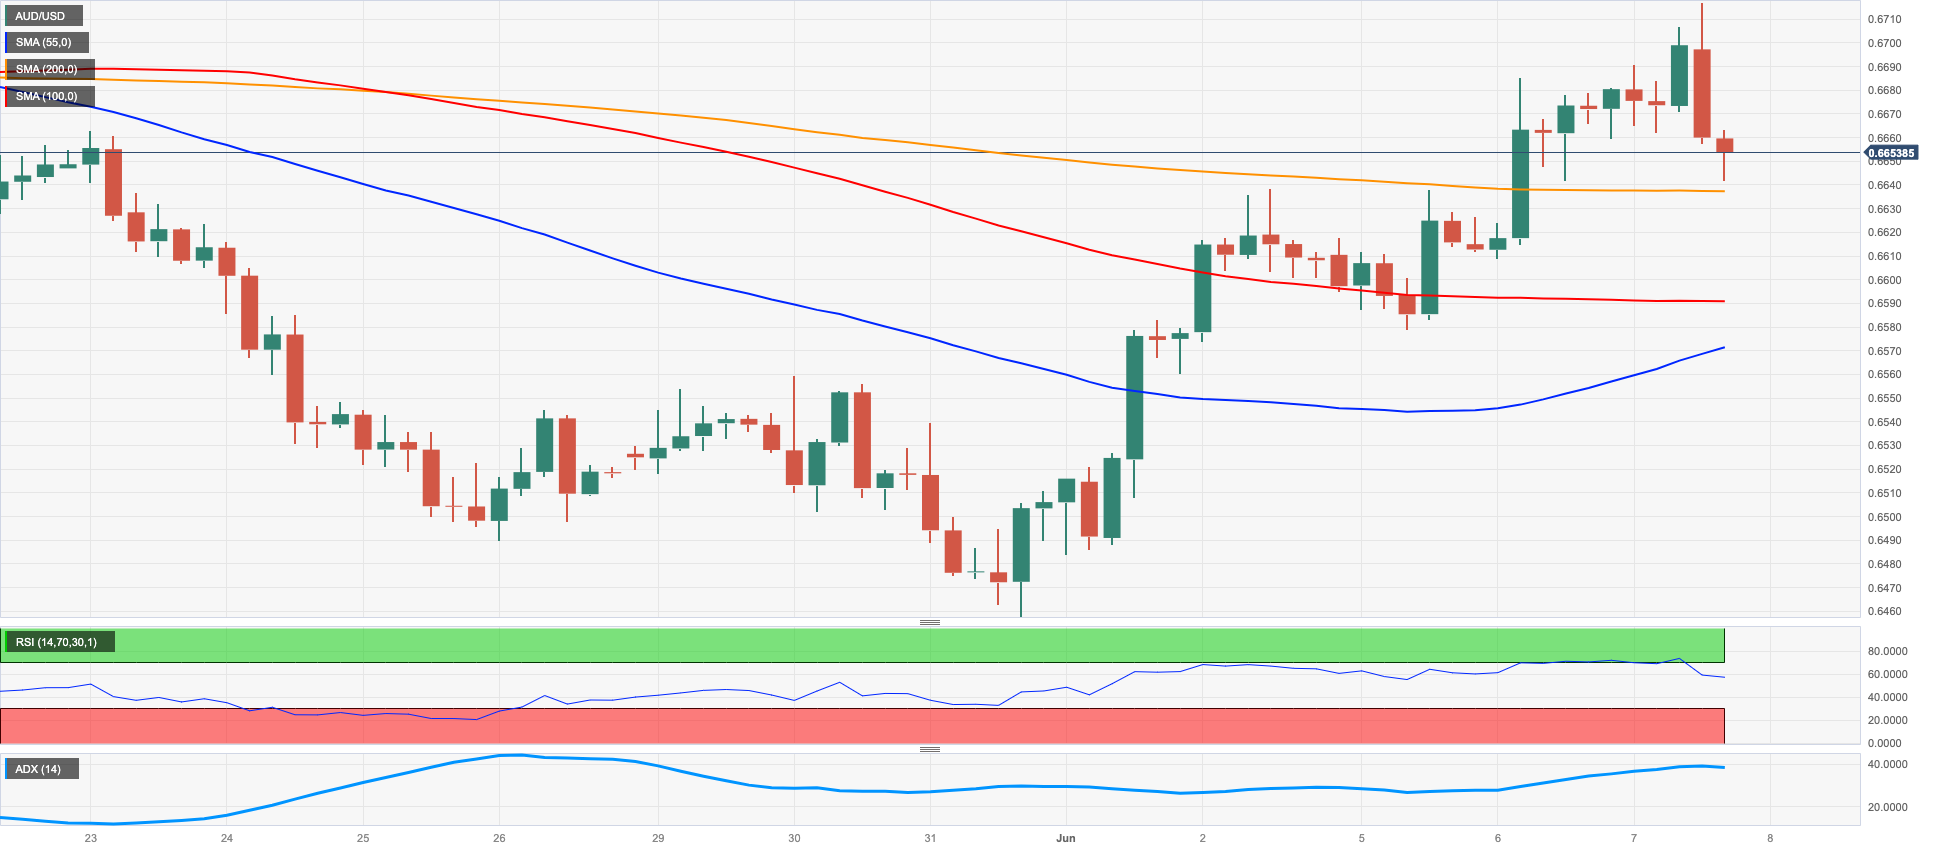
AUD/USD advanced past the key 0.6700 the figure earlier in the session just to come all the way down to the mid-0.6600s near the closing bell in the US.
The negative session in the pair came after four daily advances in a row and was sponsored by the late rebound in the greenback and the mixed note in the commodity universe.
Initial strength in the Aussie dollar was also propped up by the hawkish message from the RBA’s P. Lowe, who expressed that the bank’s goal remains to bring inflation back to target within a few years, but their assessment of the risks has changed in the past few months. While they have been willing to exercise patience in achieving their goal, their tolerance for risks has limits, which have been tested. Lowe emphasized that the board's desire to maintain the labour market's progress does not mean they will accept persistently high inflation.
In Australia, the Ai Group Industry Index improved to -10.9 in May (from -20.1), while Q1 GDP figures came in short of expectations after the economy expanded 0.2% QoQ and 2.3% over the last twelve months.
If the rebound continues, the AUD/USD should test the transitory 100-day SMA at 0.6744 ahead of the May high of 0.6818 (May 10) and the psychological level of 0.7000, which is followed by the weekly top of 0.7029 (February 14) and the 2023 peak of 0.7157 (February 2). On the flip side, if the pair falls below the 2023 low of 0.6458 (May 31), losses might hit the weekly low of 0.6386 (November 10) before dropping to the November 2022 low of 0.6272 (November 3). The daily RSI dropped to the vicinity of the 53 zone.
Resistance levels: 0.6717 0.6818 0.6920 (4H chart)
Support levels: 0.6640 0.6579 0.6458 (4H chart)
GOLD
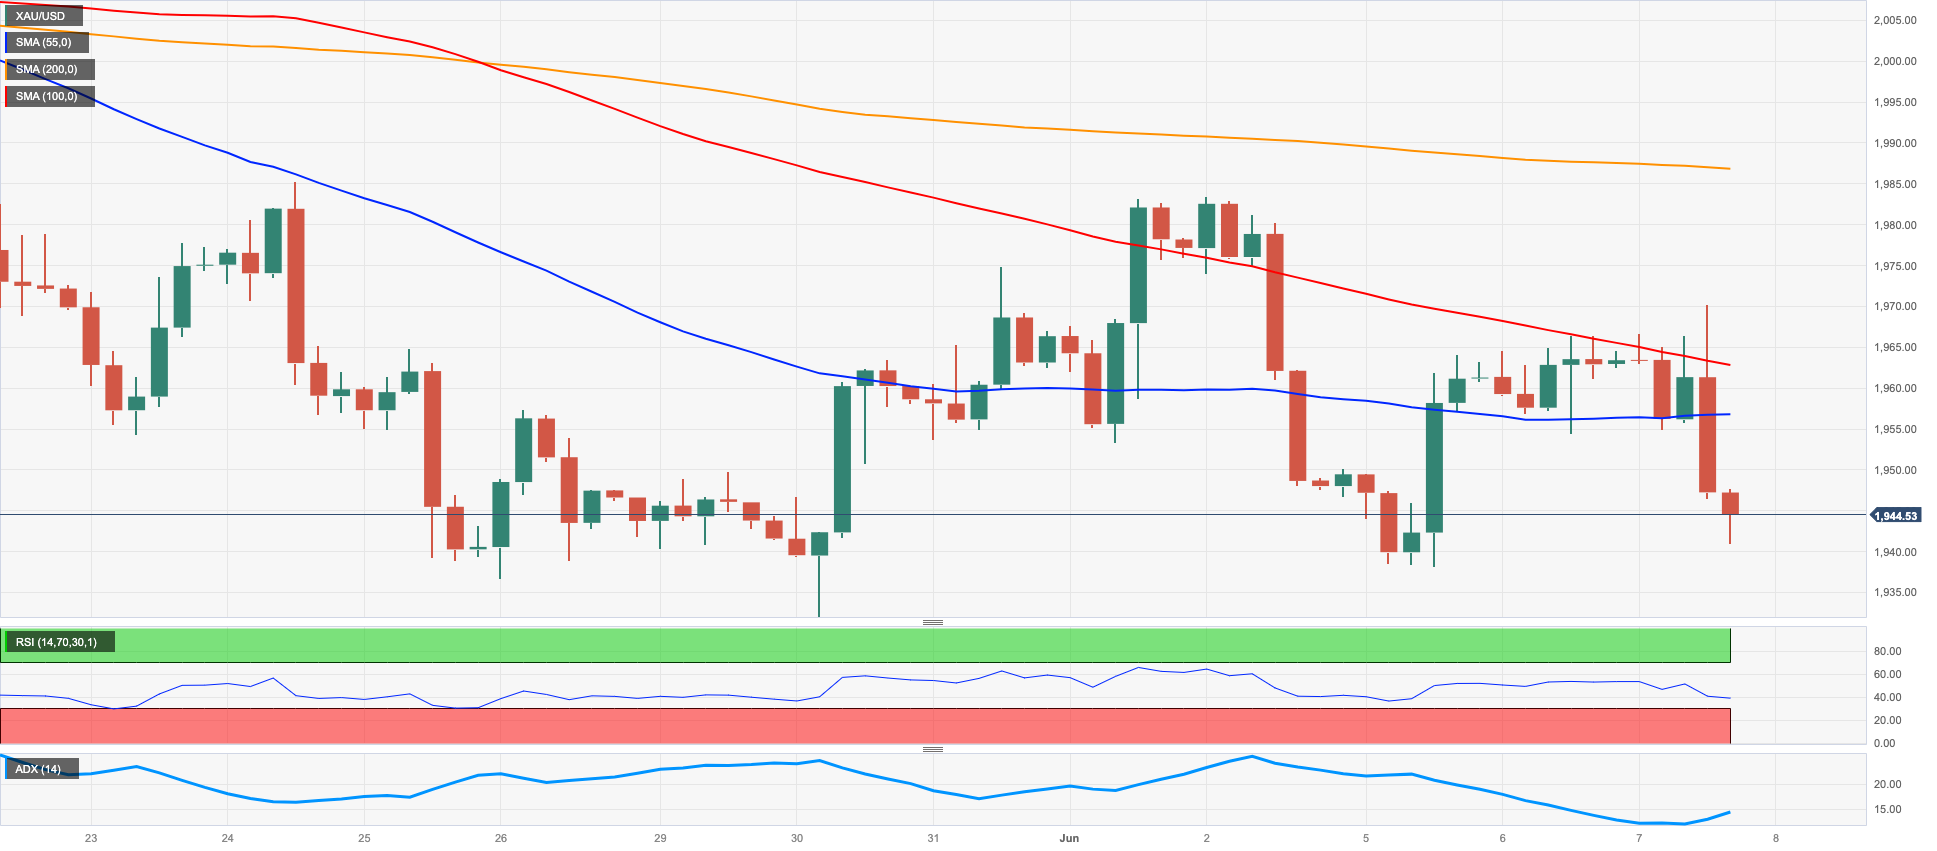
Gold prices traded on the defensive after two straight sessions with gains on Wednesday, briefly revisiting the $1940 region, a region coincident with the 100-day SMA and where some support seems to have emerged so far.
Furthermore, and despite the daily pullback, the precious metal remained stuck within the range bound theme in place since mid-May and with a floor around the $1930 area.
Sellers returned to the yellow metal in a context where the greenback trimmed initial losses and US yields charted a marked advance across the curve.
The continuation of the decline could see the May low of $1932 (May 30) revisited ahead of the 200-day SMA at $1838 and the 2023 low of $1804 (February 28). On the flip side, the resistance level emerges at the June high of $1983 (June 2) prior to the 55-day SMA at $1989 and the significant milestone of $2000. If the upward momentum persists, there are no notable resistance levels until the 2023 high of $2067 (May 4), followed by the 2022 peak at $2070 (March 8) and the all-time top at $2075 (August 7, 2020).
Resistance levels: $1970 $1987 $2022 (4H chart)
Support levels: $1932 $1885 $1809 (4H chart)
CRUDE WTI
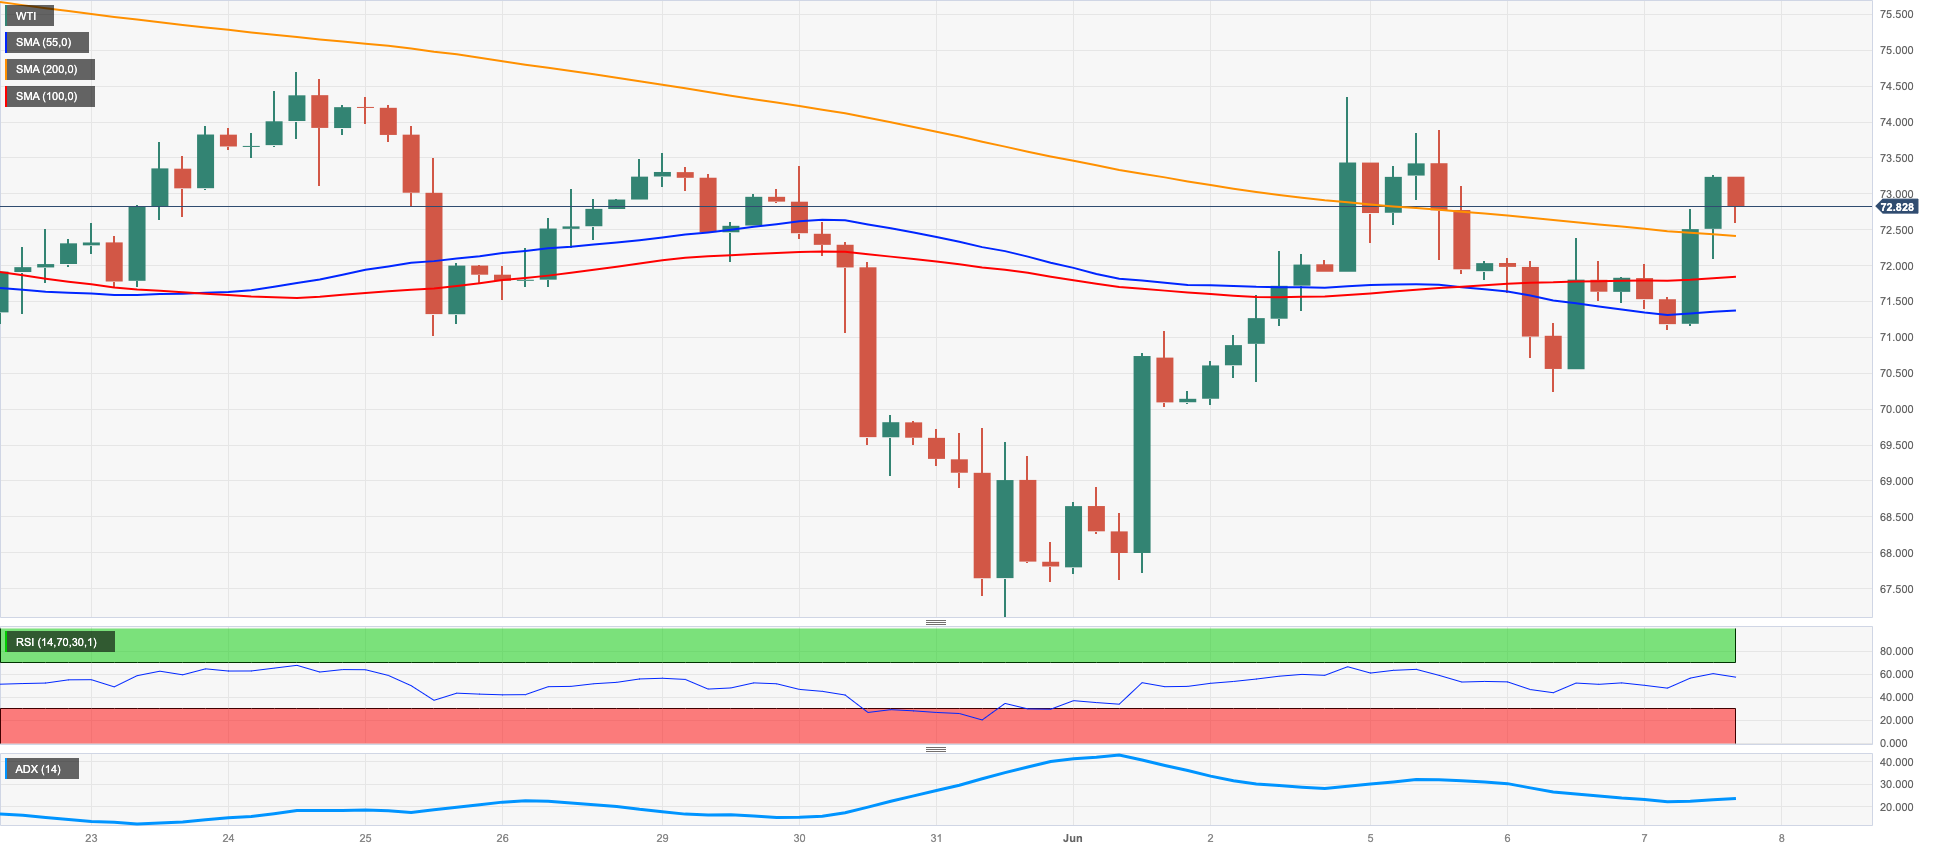
Prices of the American benchmark for sweet light crude oil reversed the initial China-led drop to the $71.00 region per barrel and returned to positive territory near the $73.00 zone.
Traders, in the meantime, gauged the recent announcement by Saudi Arabia to reduce further the oil output vs. demand concerns stemming from discouraging prints from the Chinese trade balance, the prospects of further tightening by the Fed, and the unexpected build in US crude oil supplies, as per the EIA’s report.
On the latter, the agency reported that US crude oil inventories unexpectedly dropped by 0.451M barrels in the week to June 2, while supplies at Cushing rose by 1.721M barrels, Weekly Distillate Stocks went up by 5.075M barrels, and gasoline stockpiles increased more than expected by 2.746M barrels.
Next on the upside for WTI emerges the temporary 100-day SMA at $75.45. If this hurdle is surpassed, the next levels to watch are the key 200-day SMA at $79.09 just ahead of the weekly high of $79.14 (April 24). These milestones precede the key barrier of $80.00 per barrel and come ahead of the 2023 top of $83.49 (April 12) and the November 2022 high of $93.73 (November 7). Having said that, the immediate obstacle on the downside is the weekly low of $67.08 (May 31), which is followed by the 2023 low of $63.61 (May 4). This level finds support from the December 2021 low of $62.46 (December 2) prior to the significant threshold of $60.00 per barrel.
Resistance levels: $73.15 $74.92 $76.89 (4H chart)
Support levels: $70.08 $67.08 $63.61 (4H chart)
GER40
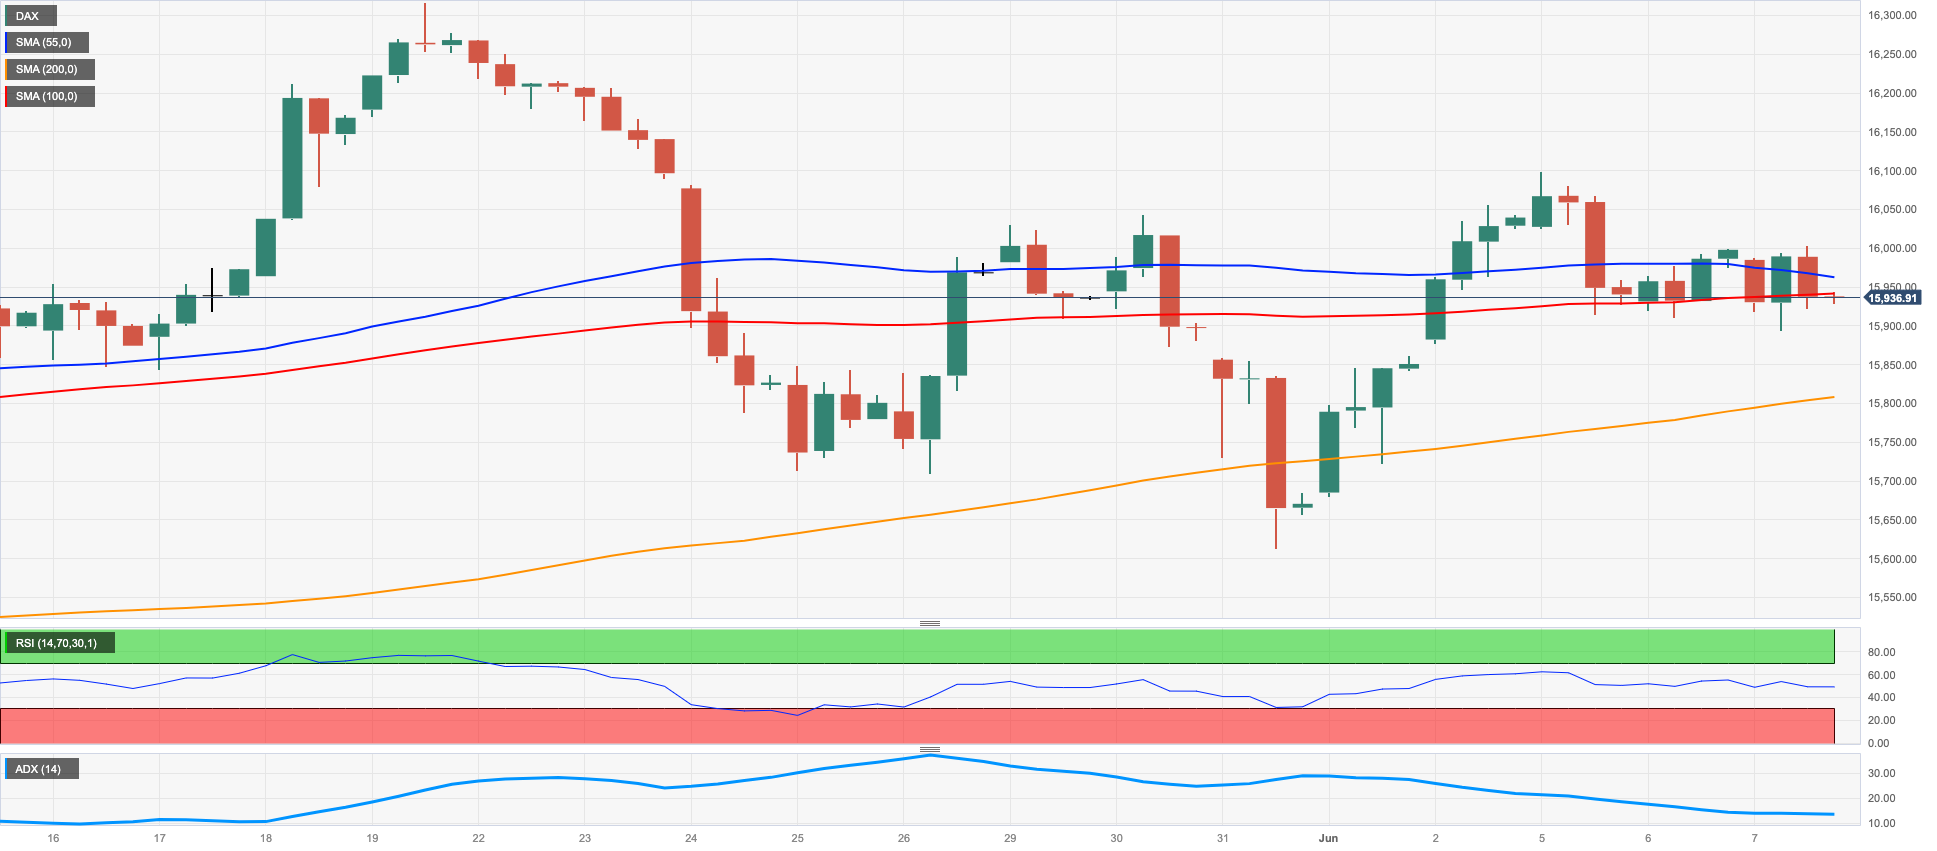
European markets closed mostly in the negative with the exception of the UK and Spanish benchmark indices.
Stocks gauged by the German DAX40 faded Tuesday’s uptick and closed below the 16000 mark, keeping the weekly erratic performance in place at the same time on the back of increasing cautiousness ahead of the key FOMC and ECB events due in the next few days.
The corrective decline in the index came in contrast to the move higher in 10-year bund yields to monthly tops past 2.45%.
Data-wise, Industrial Production in Germany expanded below consensus at a monthly 0.3% during April in what was the sole release on Wednesday.
The DAX40 faces the next up-barrier of note at the June high of 16114 (June 5) ahead of the all-time top of 16331 (May 19). Instead, the interim 55-day SMA at 15750 emerges as the initial contention before the May low of 15629 (May 31) and the transitory 100-day SMA at 15544. Further south, the April low of 15482 (April 5) appears, followed by the weak support at 14809 (March 24) and the important 200-day SMA at 14524, all of which are followed by the March low of 14458 (March 20). The daily RSI slipped back below 52.
Best Performers: Infineon, Commerzbank, Daimler Truck Holding
Worst Performers: Hannover Rueck SE, Symrise AG, Zalando SE
Resistance levels: 16114 16331 17000? (4H chart)
Support levels: 15668 15629 15482 (4H chart)
NASDAQ
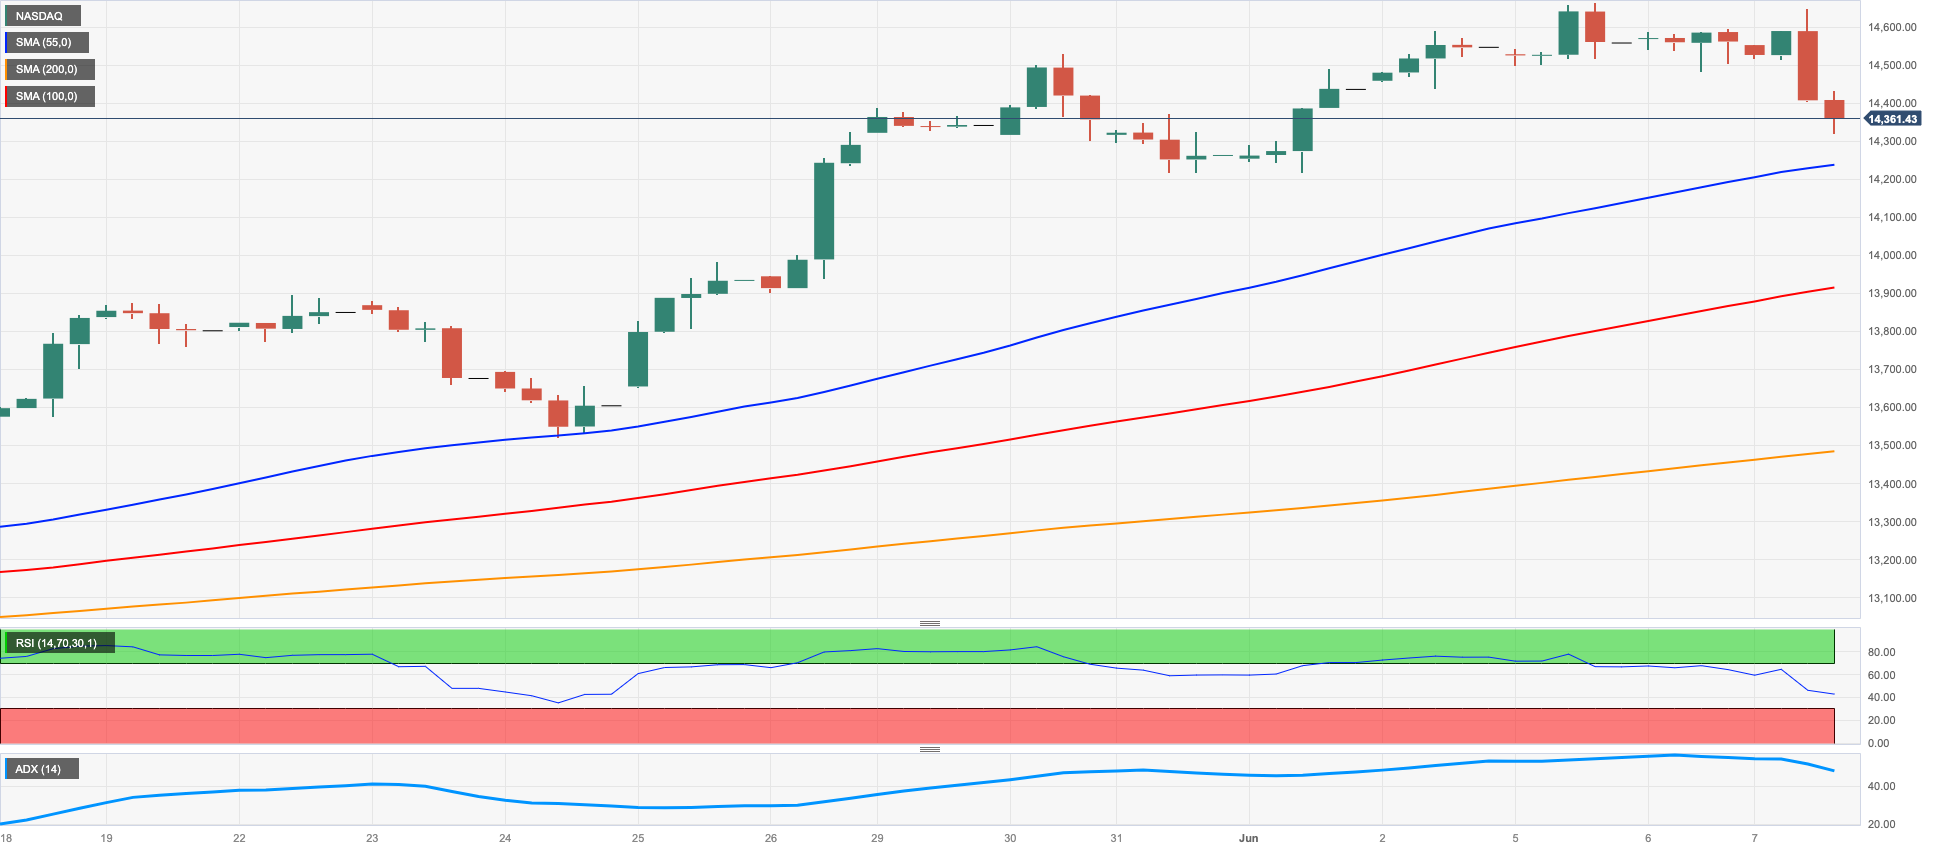
The 4-day positive streak in the tech benchmark Nasdaq 100 halted on Wednesday after the index dropped to multi-day lows near the 14300 region.
The move lower in the index came as investors cashed out on some of the strong gains seen in the sector in the past few weeks.
Looking at the weekly chart, and following Wednesday’s retracement, the index is now losing ground for the first time after six consecutive gains.
If the Nasdaq 100 index surpasses the 2023 high of 14662 (June 5), there is a potential for further upward movement towards the March 2022 peak of 15265 (March 29). Beyond that, the next significant level to watch would be 16000. On the opposite side, the initial line of defense would be the weekly low of 13520 (May 24), followed by the interim 55-day SMA at 13331 and the May low of 12938 (May 4). Before reaching the 2023 bottom at 10696 (January 6), several support levels should be considered, including the April low of 12724 (April 25), the 200-day SMA positioned at 12169, the March low of 11695 (on March 13), and the weekly lows of 11550 (on January 25) and 11251 (on January 19). The day-to-day RSI receded to the 65 area.
Top Gainers: Warner Bros Discovery Inc, Microchip, Old Dominion Freight Line Inc
Top Losers: Datadog, Lucid Group, DexCom
Resistance levels: 14662 15161 15265 (4H chart)
Support levels: 14216 13520 12938 (4H chart)
DOW JONES
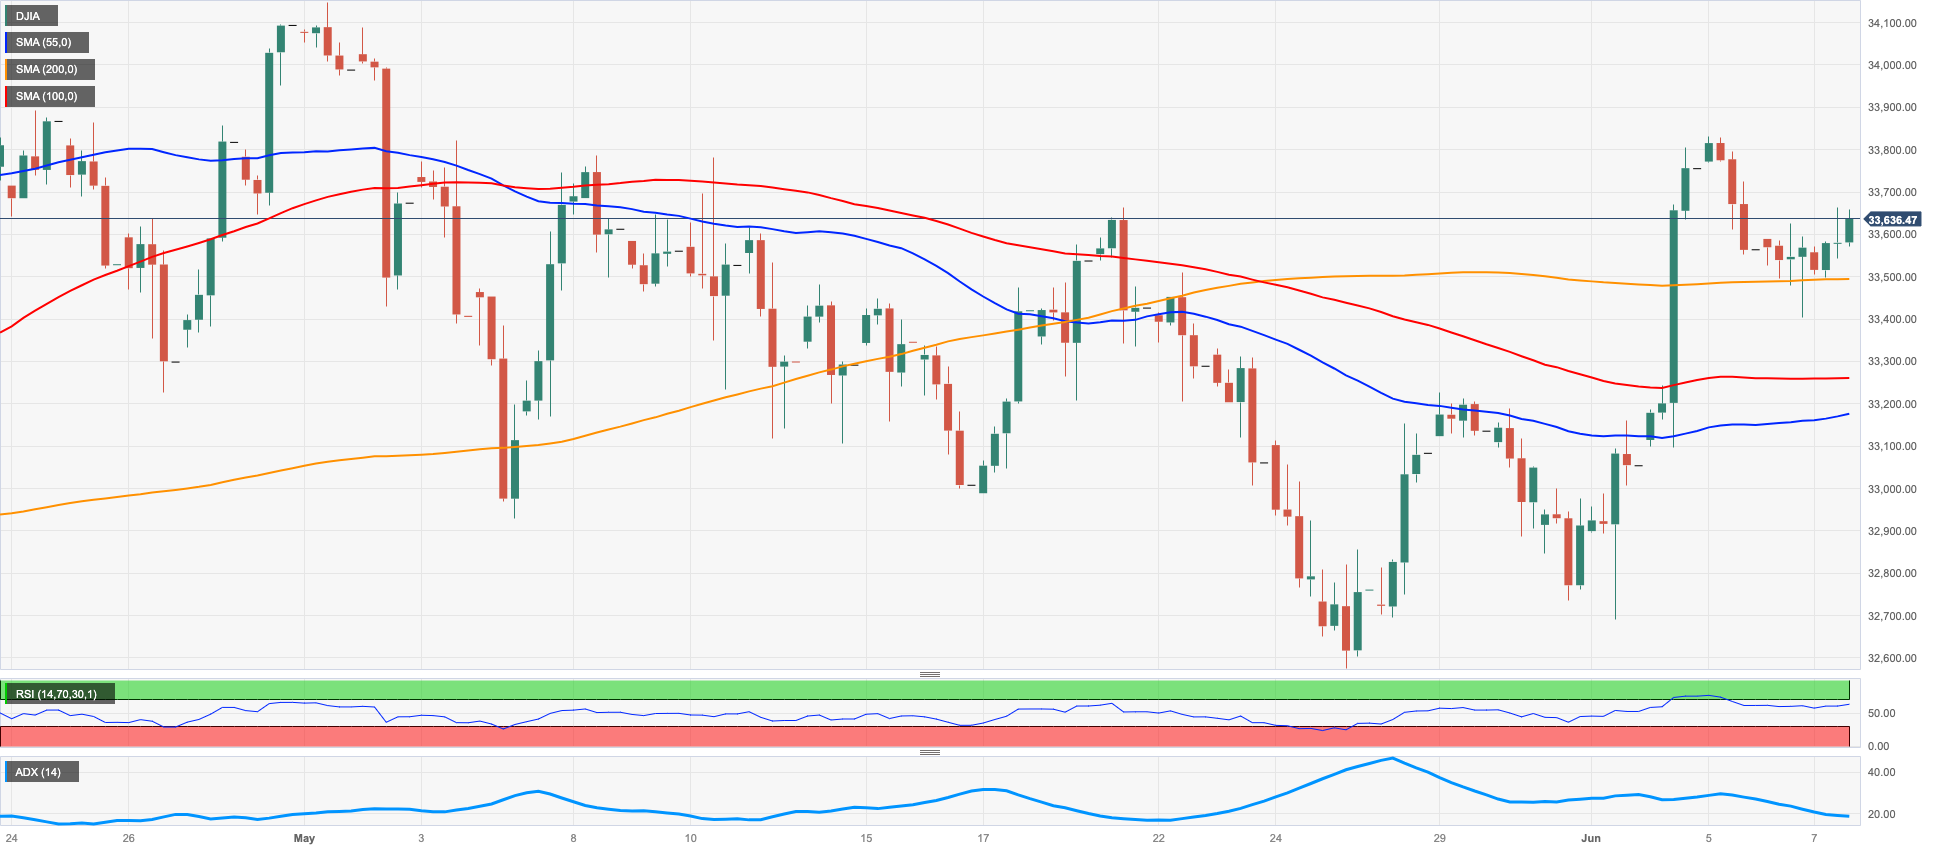
US equities measured by the Dow Jones traded with modest gains and added to Tuesday’s advance on Wednesday.
Indeed, poor Chinese trade data combined with rising prudence ahead of the release of key US inflation figures (June 13) and the upcoming FOMC event (June 14) seem to have sparked a cautious tone among market participants midweek.
All in all, the Dow Jones rose 0.17% to 33630, the S&P500 dropped 0.44% to 4264, and the tech-reference Nasdaq Composite deflated 1.25 % to 13111.
Although the upside momentum in the Dow Jones seems to have weakened, it is expected to remain focused on reaching the May high of 34257 (May 1), followed by the 2023 peak of 34342 (January 13) and the December 2022 top at 34712 (December 13). If it surpasses the latter, the index may then set its sights on the April 2022 high of 35492 (April 21). On the downside, immediate support can be found at the 200-day SMA at 32757, ahead of the May low of 32586 (May 25) and the 2023 low of 31429 (March 15). Further down, the next significant level is the 2022 low at 28660 (October 13). The daily RSI edged higher to the boundaries of 56.
Top Performers: Caterpillar, Goldman Sachs, Chevron
Worst Performers: Salesforce Inc, Microsoft, Visa A
Resistance levels: 33805 34257 34712 (4H chart)
Support levels: 33317 32586 31805 (4H chart)
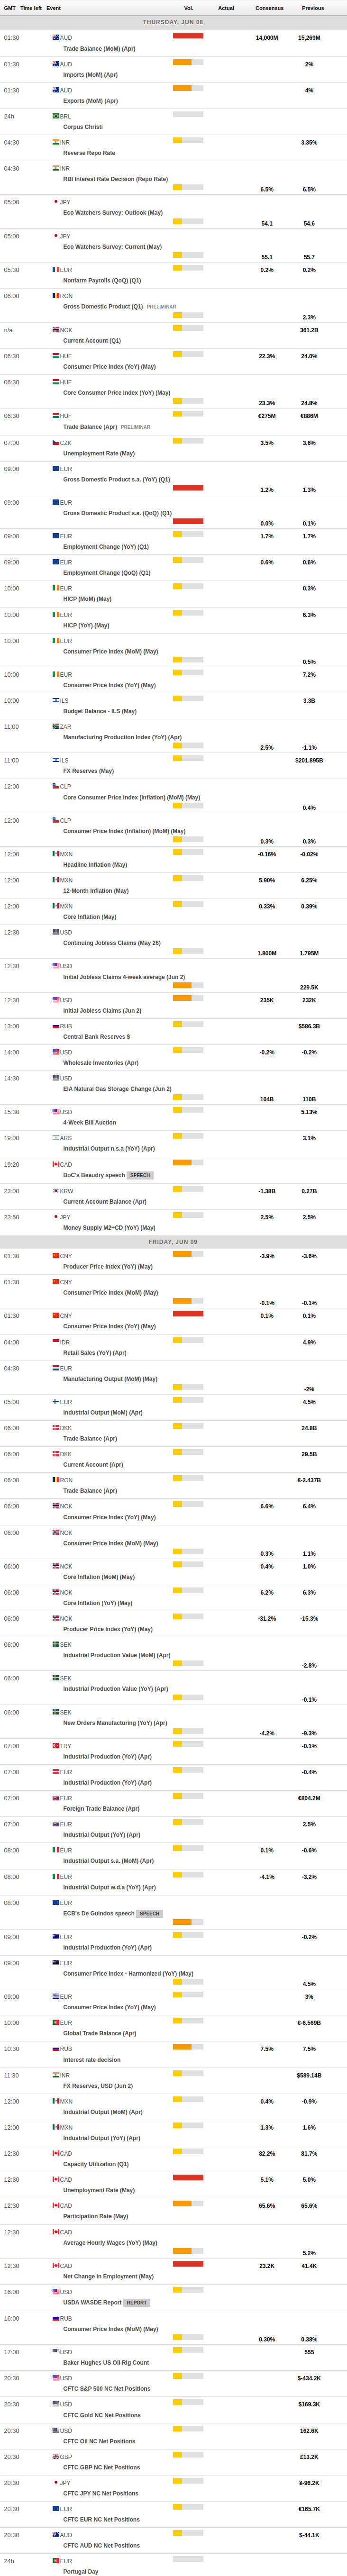
MACROECONOMIC EVENTS
All Information & Updates provided by:

All information relating to the financial markets available on this page has been prepared and issued by FXStreet (Forexstreet SL, Spain, Reg: B62498233) on the basis of publicly available information and all information believed to be reliable and does not conflict with Kuwaiti local laws, and all necessary care has been taken to before the company to ensure that the facts mentioned are correct from the source.
NCM Investment nor any of its directors or employees shall in any way be held responsible for the contents of this news, and the information contained on this page is intended only to provide clients with publicly available information and should not be construed as investment advice, report or analysis and/or constitute an offer or invitation to buy or sell financial instruments of any kind.
RISK WARNING: Forex and CFDs are highly risky leveraged products, as losses can exceed deposits. Please ensure you understand all the risks and take independent advice if necessary. NCM will segregate the clients based on the criteria of the regulator and its bylaws. NCM does not provide any advisory service; the material published does not constitute advice or a recommendation for a transaction in any financial instrument. NCM accepts no responsibility for any use of the content presented and any consequences of that use. Anyone acting on the information provided does so at their own risk.