
- Contact Us:
-

-

-

-


Daily Market Updates
09 Jun 2023
USDJPY
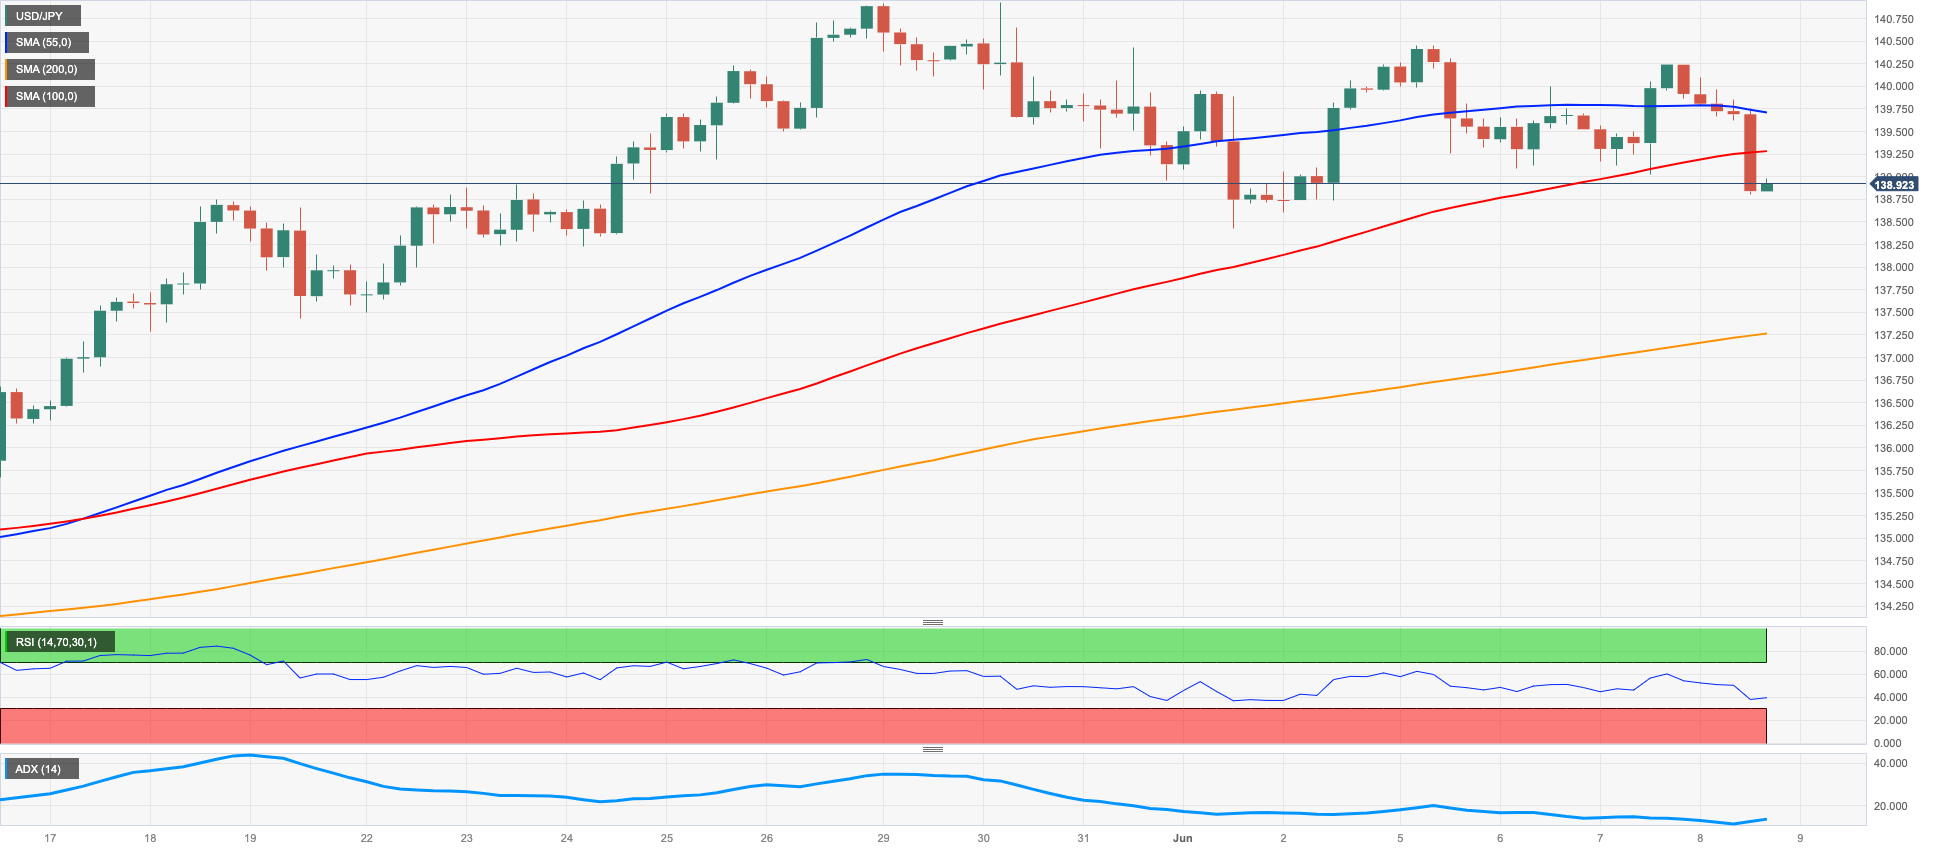
The combination of the sharp decline in the dollar and the U-turn in US yields dragged USD/JPY to fresh weekly lows in the sub-139.00 region on Thursday.
Indeed, the persistently better tone in the risk-associated universe and steady expectations of an impasse in the Fed’s tightening cycle at its meeting on June 14 put the buck under extra pressure and sponsored a pronounced drop in the USD Index (DXY).
Also collaborating with the bid bias in the Japanese yen, the final GDP Grow Rate saw the economy expand 0.7% inter-quarter in Q1 and 2.7% YoY. Further data showed Bank Lending expanded 3.4% in the year to May and Foreign Bond Investment rose ¥524.7B in the week to June 3.
In the bond market, the JGB 10-year yields rose tepidly and approached the 0.45% region, up for the second day in a row.
If the USD/JPY goes below the June low of 138.42 (June 1), the key 200-day SMA of 137.28 would be the next support level. If the pair falls further, it will come into touch with the temporary 55-day and 100-day SMAs, which are at 135.52 and 134.38, respectively. Any additional drop might lead to a retest of the weekly low of 133.01 (April 26), with minor support levels at 132.01 (April 13) and the April low of 130.62 (April 5). Down from here emerges the March low of 129.63 (March 24) and the February low of 128.08 (February 8). The RSI for the day broke below the 56 yardstick
Resistance levels: 140.45 140.93 141.1 (4H chart)
Support levels: 138.80 138.42 138.24 (4H chart)
GBPUSD
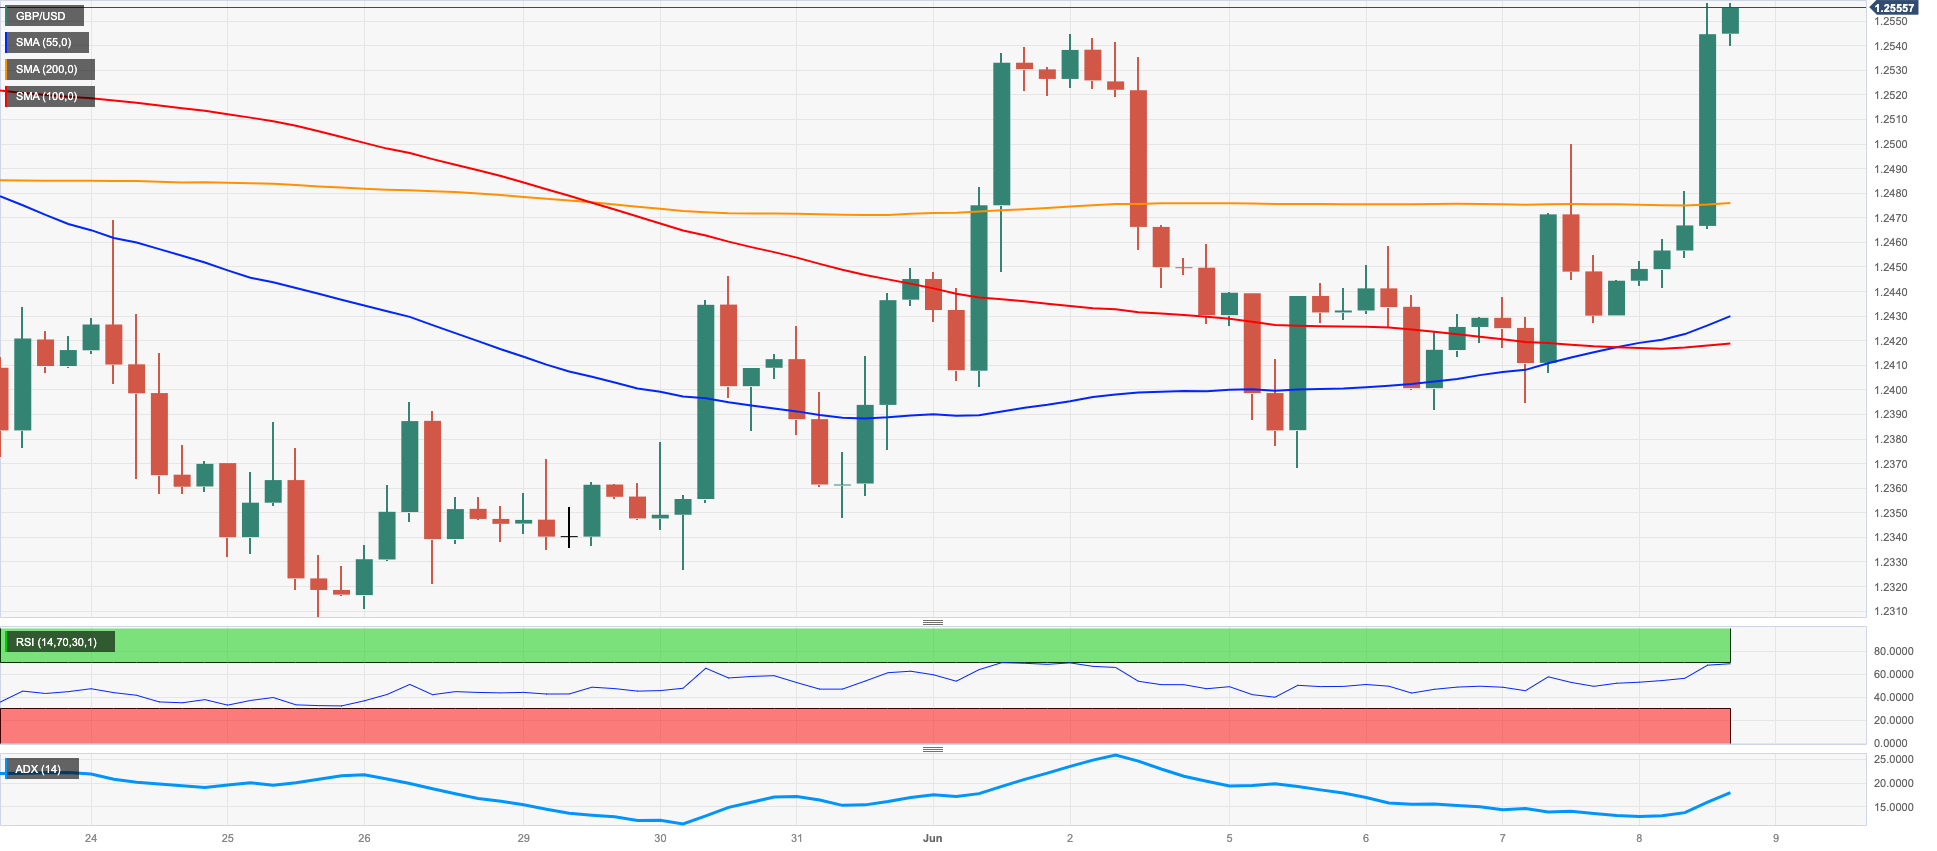
The strong recovery in the risk complex lent extra wings to the Sterling and lifted GBP/USD to weekly highs well north of 1.2500 the figure on Thursday.
Indeed, Cable added to Wednesday’s gains and trespassed the 1.2500 hurdle, as the sell-off in the greenback gathered extra impulse, sending the USD Index (DXY) to the mid-103.00s amidst the equally marked decline in US yields across the curve.
In the UK, second-tier releases saw the RICS House Price Balance drop 30% in May.
GBP/USD traded at shouting distance from the June high of 1.2544 (June 2), which is a crucial barrier that must be overcome before the pair can reach its 2023 peak at 1.2679 (May 10). Further north emerges the 200-week SMA at 1.2868 and the psychological level of 1.3000. Having said that, the immediate contention is the May low of 1.2308 (May 25), which is supported by the transitory 100-day SMA at 1.2305 and precedes the April low of 1.2274 (April 3). If the pair continues to trend downwards, the next crucial support level is the 200-day SMA at 1.2008, which is just above the 2023 low of 1.1802 recorded on March 8. The daily chart indicates that the RSI surpassed the 59 barrier.
Resistance levels: 1.2557 1.2679 1.2772 (4H chart)
Support levels: 1.2368 1.2347 1.2308 (4H chart)
AUDUSD
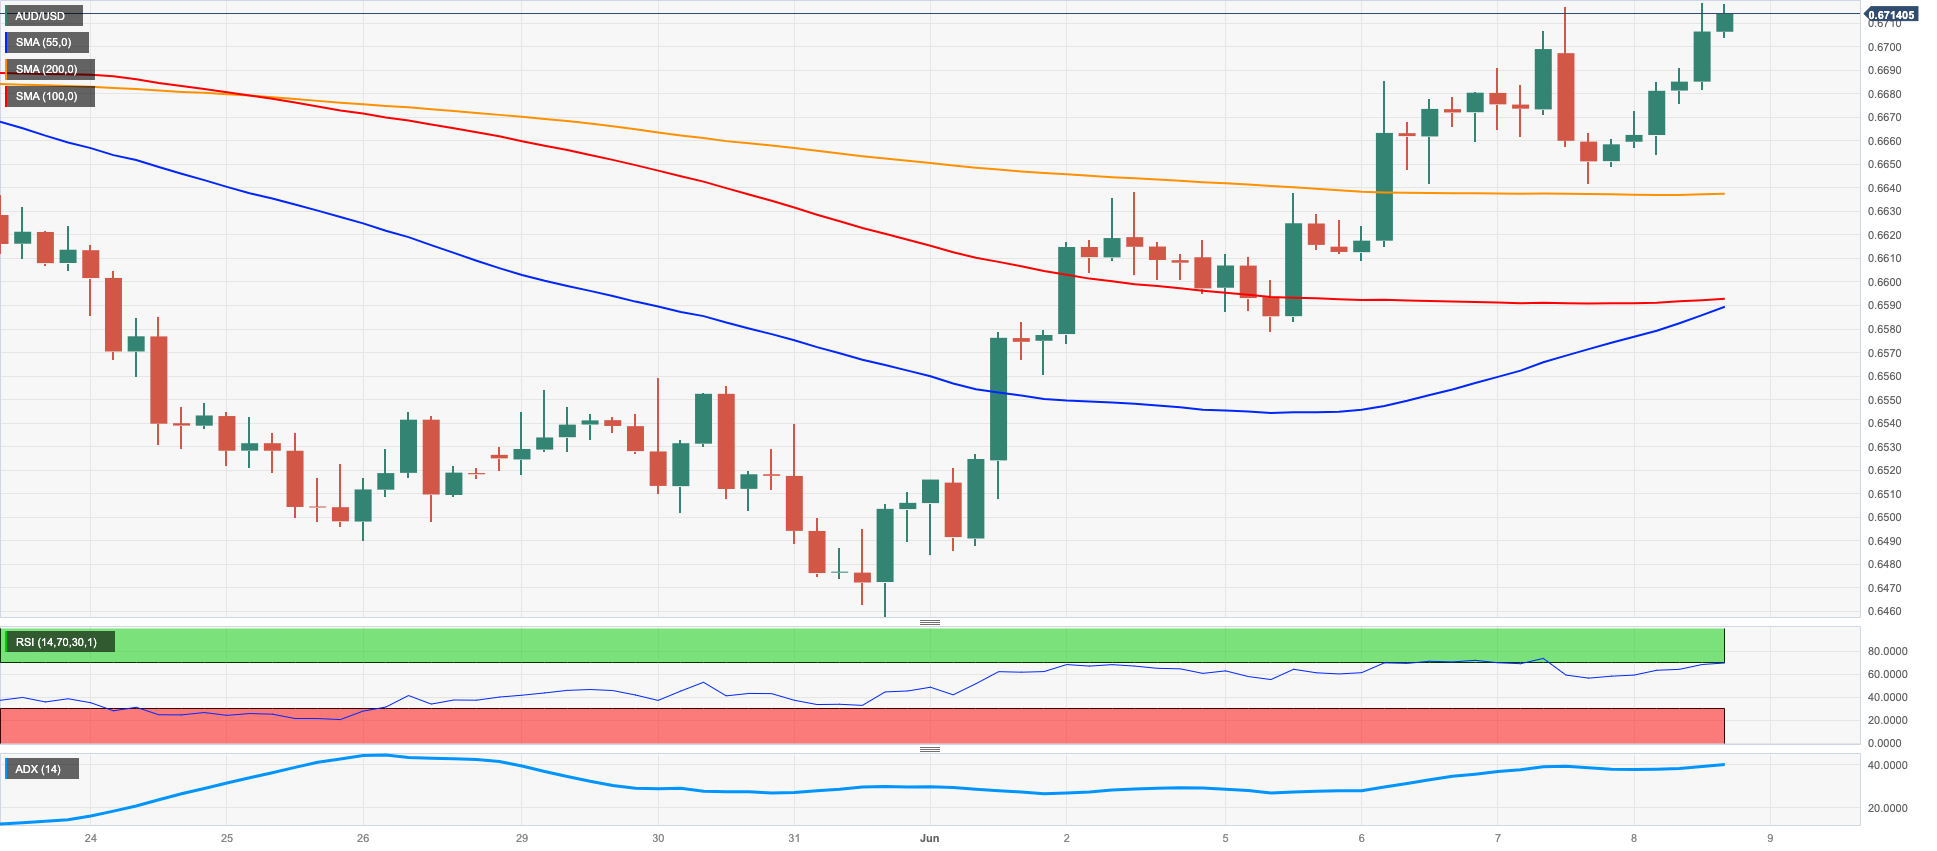
AUD/USD resumed the upside and poked with 4-week highs north of the 0.6700 barrier on Thursday, setting aside at the same time Wednesday’s small hiccup.
Further gains in the Aussie dollar came in response to the decided move lower in the greenback amidst further improvement in risky assets, while the broad-based positive session in the commodity galaxy also lent oxygen to the pair’s upbeat mood.
In Oz, the trade surplus shrank to A$11.158B in April, with Exports down 5% MoM and Imports up 2% MoM.
If the rally continues, AUD /USD should test the temporary 100-day line SMA at 0.6741 ahead of the May high of 0.6818 (May 10) and the psychological mark of 0.7000, followed by the weekly top of 0.7029 (February 14) and the 2023 peak of 0.7157 (February 2). On the flip side, if the pair falls below the 2023 low of 0.6458 (May 31), losses could retrace to the weekly low of 0.6386 (November 10) and then to the November 2022 low of 0.6272 (November 3). The daily chart's RSI advanced beyond the 59 level.
Resistance levels: 0.6718 0.6818 0.6920 (4H chart)
Support levels: 0.6639 0.6579 0.6458 (4H chart)
GOLD
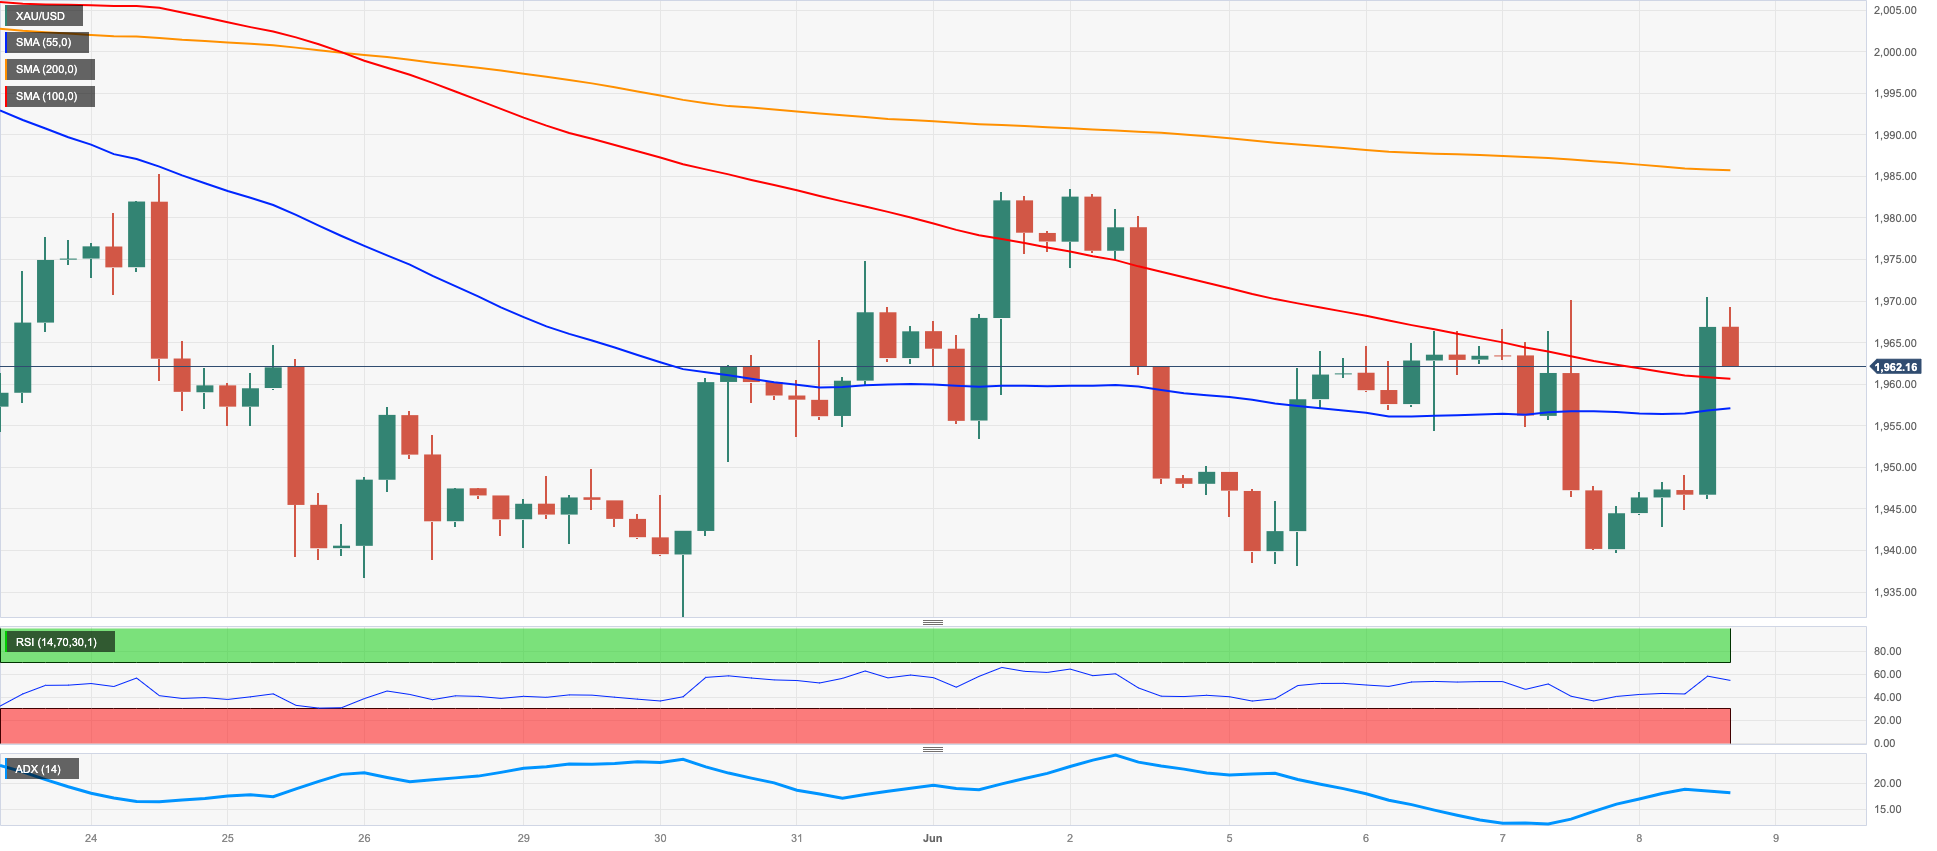
Prices of the ounce troy of gold quickly reversed Wednesday’s noticeable decline and revisited weekly tops in the $1970 region on Thursday, where some initial resistance seems to have resurfaced.
The sharp retracement in the greenback in combination with the strong loss of momentum in US yields all sponsored the equally robust bounce in the precious metal after bottoming out near $1940, an area also coincident with the interim 100-day SMA.
In the meantime, bullion is expected to keep tracking speculation around the potential next moves on rates by the Federal Reserve. On this, investors continue to favour a "skip" at the June gathering, whereas a 25 bps rate raise appears to be the most likely scenario according to the FedWatch Tool by CME Group.
Further recovery in gold could challenge the June high at $1983 (June 2), preceding the 55-day SMA at $1988 and the significant milestone of $2000. In the event that the upward momentum continues, there are no prominent resistance levels until the 2023 at the 2023 peak of $2067 (May 4), followed by the top of 2022 at $2070 (March 8) and the all-time record of $2075 (August 7, 2020). Just the opposite, there is immediate contention at the May low of $1932 (May 30), seconded by a potential test of the 200-day SMA at $1839 and the 2023 low at $1804 (February 28).
Resistance levels: $1970 $1986 $2022 (4H chart)
Support levels: $1932 $1885 $1809 (4H chart)
CRUDE WTI
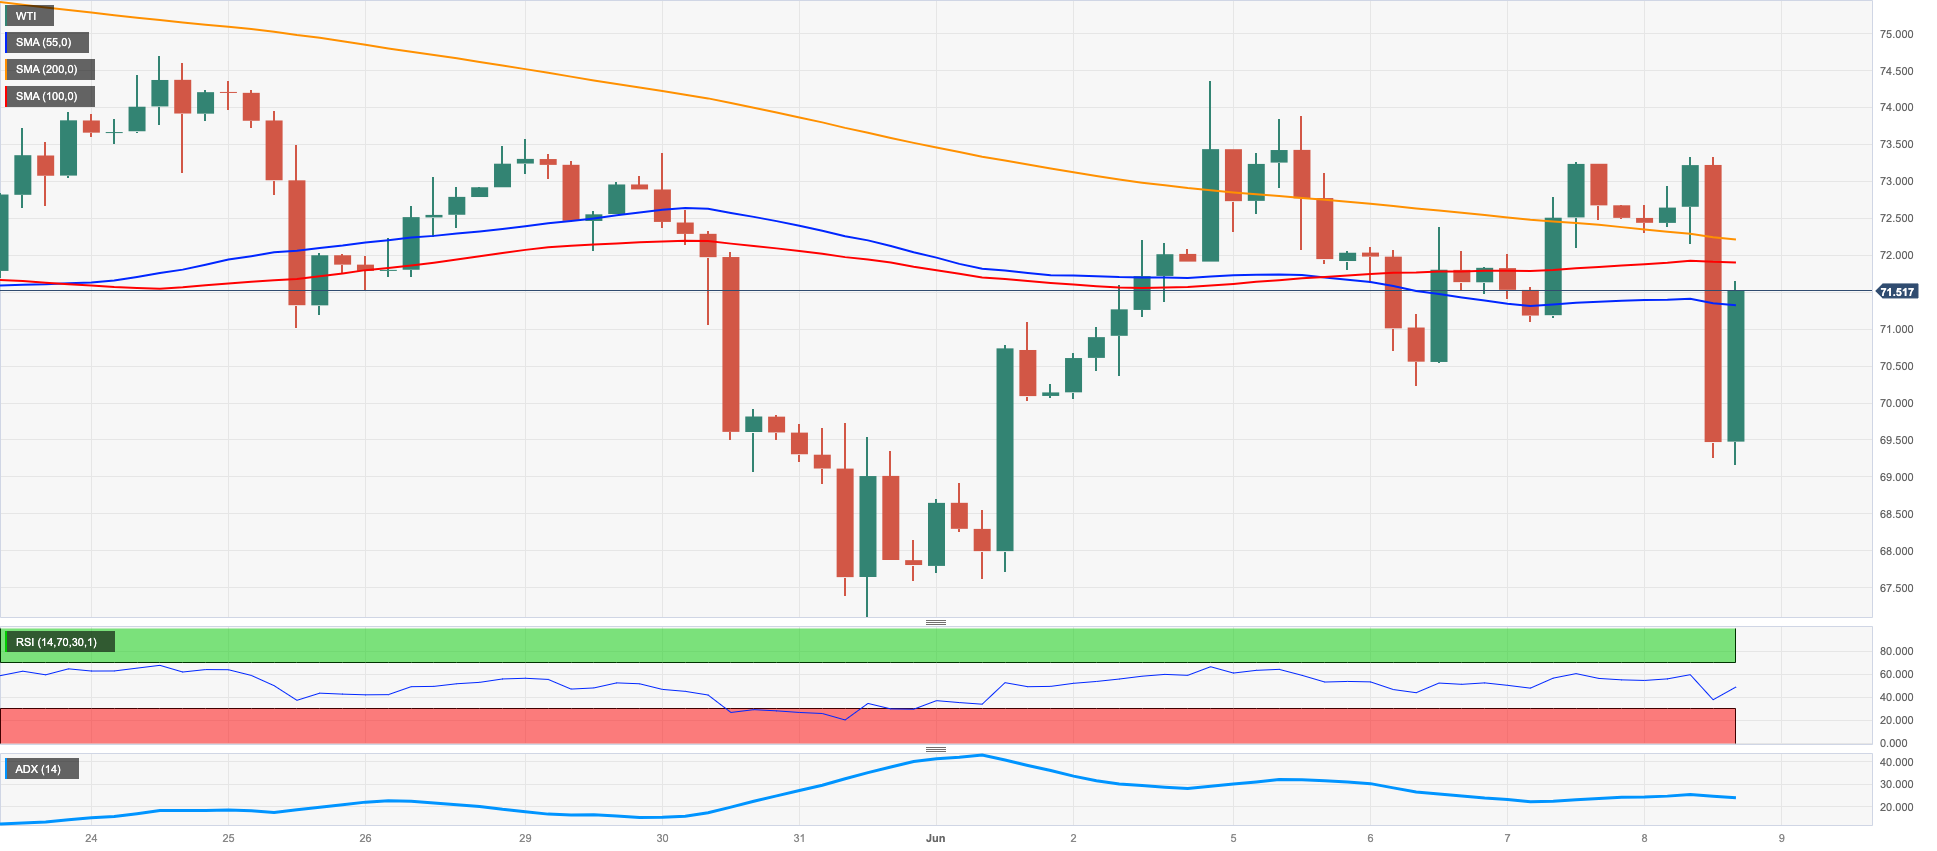
WTI prices saw its decline gather extra steam and drop to multi-session lows near the $69.00 mark per barrel on Thursday. Prices, however, managed to rebound soon afterwards and regain the $71.00 zone and above.
The marked pullback in the commodity came in response to renewed demand concerns following a larger-than-estimated build in gasoline stockpiles during last week and news citing a US-Iran deal.
Under the agreement, Iran would pledge to stopping its +60% uranium enrichment efforts while continuing its collaboration with the International Atomic Energy Agency (IAEA) for monitoring and verification of its nuclear programme. In exchange, Tehran would be permitted to export up to a million barrels of oil per day and receive access to its income and other blocked cash overseas, according to the sources.
The bearish news overshadowed the recent bullish move in response to the oil output reduction announced by Saudi Arabia at the OPEC+ meeting on June 4 and the optimism surrounding the anticipated Fed pause next week.
Emerging as the next upside target for WTI is the June peak at $74.92 (June 5), just ahead of the interim 100-day SMA at $75.35 and the important 200-day SMA at $78.96. Further up comes the weekly high of $79.14 (April 24) prior to the key barrier of $80.00 per barrel and the 2023 top at $83.49 (April 12) followed by the November 2022 high of $93.73 (November 7). However, in terms of immediate downside obstacles, attention should be given to the weekly low of $67.08 (May 31), followed by the 2023 low at $63.61 (May 4). Providing support to this level is the December 2021 low of $62.46 (December 2) before the significant threshold of $60.00 per barrel.
Resistance levels: $73.24 $74.92 $76.89 (4H chart)
Support levels: $69.08 $67.08 $63.61 (4H chart)
GER40
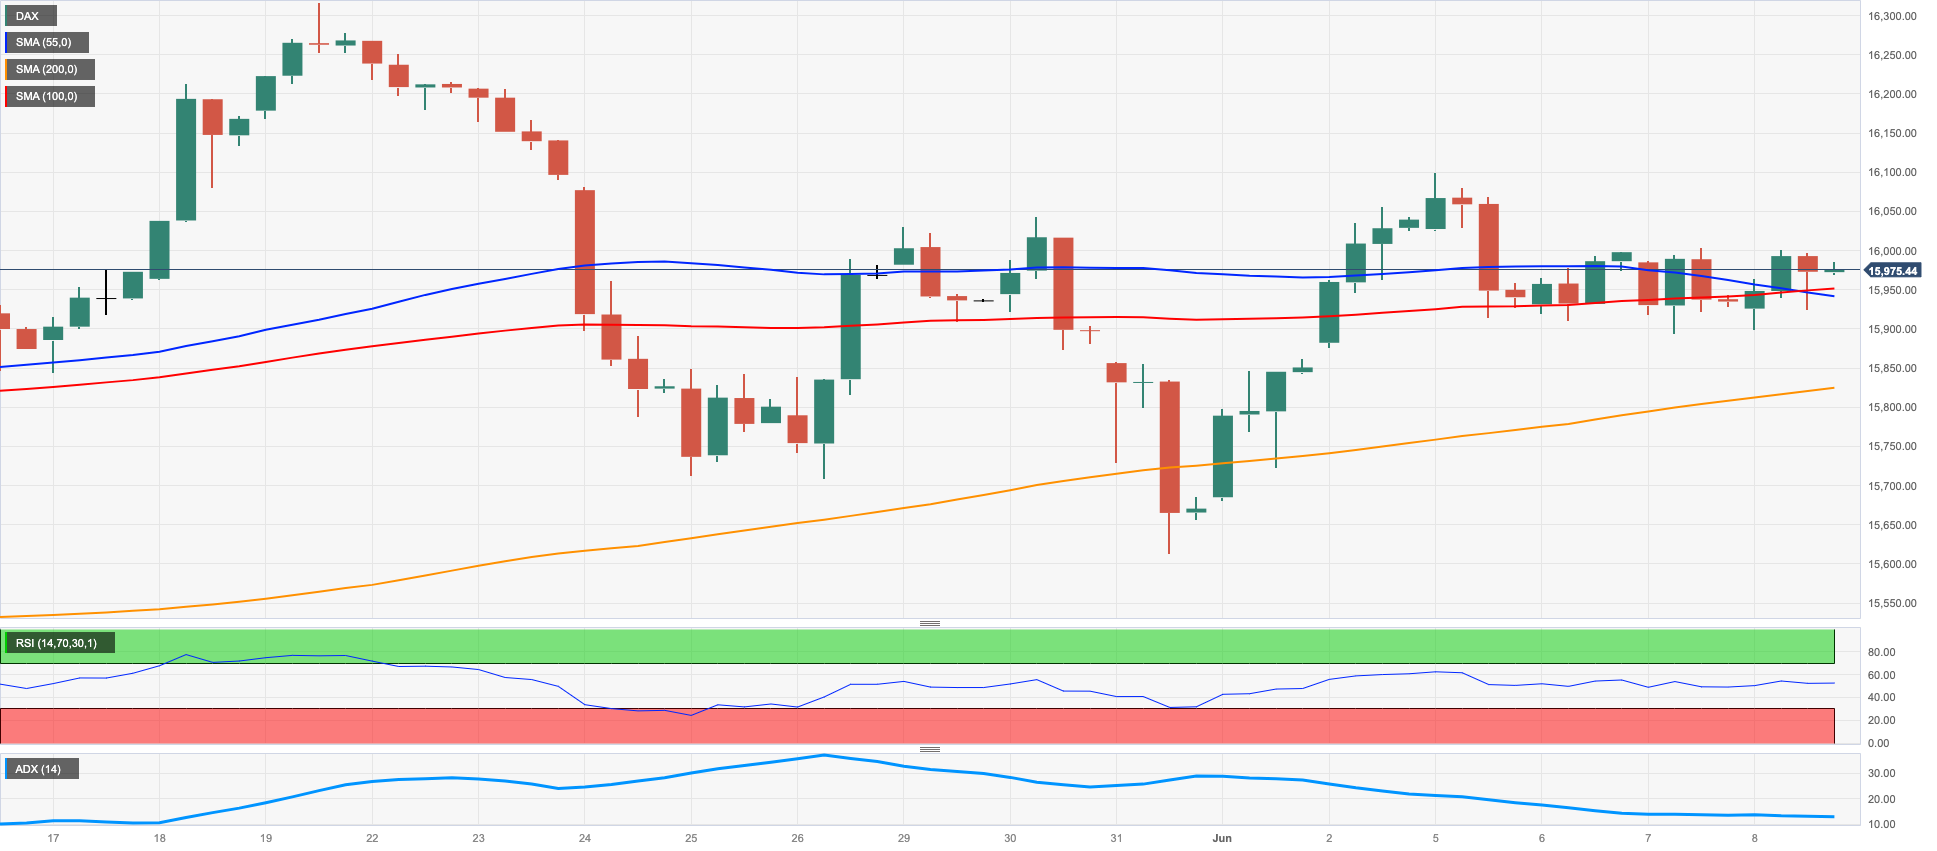
Germany’s benchmark index DAX40 advanced modestly and closed within shouting distance of the key barrier at the 16000 mark on Thursday.
The strong bias towards the risk complex propped up the buying interest in most of the stock markets on the old continent on Thursday, with the exception of the UK’s FTSE100 and Spain’s IBEX35.
In the meantime, the most likely pause by the Fed at its meeting on June 14 continued to bolster the appetite for risky assets, while a 25 bps rate hike by the ECB also later in the month already appears fully anticipated by investors.
In line with its American peers, yields on the German 10-year bund faded part of their recent strength and revisited the 2.40% zone.
The DAX40 encounters its next notable resistance level at the high reached in June, which is 16114 (June 5), preceding the all-time peak of 16331 (May 19). By contrast, the intermediary 55-day SMA at 15770 serves as the initial level of contention, followed by the May low of 15629 (May 31) and the transitory 100-day SMA at 15552. Moving further downwards, the April low of 15482 (April 5) comes into play, followed by weak support at 14809 (March 24) and the significant 200-day SMA at 14540. These are followed by the March low of 14458 (March 20). The daily RSI revisited the 53 region.
Best Performers: Daimler Truck Holding, Heidelbergcement, Continental AG
Worst Performers: Sartorius AG VZO, Siemens Energy AG, Symrise AG
Resistance levels: 16114 16331 17000? (4H chart)
Support levels: 15677 15629 15482 (4H chart)
NASDAQ
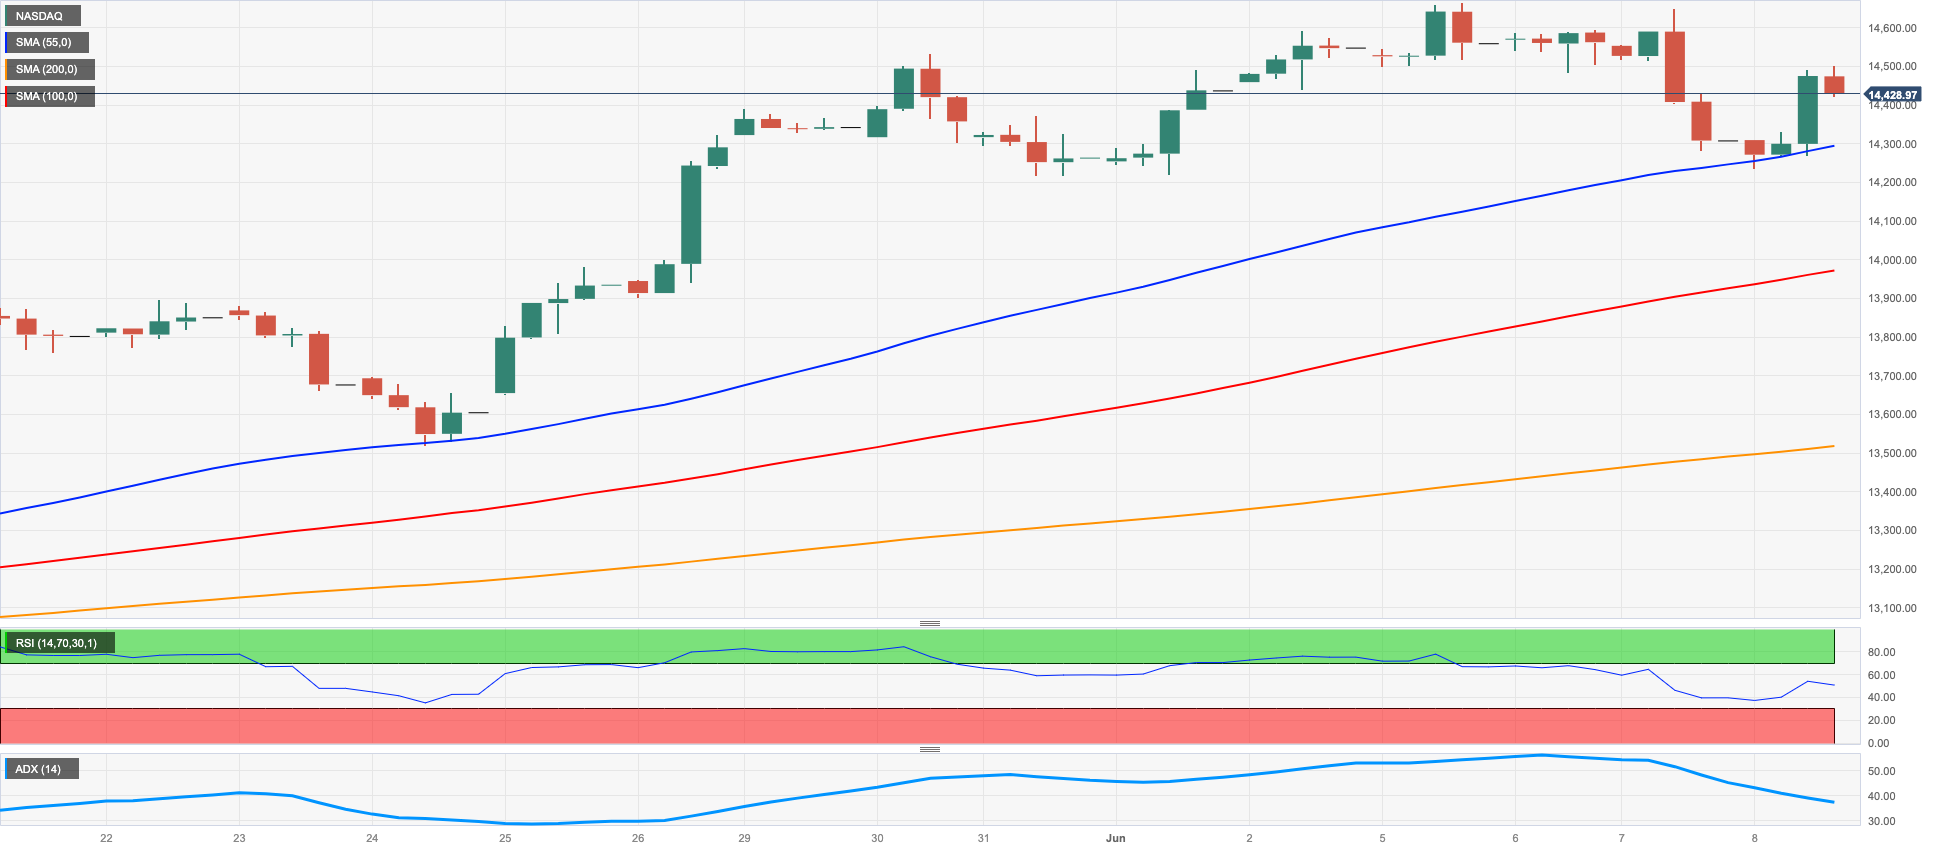
The Nasdaq 100 resumed the upside and recouped part of Wednesday’s losses, retesting at the same time the 14500 region.
Lower US yields, the offered tone in the greenback, and the conviction of an impasse in the Fed’s tightening cycle as soon as at the June meeting all contributed to the strong recovery of the US tech sector on Thursday.
If the Nasdaq 100 index crosses the 2023 high of 14662 (June 5), there is a chance that it will continue to rise towards the March 2022 top of 15265 (March 29). The next big level to keep an eye on is 16000. On the other hand, the weekly low of 13520 (May 24) emerges as the immediate support ahead of the transitory 55-day SMA at 13362 and the May low of 12938 (May 4). Several support levels could be evaluated before hitting the 2023 bottom at 10696 (January 6), including the April low of 12724 (April 25), the 200-day SMA at 12177, the March low of 11695 (on March 13), and the weekly lows of 11550 (on January 25) and 11251 (on January 26). The daily RSI surpassed the 67 level.
Top Gainers: Warner Bros Discovery Inc, PDD Holdings DRC, Adobe
Top Losers: GE HealthCare, Micron, Moderna
Resistance levels: 14662 15161 15265 (4H chart)
Support levels: 14216 13520 12938 (4H chart)
DOW JONES
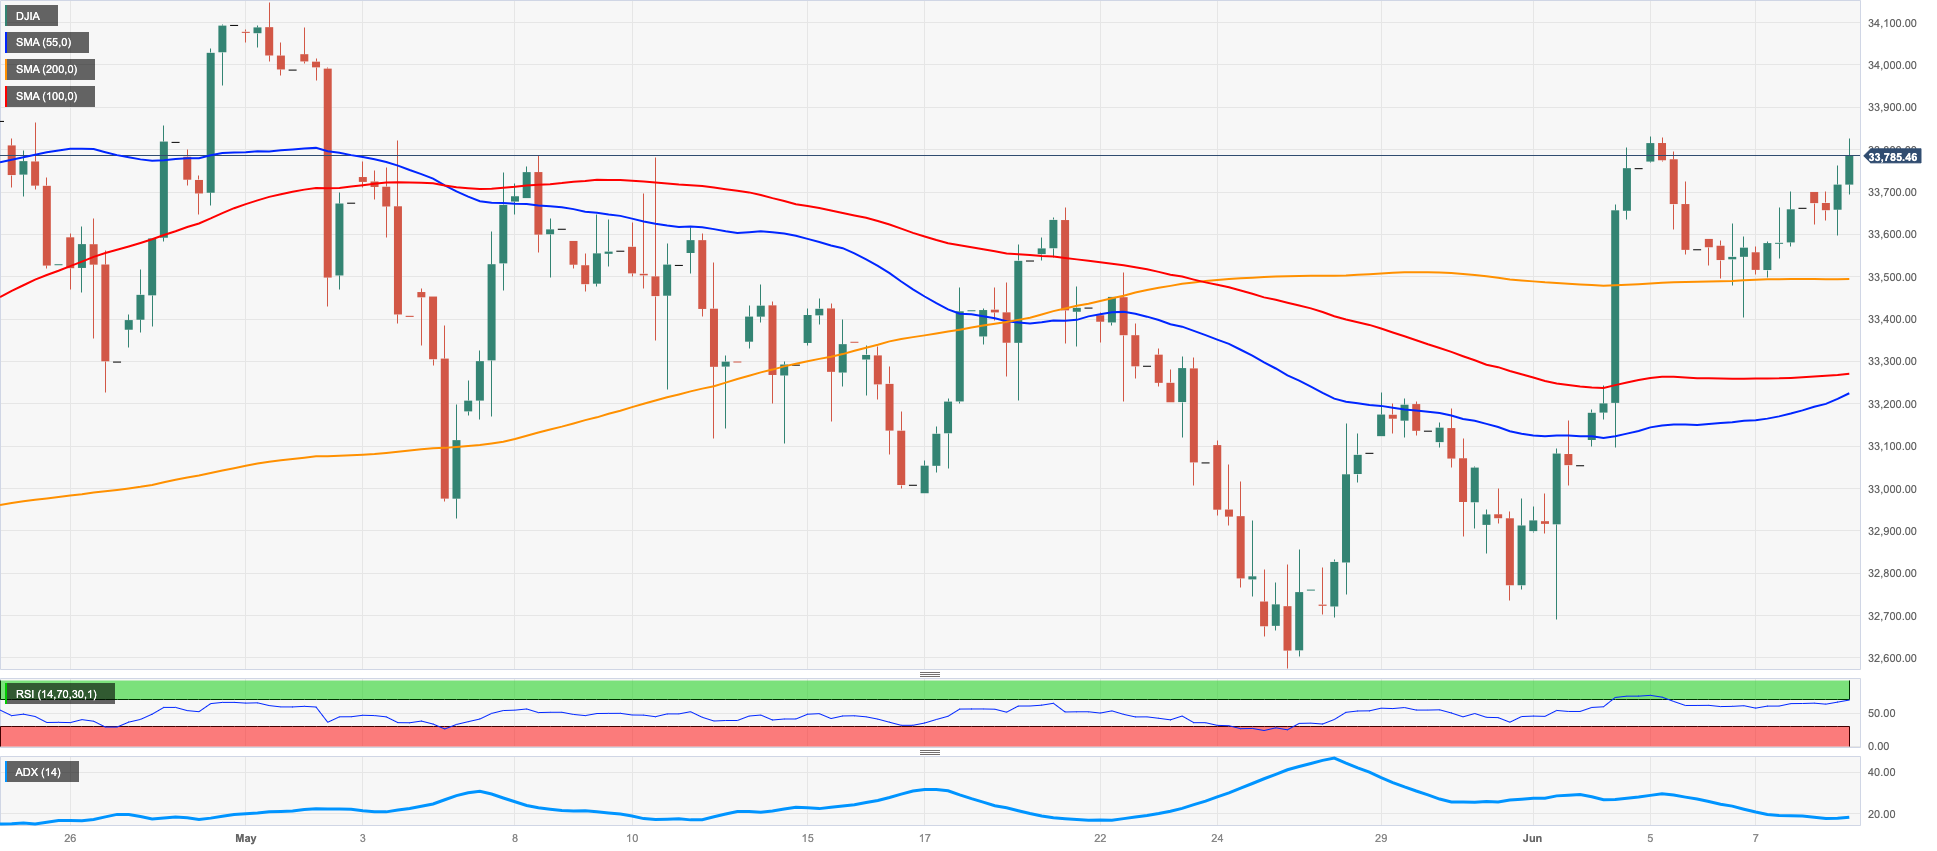
Stocks gauged by the Dow Jones added to the weekly recovery and approached the key resistance area around 33800 on Thursday.
The index picked up pace in response to a firmer conviction of a Fed pause in its normalization process in June, a view that was reinforced further after weekly claims rose more than expected last week.
Extra support for US equities came from the weaker dollar and the downward bias in US yields across the curve.
Overall, the Dow Jones advanced 0.39% to 33795, the S&P500 rose 0.35% to 4282, and the tech-benchmark Nasdaq Composite gained 0.61% to 13183.
The Dow Jones' upward momentum is expected to remain focused on its May high of 34257 (May 1), followed by the 2023 peak of 34342 (January 13) and the December 2022 top at 34712 (December 13). If it manages to surpass the latter, the index may then set its sights even higher on the April 2022 high of 35492 (April 21). On the downside, immediate support levels are located at the 200-day SMA at 32760, ahead of the May low of 32586 (May 25) and the 2023 low of 31429 (March 15). South from here, the next significant level of support is the 2022 low at 28660 (October 13). The everyday RSI edged higher beyond the 58 mark.
Top Performers: Boeing, Salesforce Inc, Merck&Co
Worst Performers: Dow, Chevron, 3M
Resistance levels: 33805 34257 34712 (4H chart)
Support levels: 33315 32586 31805 (4H chart)
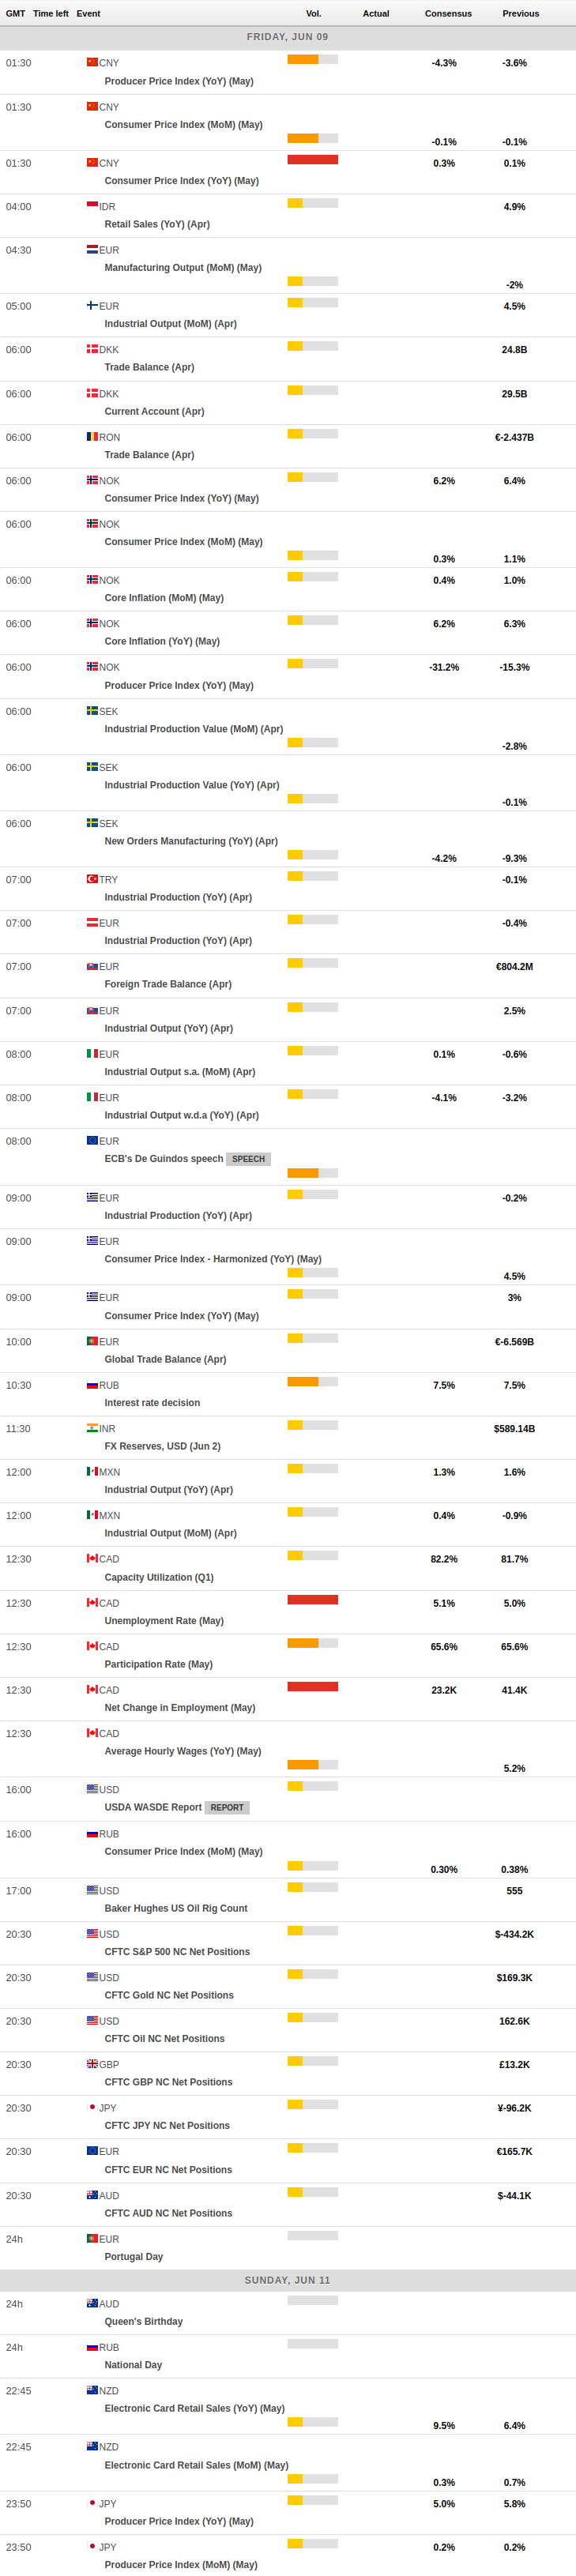
MACROECONOMIC EVENTS
All Information & Updates provided by:

All information relating to the financial markets available on this page has been prepared and issued by FXStreet (Forexstreet SL, Spain, Reg: B62498233) on the basis of publicly available information and all information believed to be reliable and does not conflict with Kuwaiti local laws, and all necessary care has been taken to before the company to ensure that the facts mentioned are correct from the source.
NCM Investment nor any of its directors or employees shall in any way be held responsible for the contents of this news, and the information contained on this page is intended only to provide clients with publicly available information and should not be construed as investment advice, report or analysis and/or constitute an offer or invitation to buy or sell financial instruments of any kind.
RISK WARNING: Forex and CFDs are highly risky leveraged products, as losses can exceed deposits. Please ensure you understand all the risks and take independent advice if necessary. NCM will segregate the clients based on the criteria of the regulator and its bylaws. NCM does not provide any advisory service; the material published does not constitute advice or a recommendation for a transaction in any financial instrument. NCM accepts no responsibility for any use of the content presented and any consequences of that use. Anyone acting on the information provided does so at their own risk.