
- Contact Us:
-

-

-

-


Daily Market Updates
12 Jun 2023
USDJPY
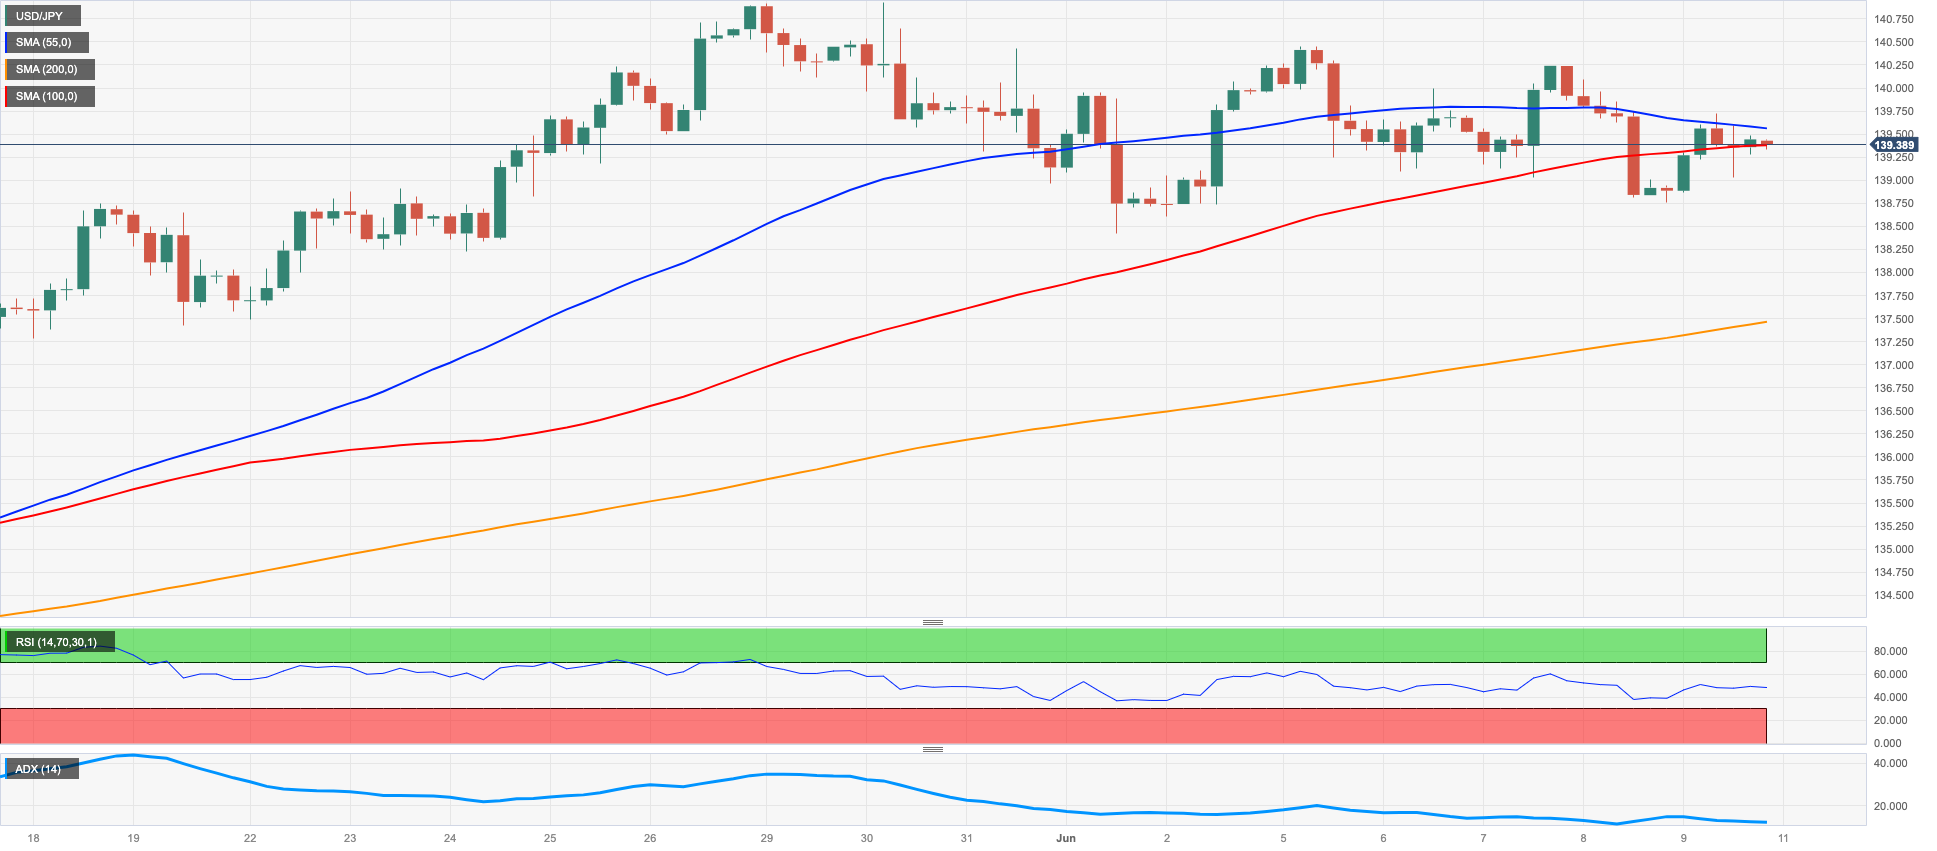
USD/JPY extended the choppy activity seen so far this week after Friday’s advance to the 139.70 region.
Indeed, gains in spot came against the backdrop of the recovery in the greenback and the rebound in US yields across the curve, while JGB 10-year yields eased marginally following two daily advances in a row.
The extra depreciation of the Japanese currency further reinforced the upside in the pair after the BoJ practically ruled out changes to the Yield Curve Control (YCC) in June.
There were no data releases scheduled in the Japanese calendar at the end of the week.
If USD/JPY breaks above the current consolidative theme, it is expected to challenge the 2023 high at 140.93 (May 30) ahead of the weekly top of 142.25 (November 21 2022) and the 2022 peak at 151.94 (October 21). Just the opposite, underneath the June low of 138.42 (June 1), the key 200-day SMA of 137.28 would be the following contention level. Down from here comes the impermanent 55-day and 100-day SMAs, at 135.68 and 134.48, respectively. Any extra drop could prompt a retest of the week-by-week low of 133.01 (April 26), with minor support levels at 132.01 (April 13) and the April low of 130.62 (April 5). Down from here arises the March low of 129.63 (March 24) and the February low of 128.08 (February 8). The RSI for the day climbed above the 57 hurdle.
Resistance levels: 140.45 140.93 141.1 (4H chart)
Support levels: 138.75 138.42 137.28 (4H chart)
GBPUSD
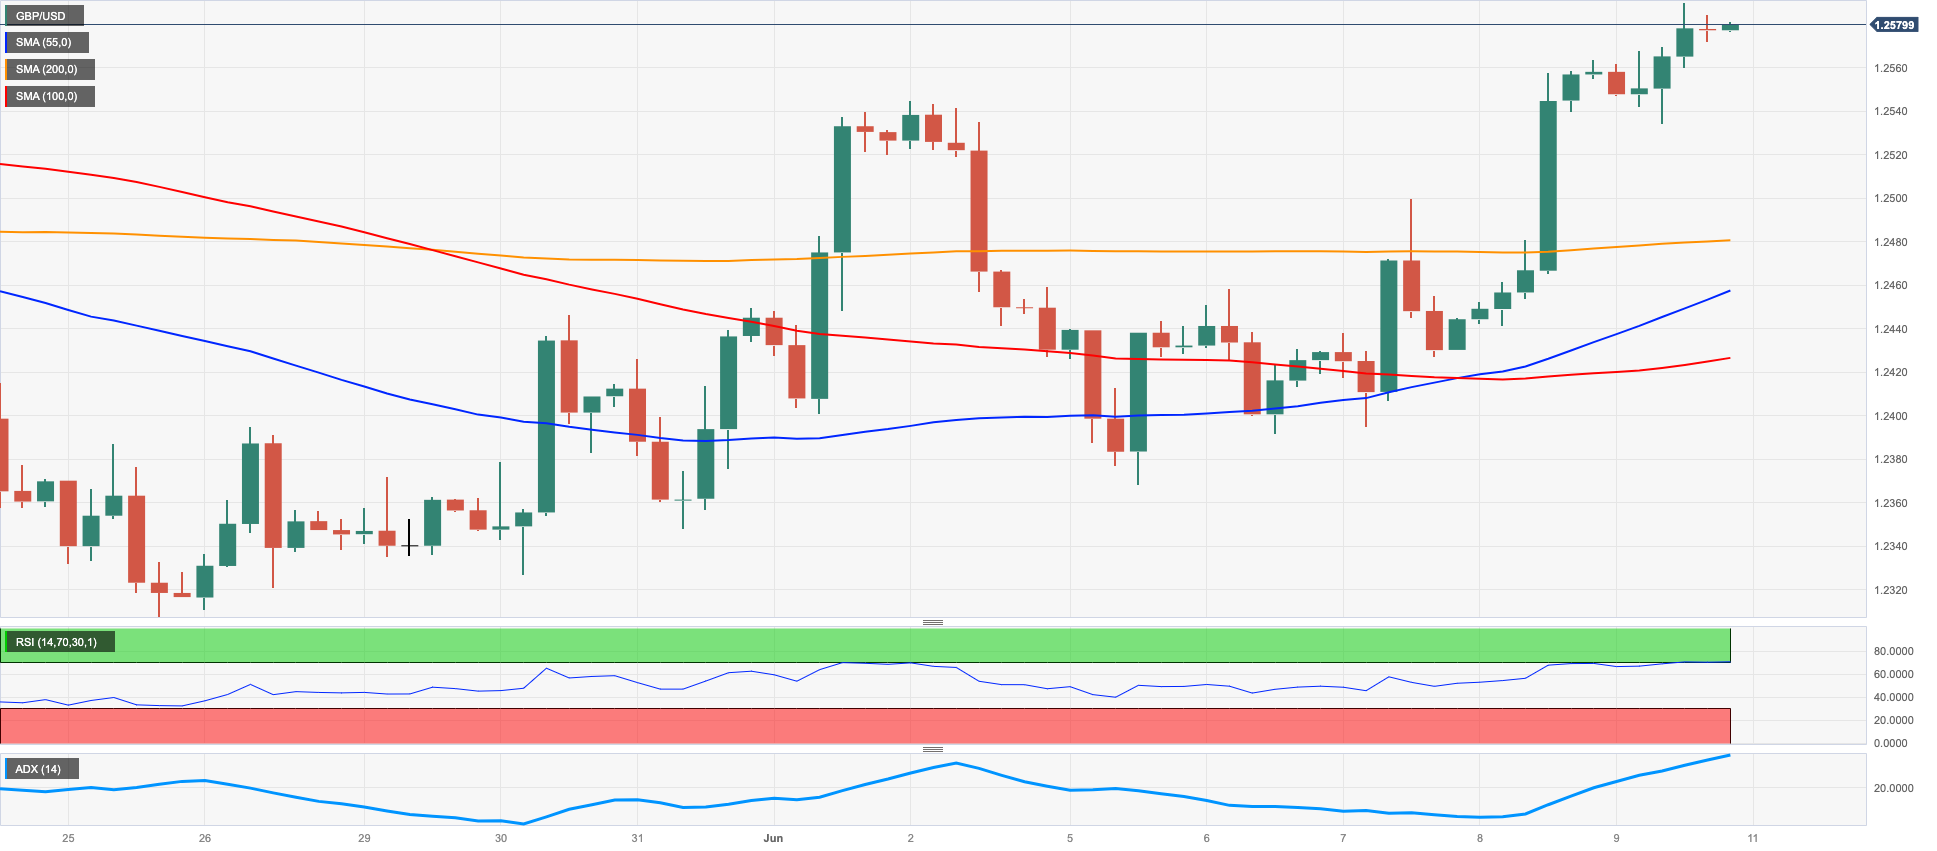
Contrasting with the rest of the risk-linked assets, Sterling added to the weekly recovery and motivated GBP/USD to end the last session of the week in the area just below the key 1.2600 barrier, or 4-week peaks.
Following Thursday’s intense rebound, Cable closed the second consecutive week with gains in a context of fresh buying interest surrounding the greenback amidst market chatter around the most likely pause of the Fed’s tightening cycle at its meeting next week.
In the meantime, the British pound is expected to keep tracking the most likely continuation of the hiking cycle by the BoE in the next few months amidst the current scenario of elevated inflation and steady uncertainty surrounding the growth outlook.
The UK calendar was empty on Friday.
GBP/USD now needs to break above the June high of 1.2590 (June 9) to allow for the continuation of the upside momentum. Up from here emerges the 2023 peak of 1.2679 (May 10) ahead of the 200-week SMA at 1.2868 and the psychological milestone of 1.3000. By contrast, the May low of 1.2308 (May 25) is supported by the transitory 100-day SMA at 1.2306 and predates the April low of 1.2274 (April 3). If the pair continues to fall, the next critical support level is the 200-day SMA at 1.2014, which is slightly above the 2023 low of 1.1802 (March 8). The RSI breached the 60 yardstick.
Resistance levels: 1.2590 1.2679 1.2772 (4H chart)
Support levels: 1.2477 1.2368 1.2347 (4H chart)
AUDUSD
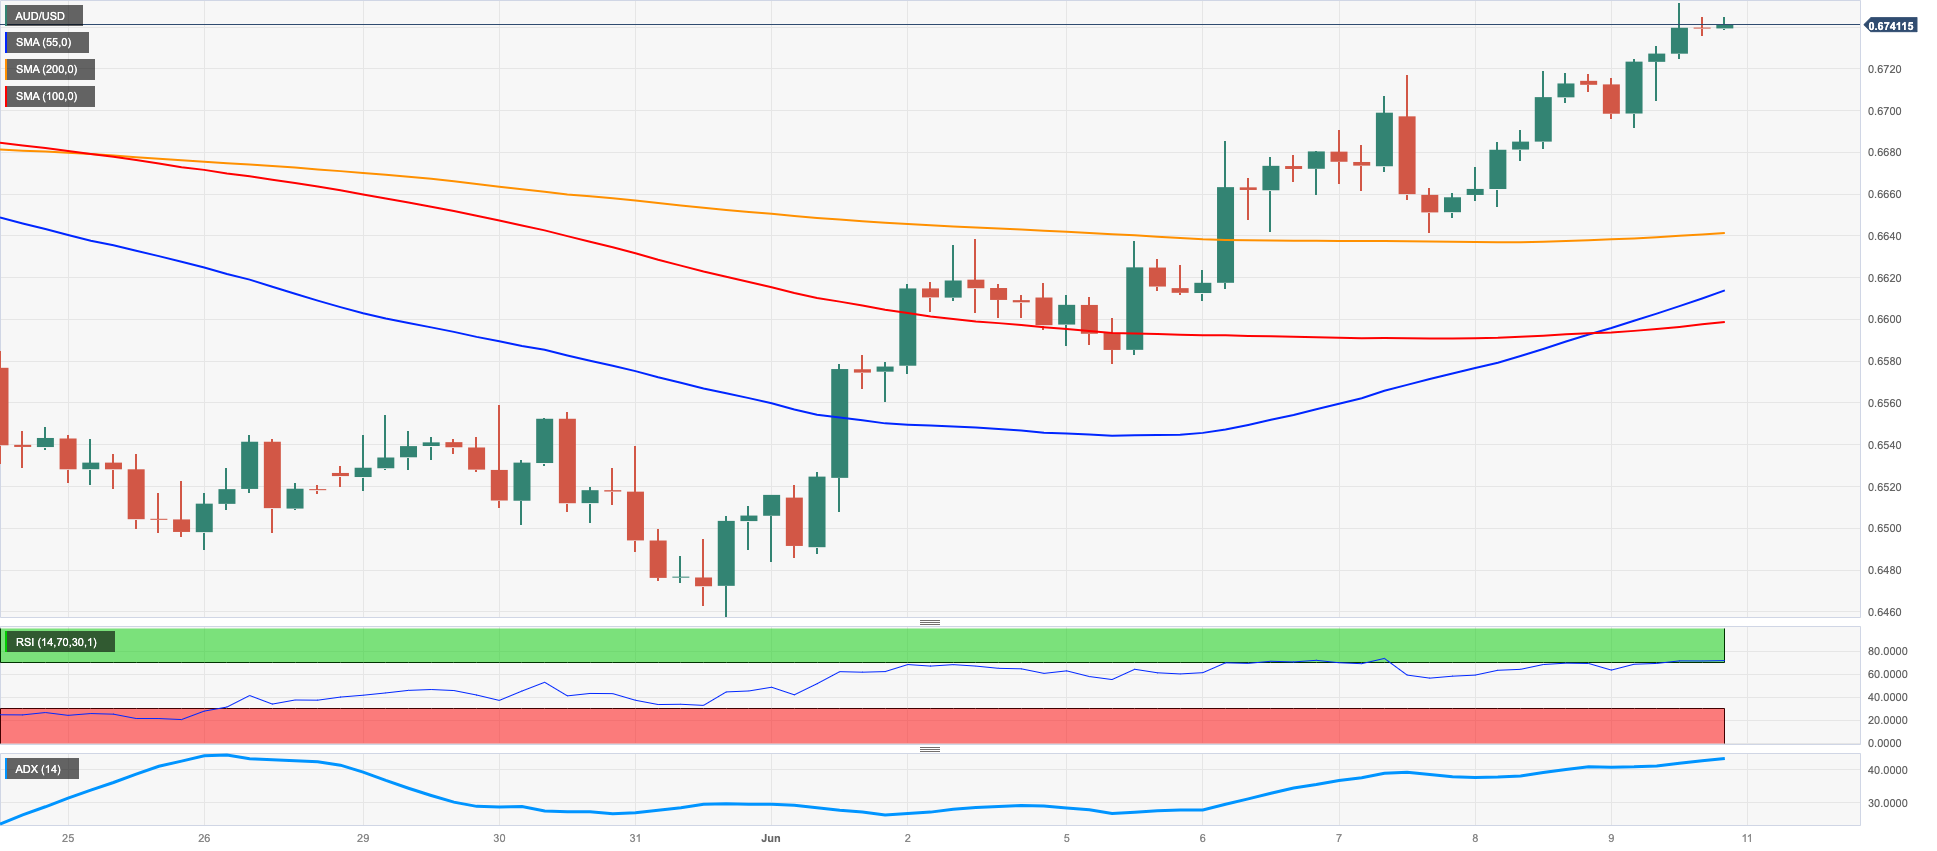
AUD/USD extended the optimism seen in the second half of the week and closed the week well north of 0.6700 the figure for the first time since mid-May.
The strong monthly recovery saw the pair close the second consecutive week with gains despite the marked rebound in the greenback, while further bounces in the price of iron ore also contributed to the weekly uptick.
Also adding to the bid bias in the Aussie dollar was the hawkish tone from the RBA after it raised the OCR by 25 bps to 4.10% at its meeting on June 6.
The Australian docket was empty on Friday.
Should the rally in AUD/USD persist, it is expected to test the May high of 0.6818 (May 10) ahead of the psychological level of 0.7000. Further targets include the weekly top of 0.7029 (February 14) and the 2023 peak of 0.7157 (February 2). On the contrary, a drop below the 2023 low of 0.6458 (May 31), it could expose a deeper pullback to the weekly low of 0.6386 (November 10 2022) and then to the November 2022 low of 0.6272 (November 3). The daily RSI climbed further and surpassed the 62 barrier.
Resistance levels: 0.6750 0.6818 0.6920 (4H chart)
Support levels: 0.6640 0.6579 0.6458 (4H chart)
GOLD
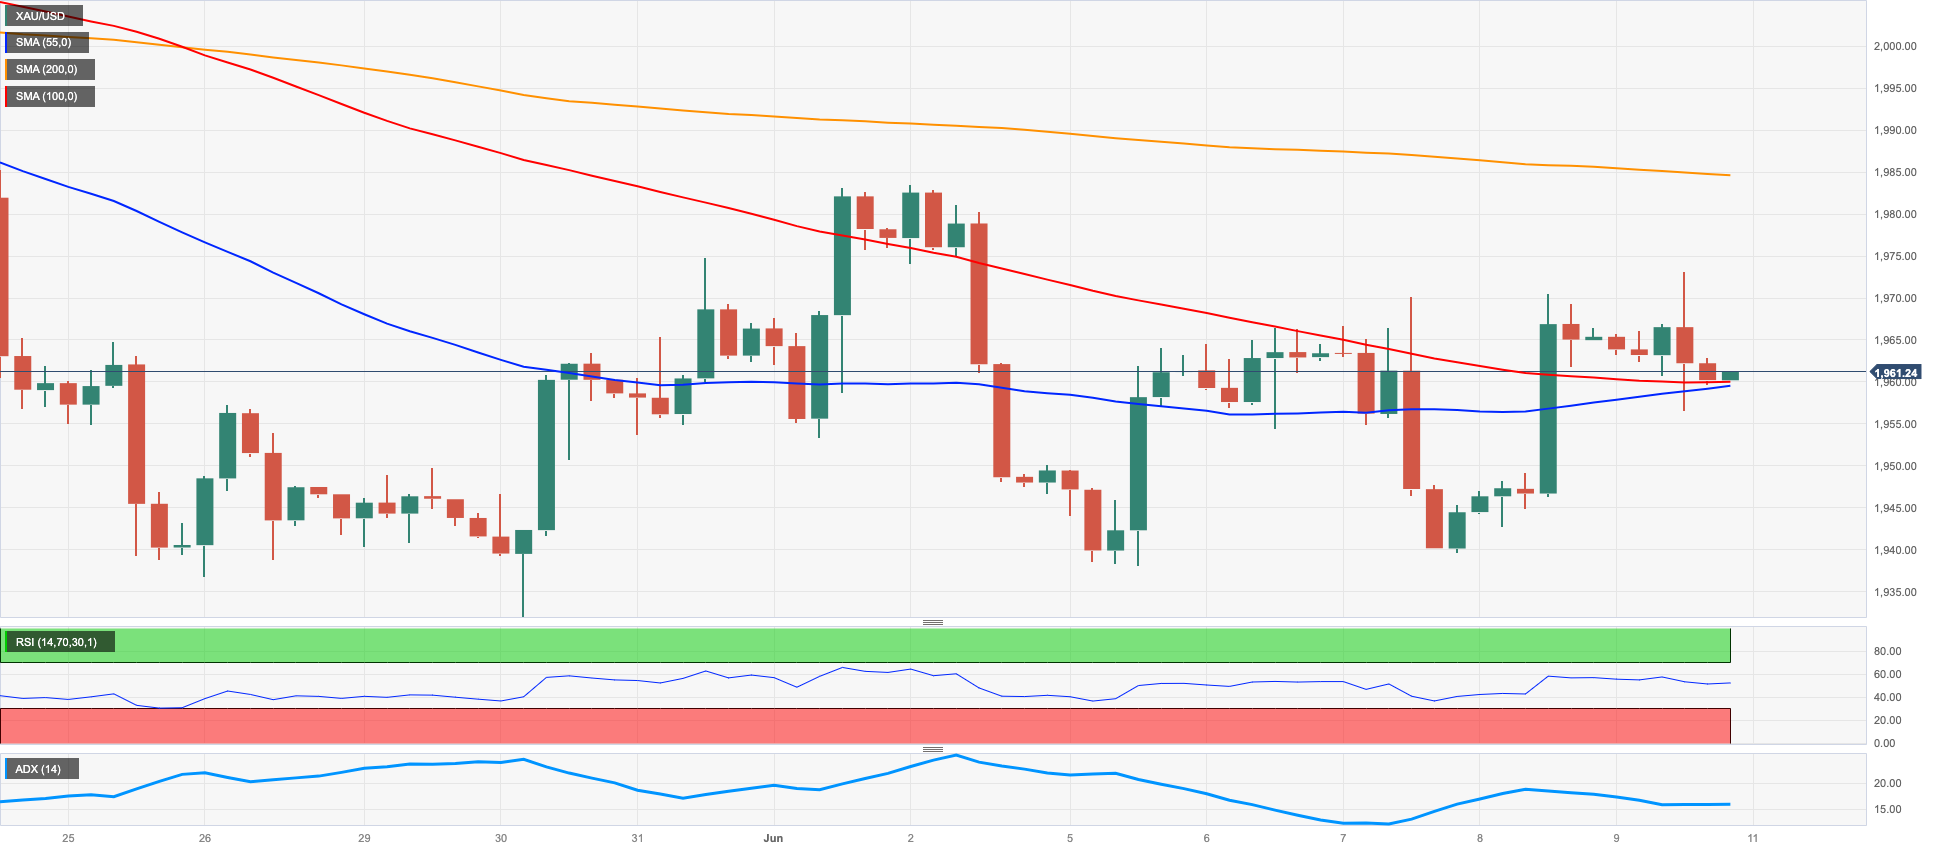
Gold prices corrected mildly lower and ended Friday’s session around the $1960 region per ounce troy. The yellow metal, however, managed to end the second consecutive week with gains, extending the bounce off late May lows near $1930.
In the meantime, bullion alternated gains with losses against the backdrop of a decent recovery in the greenback following Thursday’s sharp sell-off and the resumption of the uptrend in US and German yields.
Looking at the broader picture, the precious metal should face some cautious trading ahead of the release of US inflation figures on June 13 and the FOMC gathering on June 14. So far, market participants continue to favour a pause next week and a 25 bps rate raise at the July 26 event.
A further rally in gold prices could challenge the June high at $1983 (June 2), which precedes the 55-day line SMA at $1988 and the important $2000 milestone. In case the upward momentum continues, there are no prominent resistance levels until the 2023 high at $2067 (May 4), ahead of the 2022 top at $2070 (March 8) and the all-time record at $2075 (August 7, 2020). Contrarily, the May low at $1932 (May 30) emerges as the immediate down-barrier prior to the 200-day line SMA at $1840 and the 2023 low at $1804 (February 28).
Resistance levels: $1970 $1985 $2022 (4H chart)
Support levels: $1932 $1885 $1809 (4H chart)
CRUDE WTI
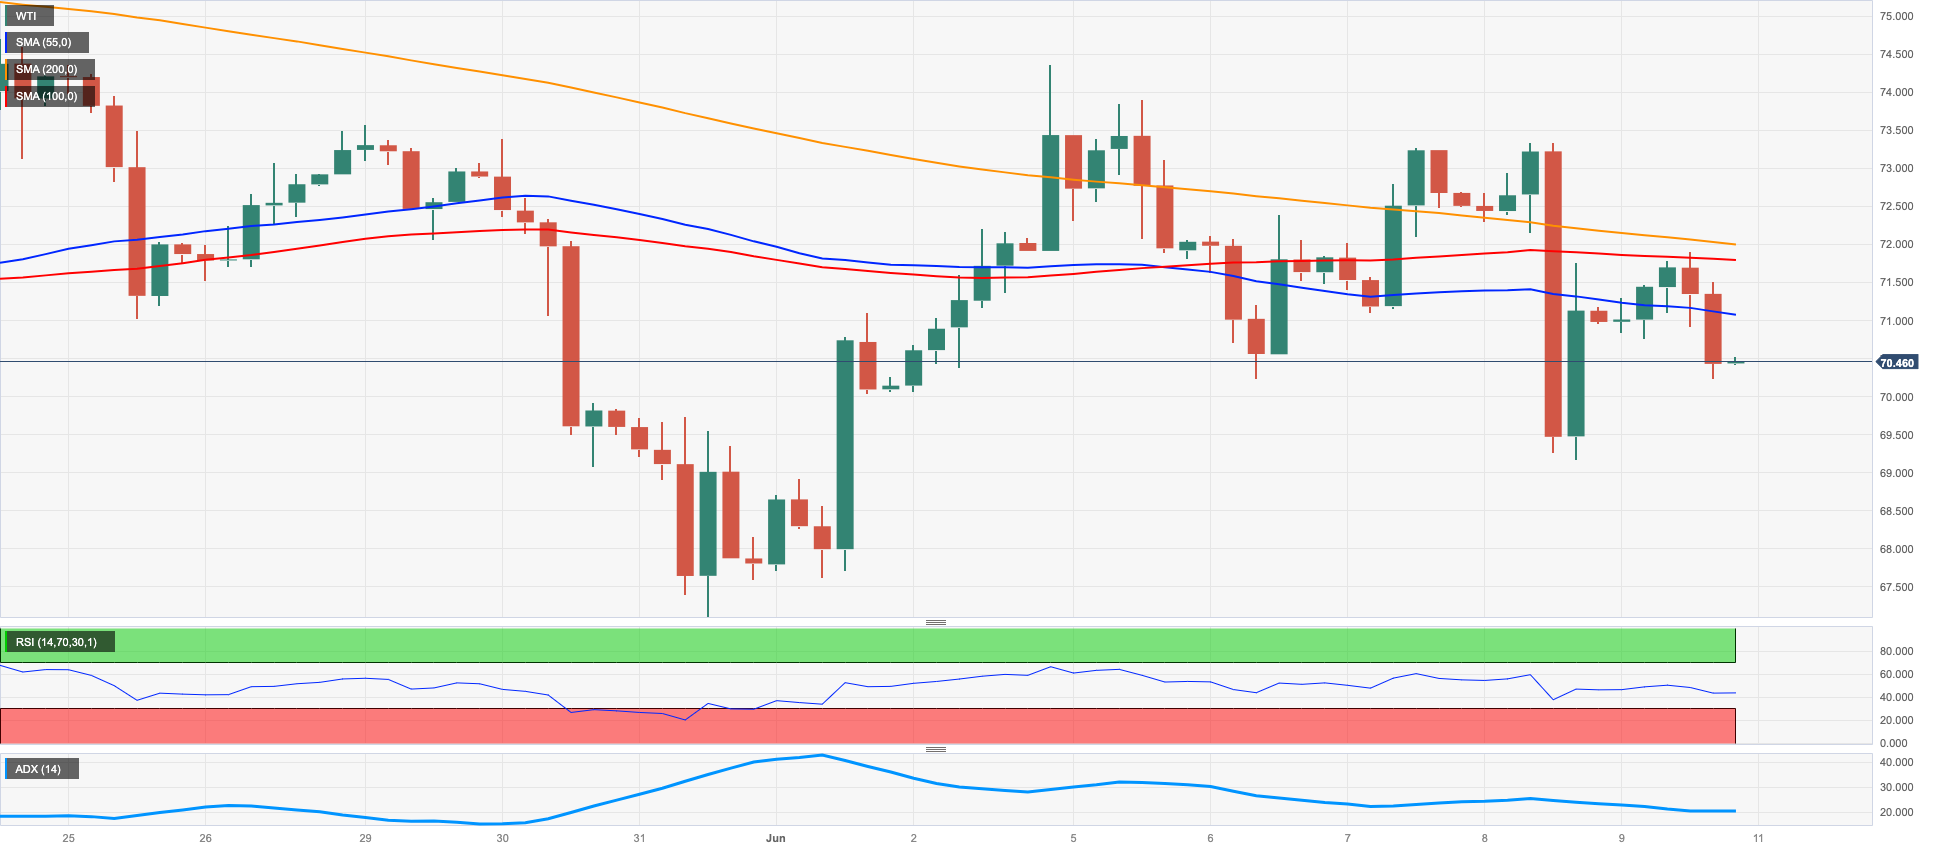
Prices of WTI revisited the $70.00 neighbourhood per barrel amidst a volatile session on Friday. Looking at the weekly performance, crude oil added to the previous week’s pullback and somehow maintained the consolidative range in place since May.
In fact, the commodity exchanged up and downs after the White House denied Thursday’s news, citing a US-Iran nuclear deal, while Saudi Arabia's intentions to reduce oil output came to the fore and underpinned the initial upbeat mood among traders on Friday.
On the not-so-bright side, demand concerns remained an important drag following the larger-than-expected build of US gasoline inventories and discouraging prints from Chinese trade and producer prices.
On the calendar, the US oil rig count went up by 1 in the week to June 9, according to driller Baker Hughes, taking the US total active oil rigs to 556.
The next upside target for WTI is emerging as the June high at $74.92 (June 5), just ahead of the 100-day transitory SMA at $75.28 and the key 200-day SMA at $78.83. Further up, the weekly high at $79.14 (April 24) is ahead of the key barrier of $80.00 per barrel and the 2023 top at $83.49 (April 12), followed by the November 2022 peak at $93.73 (November 7). Having said that, immediate downside hurdles to keep an eye on are the weekly low at $67.08 (May 31), followed by the 2023 low at $63.61 (May 4). Extra support is provided by the December 2021 low at $ 62.46 (December 2) before reaching the important threshold of $ 60.00 per barrel.
Resistance levels: $73.24 $74.92 $76.89 (4H chart)
Support levels: $69.08 $67.08 $63.61 (4H chart)
GER40
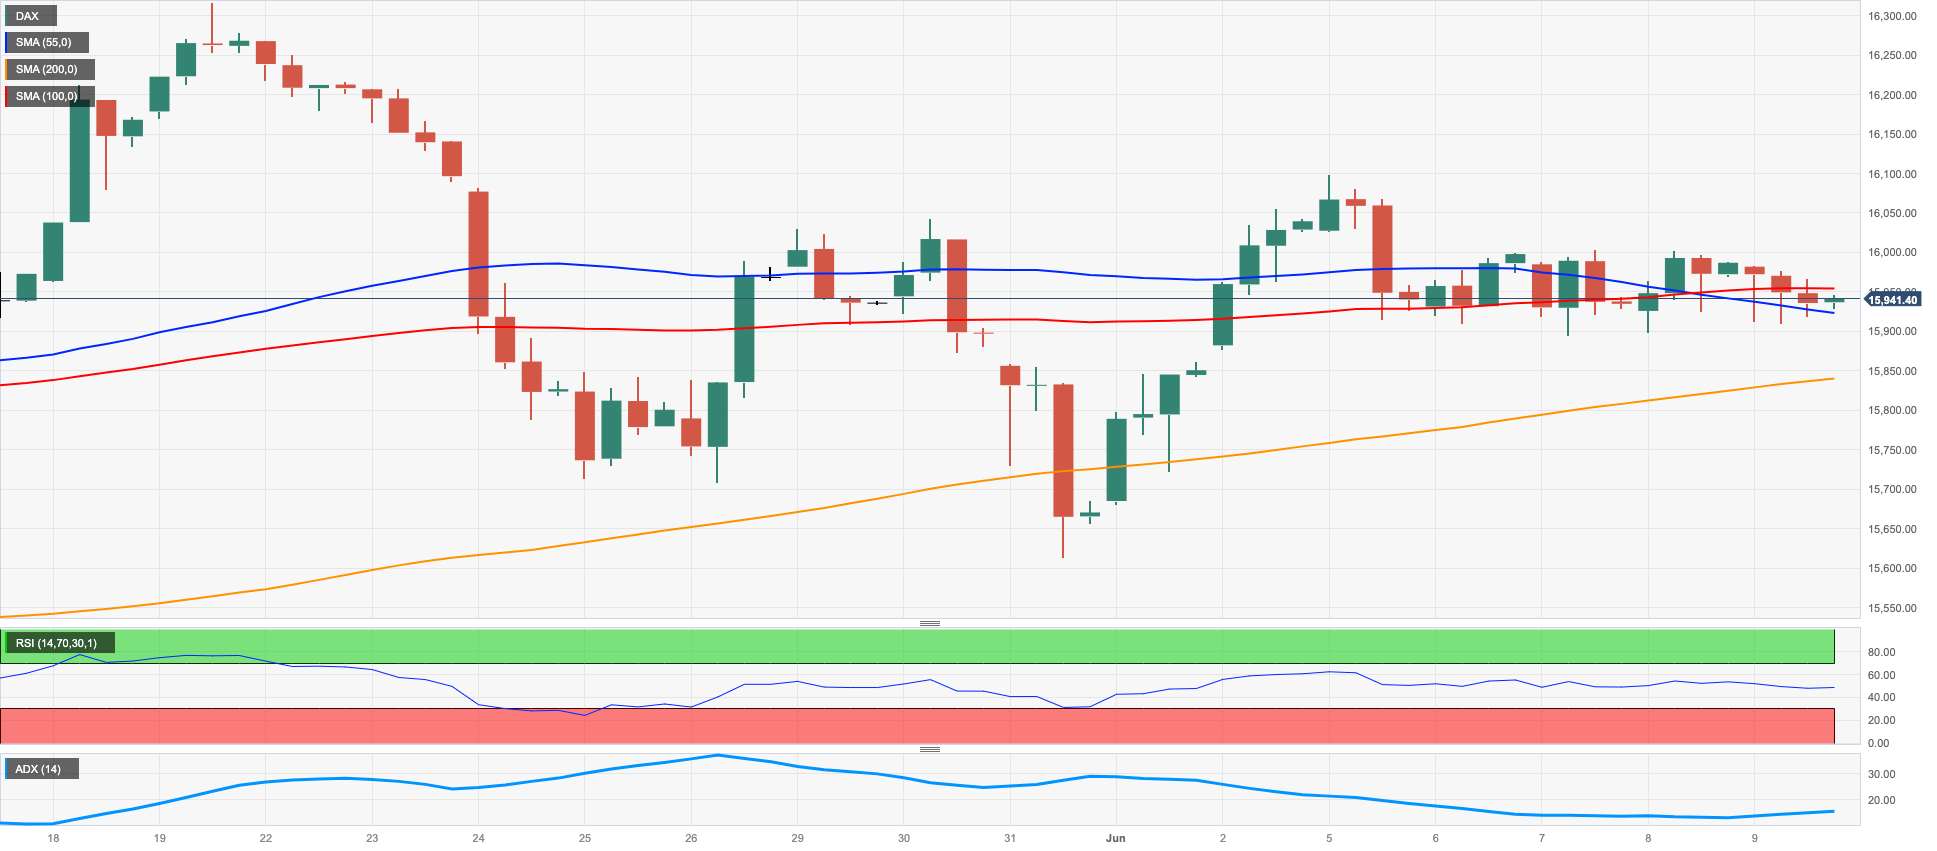
The German reference DAX40 kept the erratic performance unchanged on Friday, receding to negative territory in the sub-16000 region and closing the week with modest losses.
Friday’s knee-jerk in equities came in response to increasing uncertainty hovering around the Chinese recovery in the post-pandemic era, which was somewhat confirmed following trade results earlier in the week and Friday’s release of inflation figures and producer prices below markets’ consensus.
Also adding to the prevailing cautiousness emerged the upcoming release of US inflation figures, the FOMC gathering, and the ECB interest rate decision.
In the German bond market, the 10-year bund yields added to Thursday’s pullback vs. a decent bounce in their US counterparts.
The next significant resistance level for the DAX40 is observed at the high reached in June, specifically at 16114 (June 5). This level comes before the all-time peak of 16331 recorded on May 19. On the other hand, the intermediary 55-day SMA at 15784 serves as the initial point of contention, followed by the May low of 15629 (May 31) and the transitory 100-day SMA at 15560. Further downwards, attention shifts to the April low of 15482 (April 5), followed by a relatively weak support level at 14809 (March 24), and the significant 200-day SMA at 14555. Further south comes the March low of 14458 (March 20). The everyday RSI remained stable around the 52 area.
Best Performers: Vonovia, Rheinmetall AG, MTU Aero
Worst Performers: Brenntag AG, Symrise AG, Hannover Rueck SE
Resistance levels: 16114 16331 17000? (4H chart)
Support levels: 15681 15629 15482 (4H chart)
NASDAQ
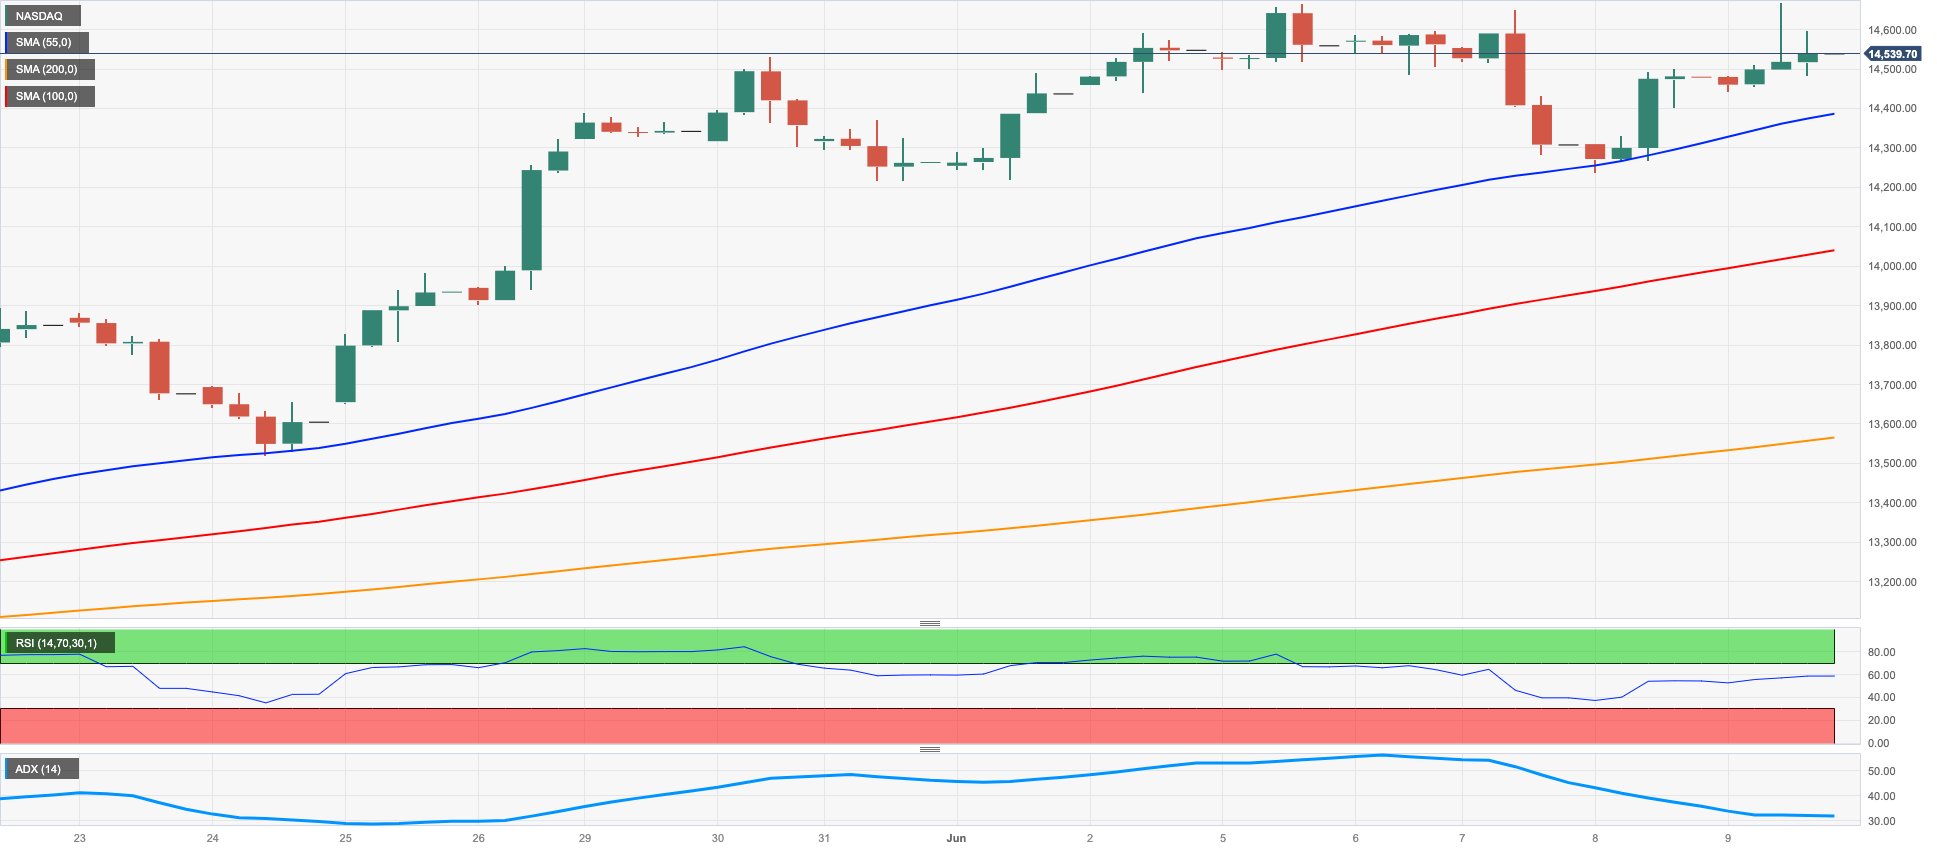
Tech stocks measured by the Nasdaq 100 added to Thursday’s advance and climbed to fresh 2023 highs near the 14700 hurdle on Friday. The robust bounce seen in the second half of the week, however, could not prevent the index from halting its 6-week positive streak.
The mixed tone in US yields, combined with the solid conviction that the Federal Reserve will not hike rates next week, contributed to the upside bias in the index. The solid performances of EV maker Tesla and Adobe further reinforced this trend.
If the Nasdaq 100 index manages to surpass its 2023 high of 14672 (June 9), there is a possibility that it will continue to rise towards the March 2022 peak of 15265 (March 29). The next significant level to watch for would be 16000. On the other hand, the immediate support levels include the weekly low of 13520 (May 24), followed by the interim 55-day SMA at 13398 and the May low of 12938 (May 4), which appears bolstered by the temporary 100-day SMA at 12861. Before reaching the 2023 low at 10696 (January 6), there are several support levels to consider, including the April low of 12724 (April 25), the 200-day SMA at 12185, the March low of 11695 (March 13), and the weekly lows of 11550 (January 25) and 11251 (January 26). The daily RSI approached the overbought territory near 69.
Top Gainers: Tesla, Adobe, AMD
Top Losers: Enphase, Old Dominion Freight Line Inc, Charter Communications Inc
Resistance levels: 14672 15161 15265 (4H chart)
Support levels: 14216 13520 12938 (4H chart)
DOW JONES
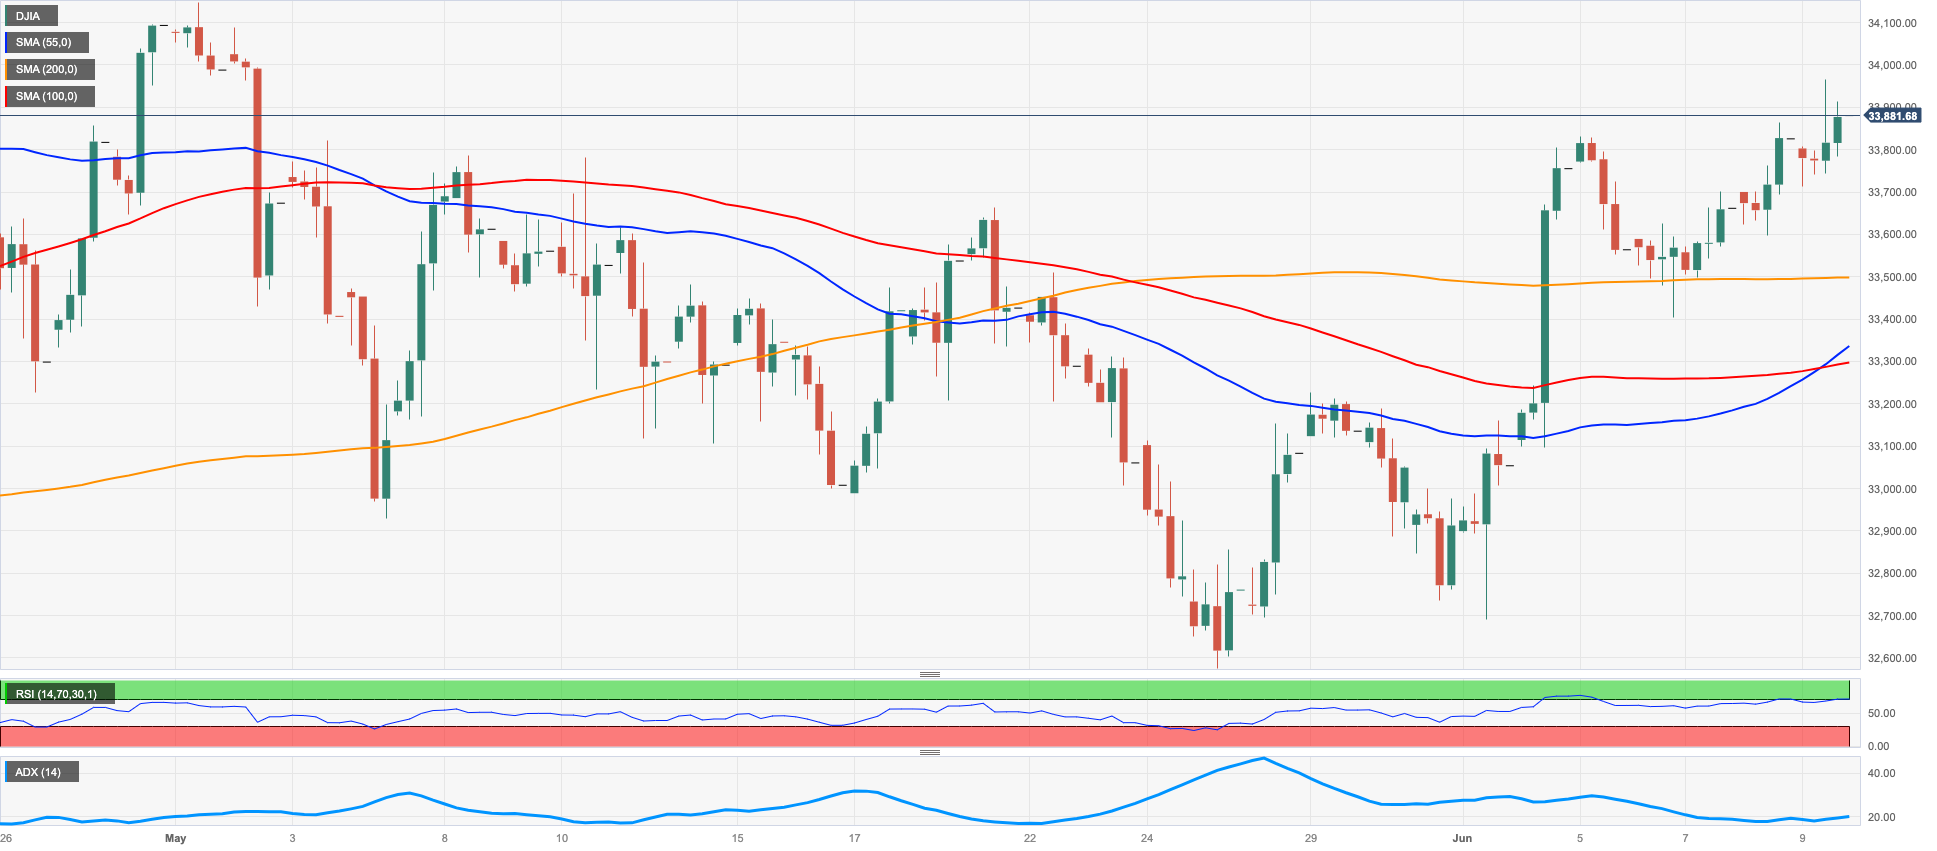
The US benchmark Dow Jones advanced for the fourth consecutive session and closed the week within shouting distance of the key 34000 hurdle, an area last seen back in early May.
Expectations of an impasse in the Fed’s tightening cycle at the June 14 meeting continued to prop up the bullish sentiment among market participants on Friday, helped at the same time by the positive performance of the tech sector, while some prudent trade is also expected to kick in ahead of the release of US inflation figures and the FOMC event, both due next week.
All in all, the Dow Jones rose 0.13% to 33876, the S&P500 gained 0.11% to 4298, and the tech-heavy Nasdaq Composite advanced 0.16% to 13259.
The Dow Jones is expected to maintain its upward momentum. That said, a surpass of the June peak at 33975 (June 9) should shift its focus to the May high of 34257 (May 1), followed by the 2023 peak of 34342 January 13) and the December 2022 high at 34712 (December 13). If the index manages to clear this level, its next target could be the April 2022 high of 35492 (April 21). On the downside, immediate support levels can be found at the 200-day SMA at 32766, ahead of the May low of 32586 (May 25) and the 2023 low of 31429 (March 15). If the index continues to fall, the next significant level of support is the 2022 low at 28660 (October 13). The daily RSI improved to the boundaries of 60.
Top Performers: Salesforce Inc, UnitedHealth, IBM
Worst Performers: Dow, Intel, Walgreen Boots
Resistance levels: 33975 34257 34712 (4H chart)
Support levels: 33399 32586 31805 (4H chart)
MACROECONOMIC EVENTS

All Information & Updates provided by:

All information relating to the financial markets available on this page has been prepared and issued by FXStreet (Forexstreet SL, Spain, Reg: B62498233) on the basis of publicly available information and all information believed to be reliable and does not conflict with Kuwaiti local laws, and all necessary care has been taken to before the company to ensure that the facts mentioned are correct from the source.
NCM Investment nor any of its directors or employees shall in any way be held responsible for the contents of this news, and the information contained on this page is intended only to provide clients with publicly available information and should not be construed as investment advice, report or analysis and/or constitute an offer or invitation to buy or sell financial instruments of any kind.
RISK WARNING: Forex and CFDs are highly risky leveraged products, as losses can exceed deposits. Please ensure you understand all the risks and take independent advice if necessary. NCM will segregate the clients based on the criteria of the regulator and its bylaws. NCM does not provide any advisory service; the material published does not constitute advice or a recommendation for a transaction in any financial instrument. NCM accepts no responsibility for any use of the content presented and any consequences of that use. Anyone acting on the information provided does so at their own risk.