
- Contact Us:
-

-

-

-


Daily Market Updates
13 Jun 2023
USDJPY
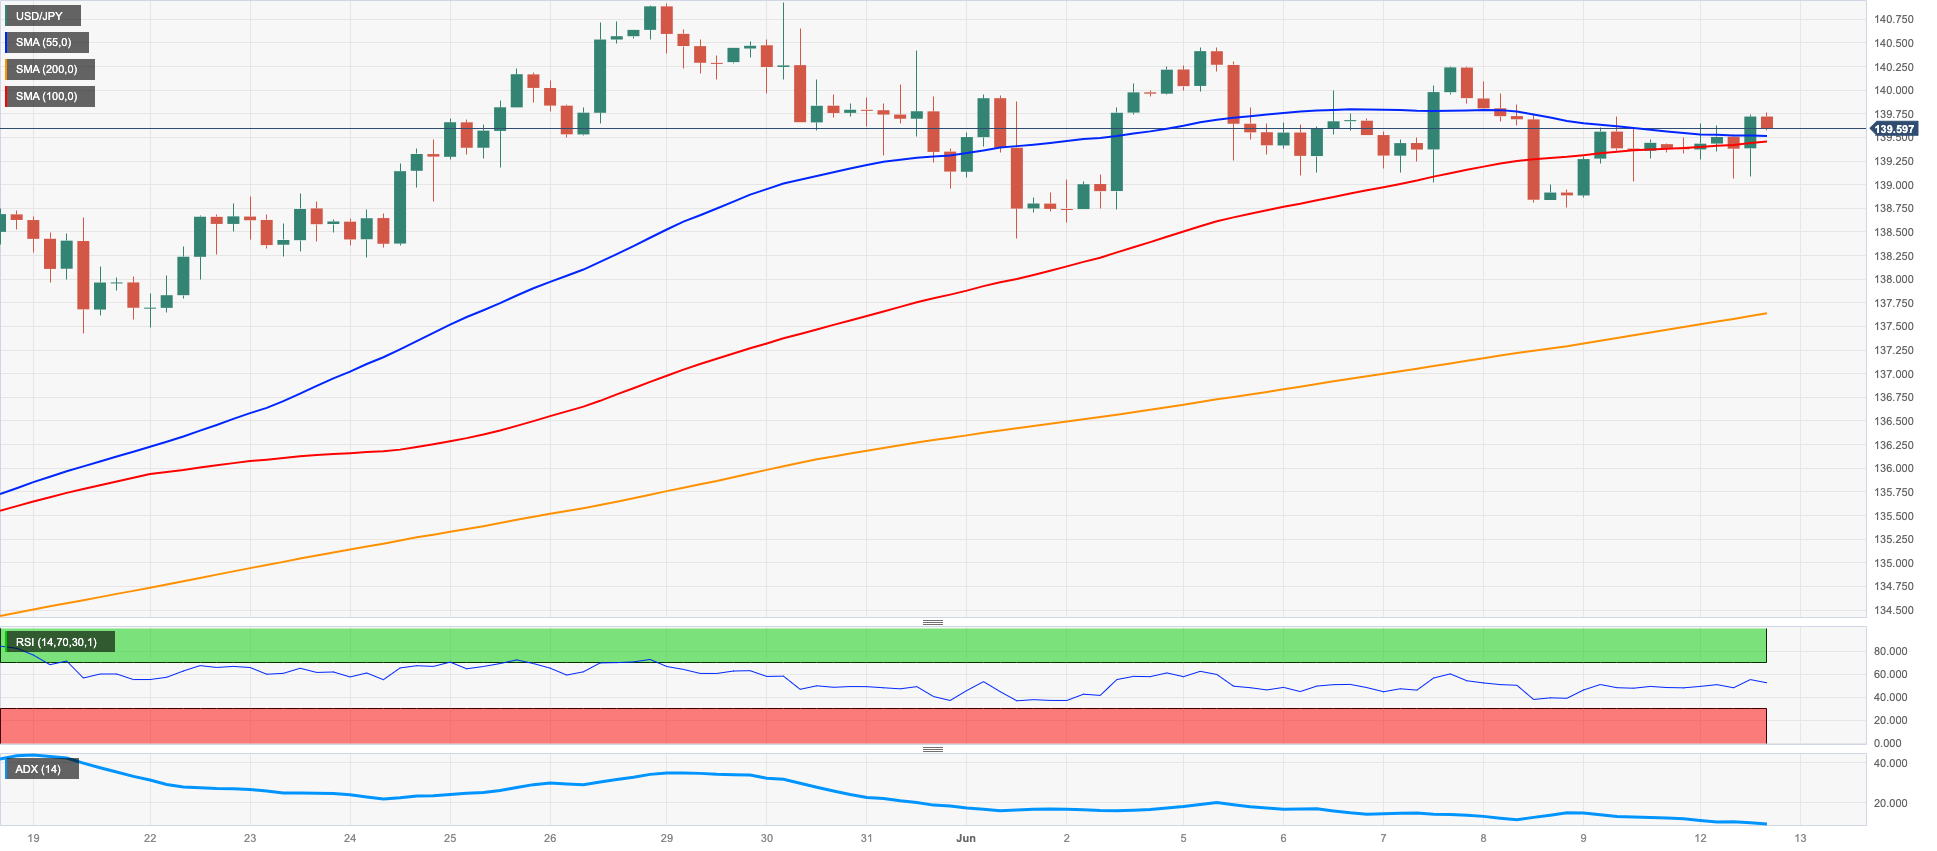
Following Friday’s pronounced advance, USD/JPY navigated an inconclusive range just above the 139.00 yardstick at the beginning of the week.
As a matter of fact, the decent gains in the greenback in combination with the mixed performance of US yields across the curve favoured the directionless pattern in the pair on Monday.
In the meantime, the Japanese bond market saw the JGB 10-year yields extend their consolidative phase further around the 0.42% zone.
In Japan, Producer Prices contracted 0.7% MoM in May and rose 5.1% over the last twelve months. In addition, Machine Tool Orders contracted at an annualized 22.2% in May.
If USD/JPY breaks above the present consolidative theme, it is projected to test the 2023 high of 140.93 (May 30), as well as the weekly highs of 142.25 (November 21 2022) and 151.94 (October 21). Just the opposite, there is immediate contention at the June low of 138.42 (June 1) prior to the crucial 200-day SMA of 137.29. Further south emerges the provisional 55-day and 100-day SMAs at 135.86 and 134.58, respectively before the weekly low of 133.01 (April 26). Down from here comes the minor support level at 132.01 (April 13) ahead of the April low at 130.62 (April 5). The loss of the latter could open the door to a drop to the March low of 129.63 (March 24) and the February low of 128.08 (February 8). The everyday RSI advanced a tad to the 59 area.
Resistance levels: 139.76 140.24 140.45 (4H chart)
Support levels: 138.75 138.42 137.28 (4H chart)
GBPUSD
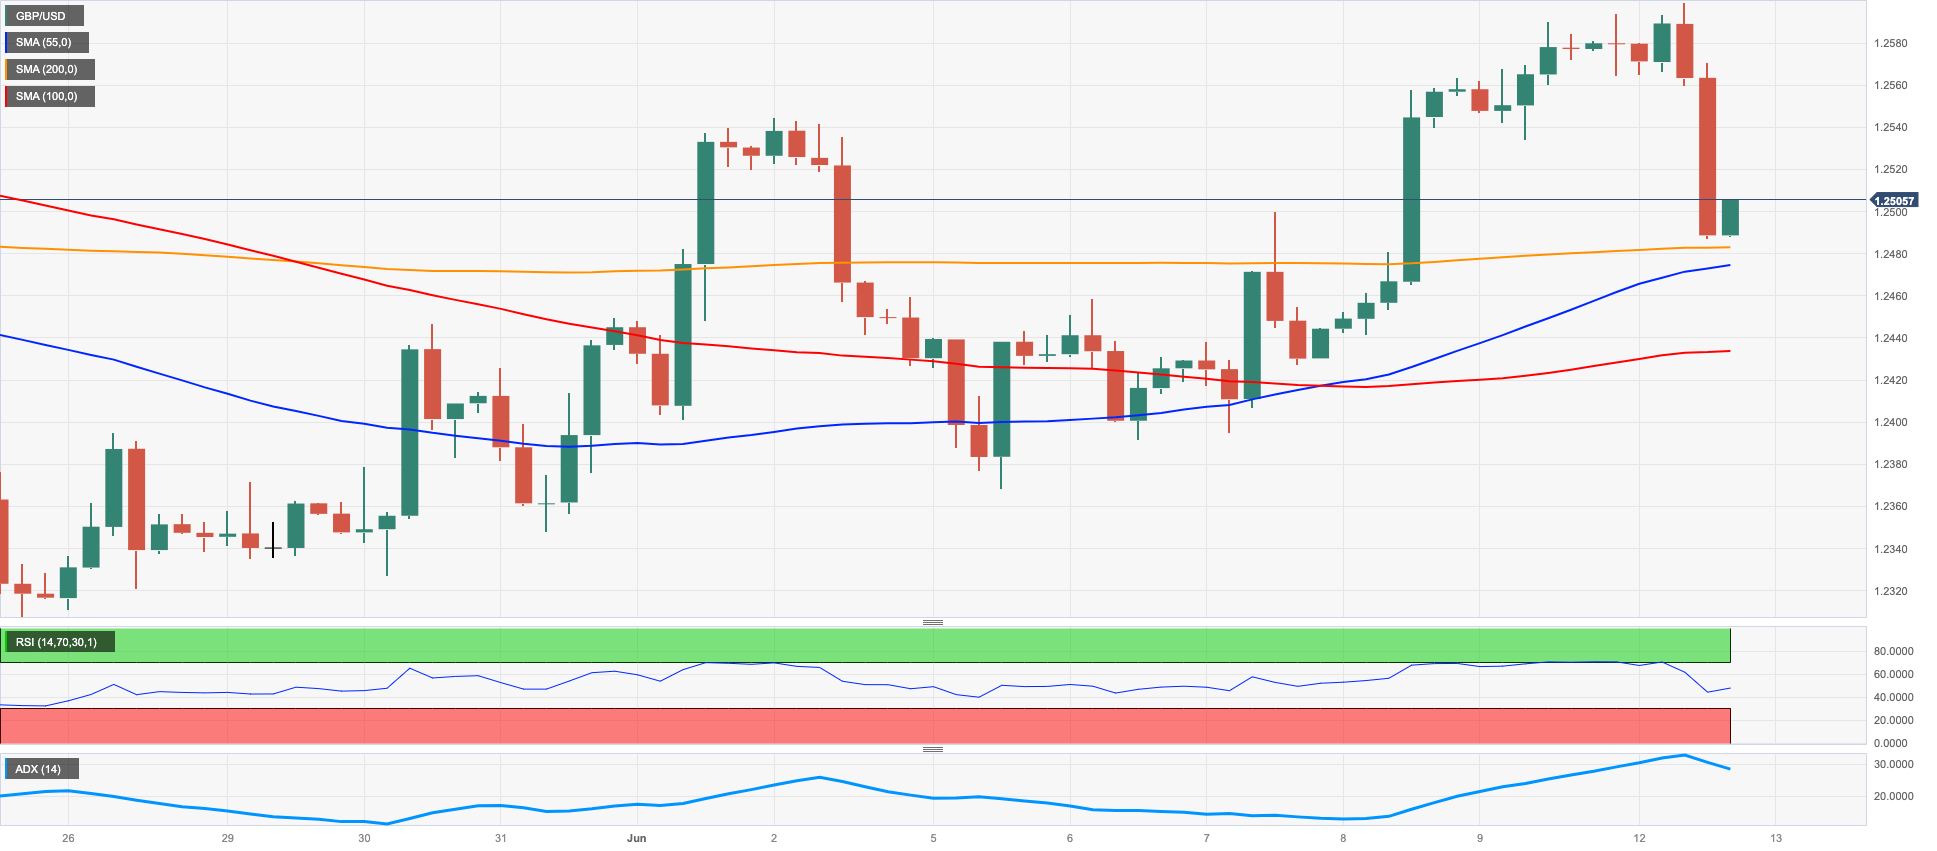
GBP/USD failed to clinch to gains after hitting fresh 5-week highs just pips below 1.2600 the figure at the beginning of the new trading week. Cable, eventually, succumbed to the dollar’s rebound and came all the way down to revisit the 1.2490/85 band, ending the session with important losses.
Indeed, the offered bias around the British pound forced the pair to reverse three consecutive daily advances against the backdrop of erratic activity in the risk galaxy, while the UK 10-year Gilt yields recorded new monthly highs near the 4.35% level.
From the BoE, MPC member J. Haskel suggested that policy should lean against the risk of inflation at a time when he did not rule out further interest rate hikes. According to his colleague, C. Mann, there was considerable apprehension regarding sticky core inflation. She mentioned that she was waiting for an analysis of the data to determine her next vote. IN addition, the decline in inflation expectations played a crucial role in his decision to change his vote to a 25 bps rate hike from 50 bps. She also emphasized that she paid a great deal of attention to the role of the pound, and noted that inflation expectations were on a downward trend.
For GBP/USD to maintain its upward momentum, it must surpass the June high of 1.2599 (June 9). If it does, it will reach the 2023 peak of 1.2679 (May 10), followed by the 200-week SMA at 1.2871 ahead of the psychological threshold of 1.3000. On the flip side, the May low of 1.2308 (May 25) is underpinned by the transitory 100-day SMA at 1.2309 and comes before the April low of 1.2274 (April 3). If the pair continues to drop, the next crucial support level is the 200-day SMA at 1.2019, which is above the 2023 low of 1.1802 (March 8). The RSI drooped t below the 54 level.
Resistance levels: 1.2599 1.2679 1.2772 (4H chart)
Support levels: 1.2482 1.2368 1.2347 (4H chart)
AUDUSD
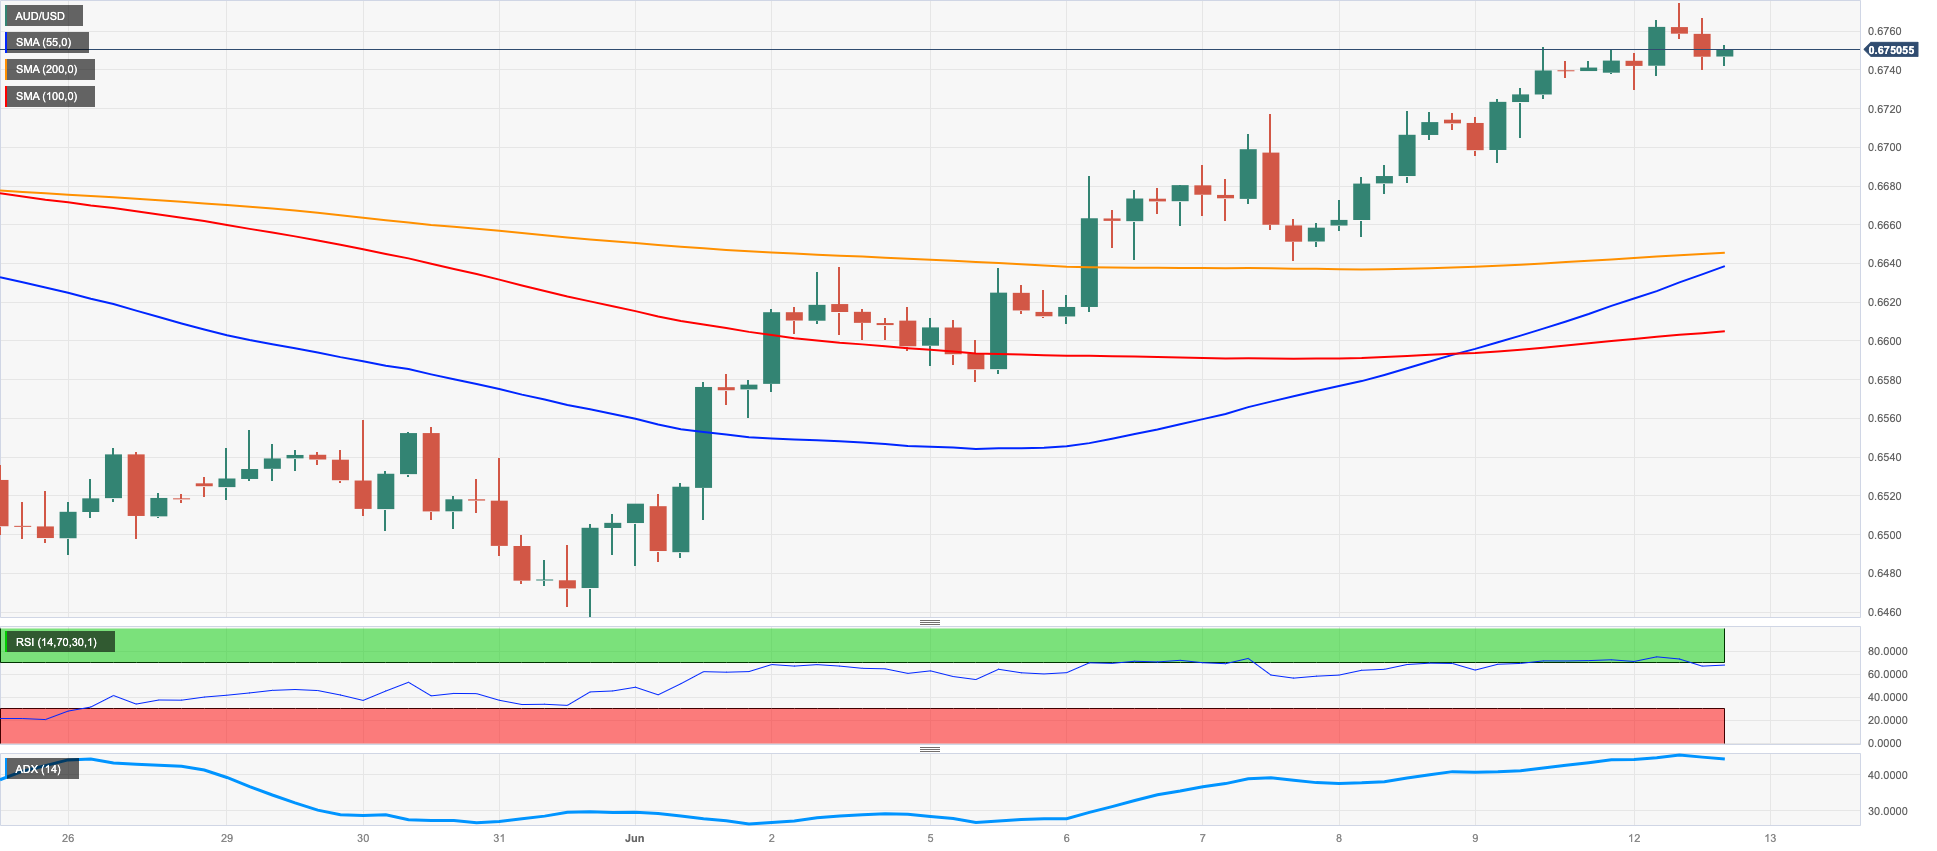
AUD/USD could not sustain the early move to multi-week highs near 0.6780 and surrender almost all of those gains amidst the late recovery in the greenback on Monday.
Also limiting the upside potential around the Aussie dollar emerged the mixed performance of the commodity universe, which saw copper prices extend the leg lower vs. extra gains in iron ore.
The Australian docket was empty on Monday.
If the rally in AUD/USD continues, it is anticipated that it will test the May high of 0.6818 (May 10) before reaching the psychological level of 0.7000. Additional targets to consider are the weekly top of 0.7029 (February 14) and the peak for 2023 at 0.7157 (February 2). Conversely, if the pair drops below the 2023 low of 0.6458 (May 31), it could indicate a more significant pullback towards the weekly low of 0.6386 (November 10, 2022), and then potentially down to the November 2022 low of 0.6272 (November 3). The daily RSI hovered around 62.
Resistance levels: 0.6773 0.6818 0.6920 (4H chart)
Support levels: 0.6645 0.6579 0.6458 (4H chart)
GOLD
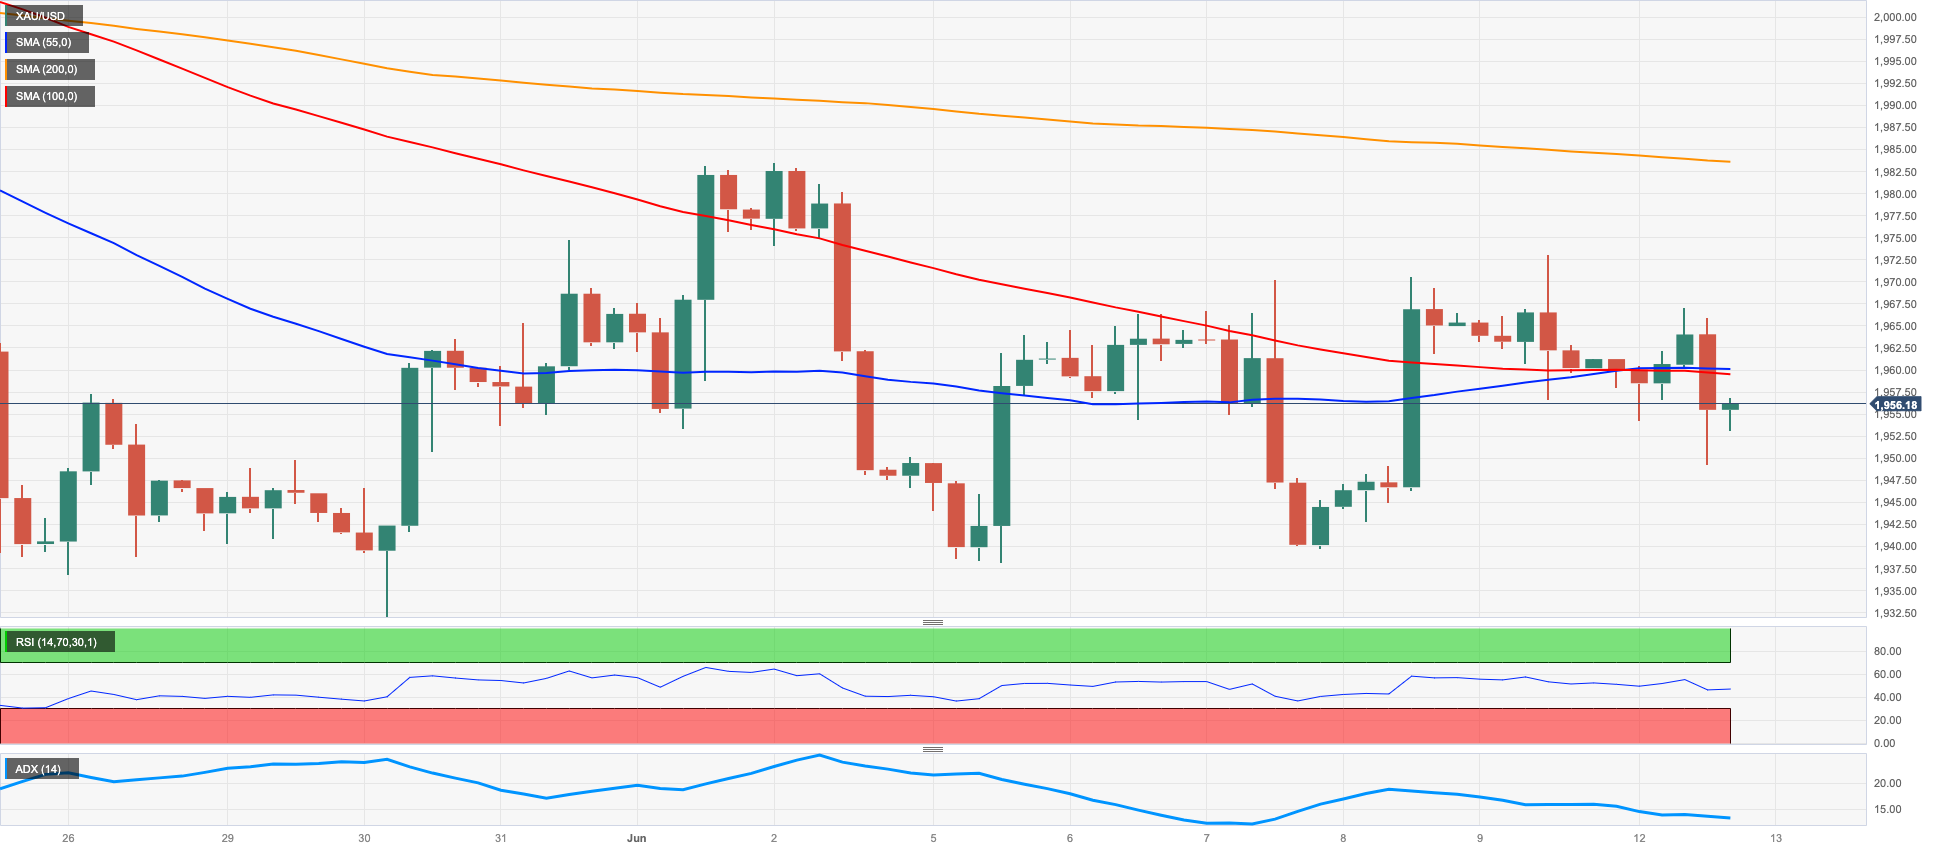
The precious metal started the week on the back foot and retreated to the $1950 region per ounce troy on Monday, where some initial contention appears to have emerged.
In fact, the rebound in the greenback and the bullish attempt in US yields across the curve sponsored the second consecutive daily pullback in the yellow metal amidst the generalized bearish note in the precious metals.
Moving forward, bullion should remain in a cautious stance ahead of the release of US inflation figures on Tuesday and the FOMC gathering the following day.
Gold appears stuck within a consolidative range for the time being. Against that, the breakout of this theme could challenge the June high of $1983, which is followed by the 55-day SMA at $1987 ahead of the significant milestone of $2000. Further up, there are no major resistance levels until the 2023 top of $2067 (May 4), followed by the 2022 peak at $2070 (March 8) and the all-time record of $2075 (August 7, 2020). On the downside, the immediate obstacle to a downward movement is the May low of $1932, followed by the 200-day line SMA at $1841 and the 2023 low of $1804 on February 28.
Resistance levels: $1973 $1985 $2022 (4H chart)
Support levels: $1949 $1938 $1885 (4H chart)
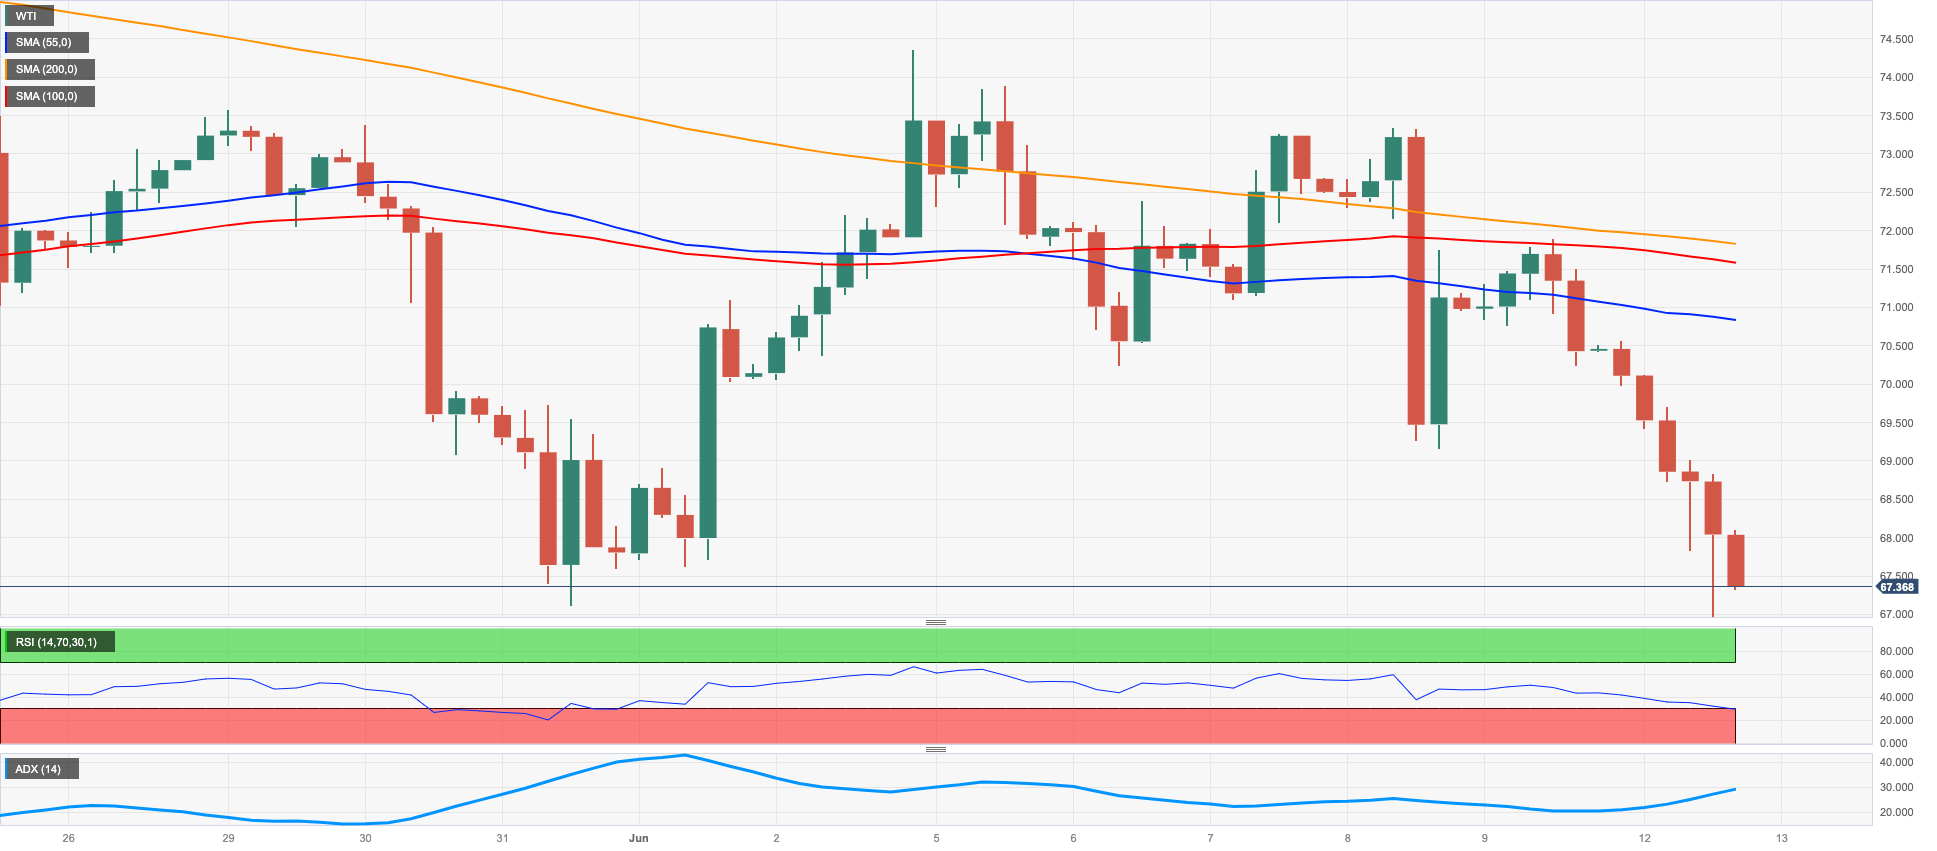
CRUDE WTI
Further selling bias hurt the commodity and sent prices of the American reference for the sweet light crude oil to fresh lows at levels last seen in early May, below the $67.00 mark per barrel on Monday.
Extra weakness in crude oil this time emerged in response to a combination of traders’ concerns over the absence of a strong rebound in Chinese economic activity in the post-pandemic era and its impact on the demand for crude oil and rising jitters ahead of the probable resumption of the hiking cycle by the Federal Reserve at the July meeting.
Also weighing on traders’ sentiment was the downward revision to the oil price forecast by financial giant Goldman Sachs.
Later in the session, the IEA will publish its report on Wednesday, while the API and the EIA will release their reports on US crude oil inventories in the week leading up to June 9.
Extra decline in WTI appears likely once the June low at $66.86 (June 13) is cleared. A deeper pullback from here could target the 2023 low at $63.61 (May 4) prior to the December 2021 low of $62.46 (December 2) and the critical threshold of $60.00 per barrel. Having said that, the immediate up-barrier aligns at the June high at $74.92 (June 5), which comes just before the 100-day SMA at $75.13 and the key 200-day SMA at $78.70. Moving higher, the weekly high at $79.14 (April 24) is followed by the significant barrier of $80.00 per barrel and the 2023 peak at $83.49 (April 12), with the November 2022 peak at $93.73 (November 7) coming after.
Resistance levels: $71.87 $73.24 $74.92 (4H chart)
Support levels: $66.78 $63.61 $62.42 (4H chart)
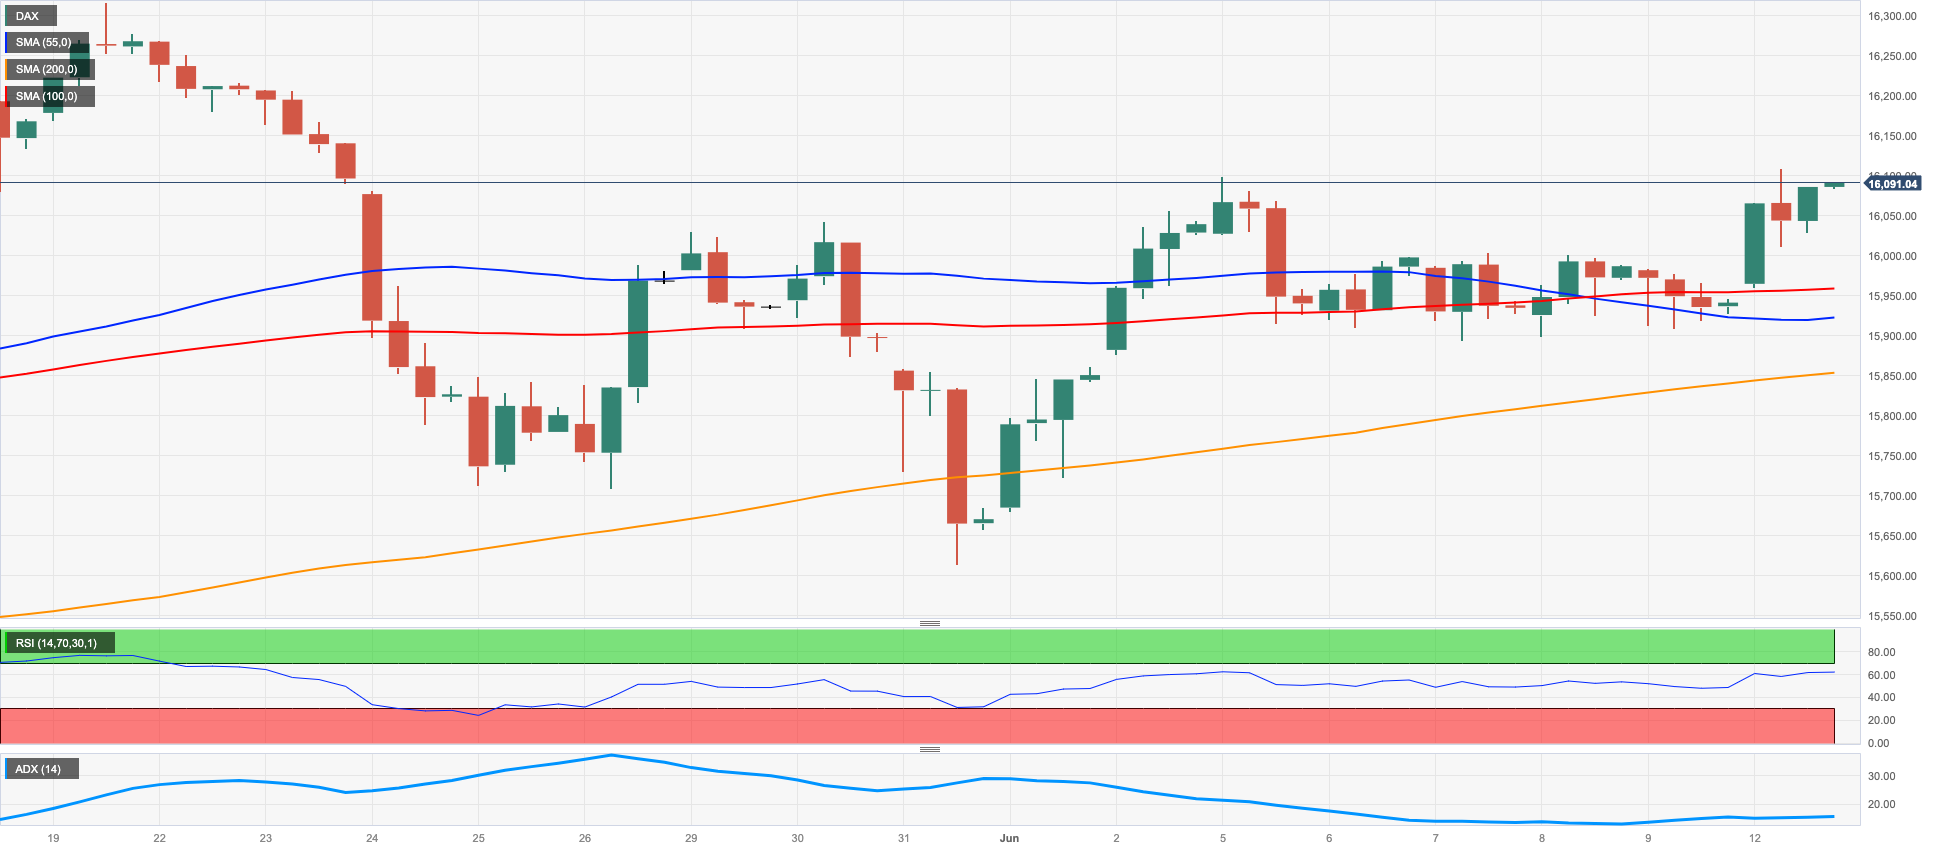
GER40
German stocks tracked by the DAX40 advanced to 3-week highs past the 16100 mark at the beginning of the week, breaking above the multi-session consolidative theme that prevailed throughout last week.
The upside bias in the index was amidst the broad-based optimism in the old continent ahead of the publication of US CPI on Tuesday and the Fed and ECB interest rate decisions on Wednesday and Thursday.
So far, the ECB is largely anticipated to hike rates by 25 bps this week and a similar increment at the July event, as it has been reinforced by the hawkish narrative from ECB rate setters in the past few days.
The decent uptick in the DAX40 came in contrast to the third consecutive daily decline in German 10-year bund yields, this time slipping back below the 2.40% region.
The DAX40's next key resistance level is seen near the high attained in June, precisely around 16114 (June 5). This level is lower than the all-time high of 16331 set on May 19. The other way around, the interim 55-day SMA at 15799 acts as the first point of conflict, followed by the May low of 15629 (May 31) and the temporary 100-day SMA at 15569. Further down, the focus switches to the April low of 15482 (April 5), ahead of a somewhat weak support level at 14809 (March 24), and the important 200-day SMA at 14570. The March low of 14458 (March 20) is farther south. The daily RSI climbed to the vicinity of the 57 area.
Best Performers: Adidas, Rheinmetall AG, Sartorius AG VZO
Worst Performers: Fresenius SE, Symrise AG, Vonovia
Resistance levels: 16126 16331 17000? (4H chart)
Support levels: 15689 15629 15482 (4H chart)
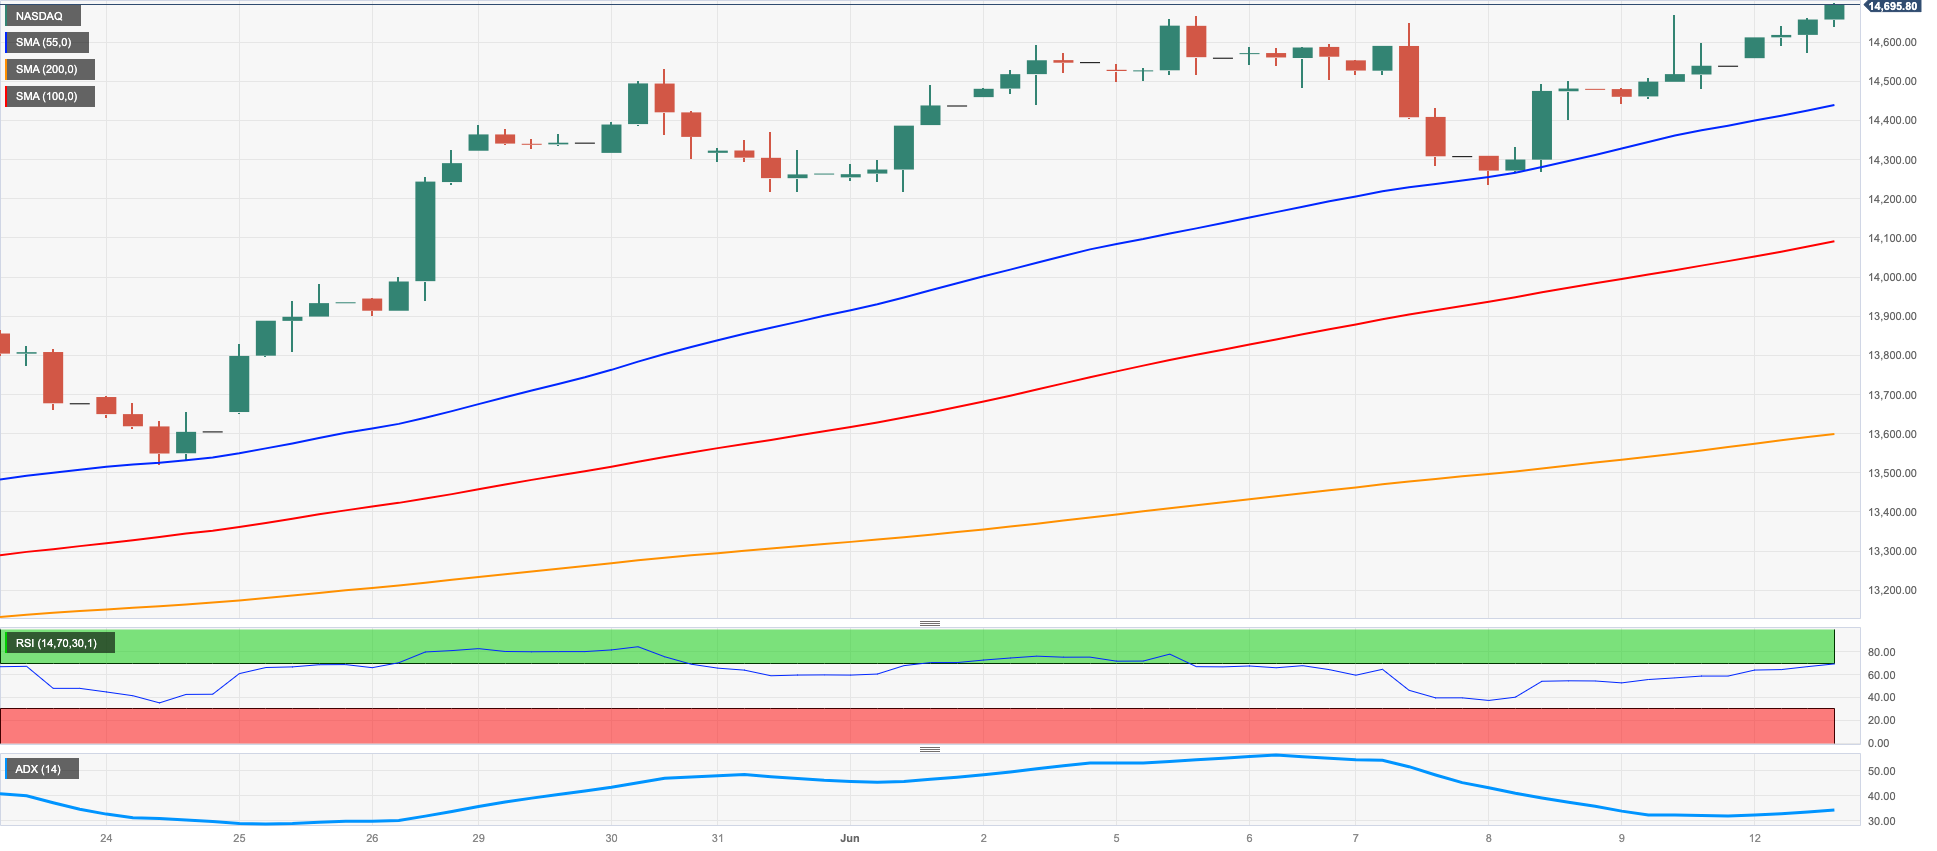
NASDAQ
The tech-reference Nasdaq 100 started the week in an auspicious fashion and flirted with the area of 2023 highs near the 14700 region on Monday.
Investors kept the rally in the tech sector well in place on Monday amidst the mixed activity of US yields, while firmer conviction that the Federal Reserve will skip a rate hike later in the week also contributed to the bullish mood.
Should the Nasdaq 100 index exceed its 2023 high of 14672 (June 9), it may continue its upward trajectory towards the March 2022 peak of 15265 (March 29), with the next significant level to keep an eye on being 16000. On the opposite side, the immediate support levels include the weekly low of 13520 (May 24), followed by the transitory 55-day SMA at 13433 and the May low of 12938 (May 4). The latter is backed by the temporary 100-day SMA at 12894. Prior to reaching the 2023 low at 10696 (January 6), there are several support levels to take into account, such as the April low of 12724 (April 25), the 200-day SMA at 12194, the March low of 11695 (March 13), and the weekly lows of 11550 (January 25) and 11251 (January 26). The day-to-day RSI entered the overbought zone past 71.
Top Gainers: Broadcom, Airbnb, Intel
Top Losers: Diamondback, Sirius XM, Amgen
Resistance levels: 14672 15161 15265 (4H chart)
Support levels: 14283 14216 13520 (4H chart)
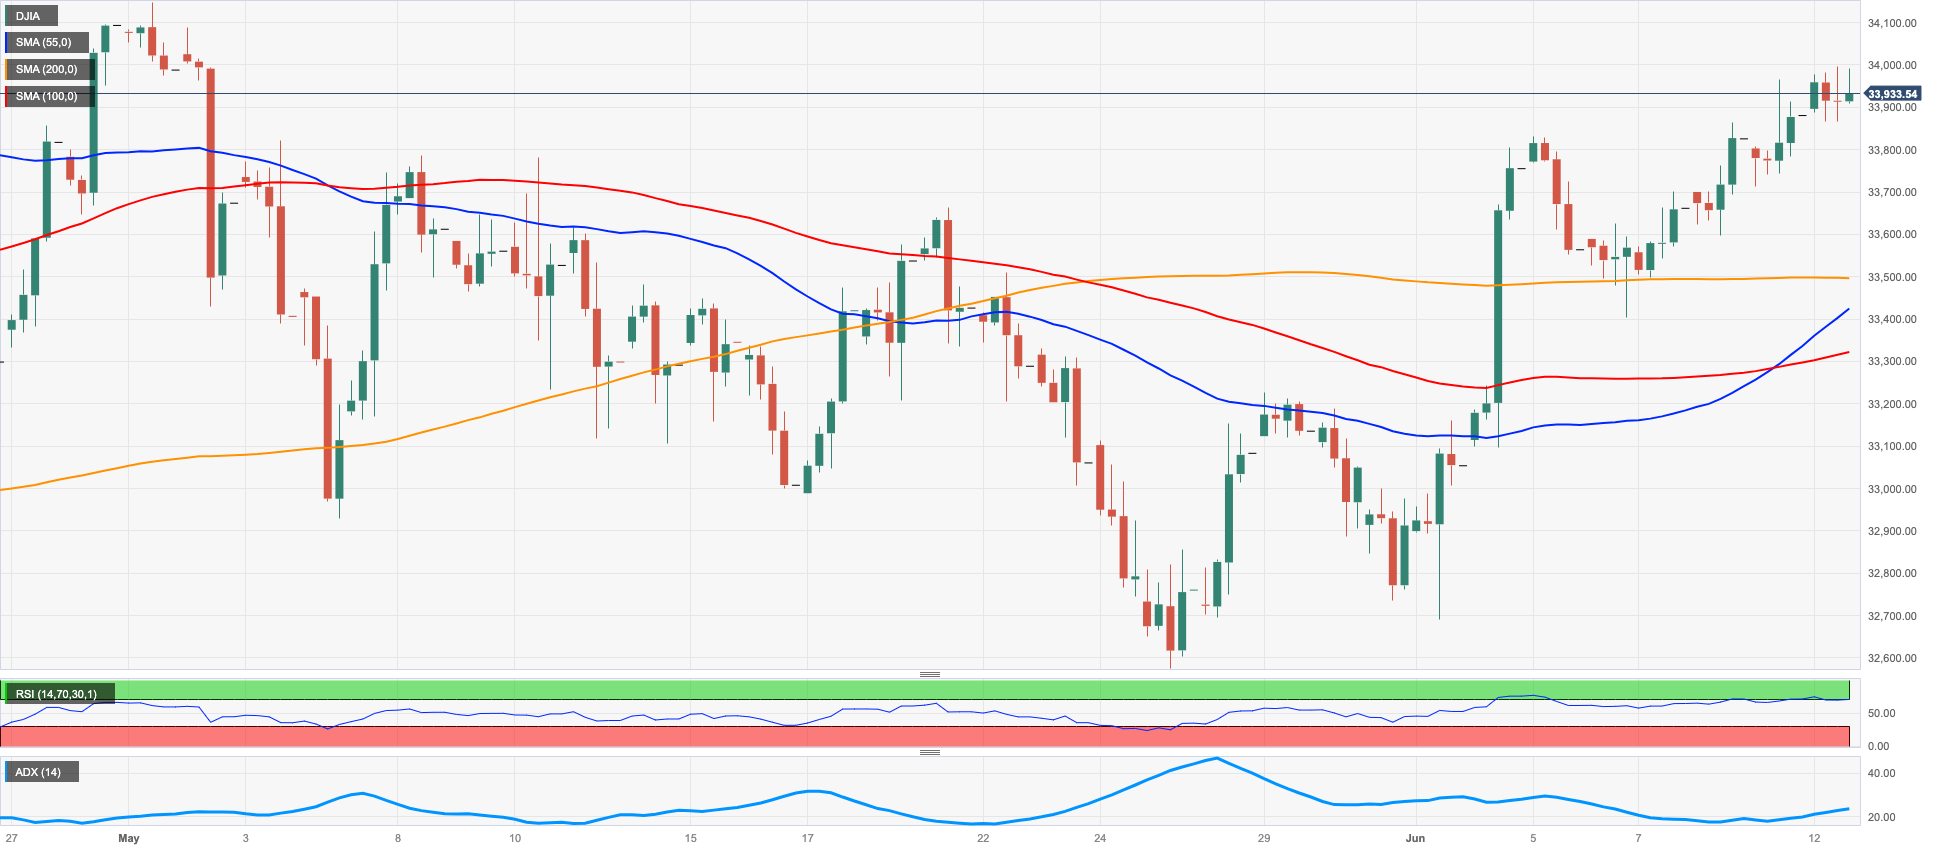
DOW JONES
Equities gauged by the Dow Jones extended the upside momentum for the fifth consecutive session, this time managing to briefly trespass the key 34000 hurdle on Monday and clinch at the same time new monthly highs.
Indeed, the upbeat tone remained unchanged among market participants ahead of the release of key US inflation figures on Tuesday and the most likely pause at the Fed’s meeting on June 14.
Overall, the Dow Jones advanced 0.26% to 33966, the S&P500 rose 0.47% to 4319, and the tech-benchmark Nasdaq Composite gained 0.96% to 13387.
The Dow Jones is expected to maintain its upward momentum. However, a breach of the June high at 343004 (June 13) is likely to draw attention to the May top at 34257 (May 1), followed by the 2023 peak at 34342 (January 13) and the December 2022 high at 34712 (December 13). If the index manages to break above this level, the next target could be the April 2022 high at 35492 (21 April). On the flip side, immediate support is at the 200-day SMA at 32771, followed by the May low at 32586 (May 25) and the 2023 low at 31429 (March 15). If the index continues to fall, the next important support is the 2022 low at 28660 (October 13). The RSI on a daily basis trespassed the 61 barrier.
Top Performers: Intel, Boeing, Home Depot
Worst Performers: Amgen, Chevron, Merck&Co
Resistance levels: 34004 34257 34712 (4H chart)
Support levels: 33399 33318 32586 (4H chart)
MACROECONOMIC EVENTS

All Information & Updates provided by:

All information relating to the financial markets available on this page has been prepared and issued by FXStreet (Forexstreet SL, Spain, Reg: B62498233) on the basis of publicly available information and all information believed to be reliable and does not conflict with Kuwaiti local laws, and all necessary care has been taken to before the company to ensure that the facts mentioned are correct from the source.
NCM Investment nor any of its directors or employees shall in any way be held responsible for the contents of this news, and the information contained on this page is intended only to provide clients with publicly available information and should not be construed as investment advice, report or analysis and/or constitute an offer or invitation to buy or sell financial instruments of any kind.
RISK WARNING: Forex and CFDs are highly risky leveraged products, as losses can exceed deposits. Please ensure you understand all the risks and take independent advice if necessary. NCM will segregate the clients based on the criteria of the regulator and its bylaws. NCM does not provide any advisory service; the material published does not constitute advice or a recommendation for a transaction in any financial instrument. NCM accepts no responsibility for any use of the content presented and any consequences of that use. Anyone acting on the information provided does so at their own risk.