
- Contact Us:
-

-

-

-


Daily Market Updates
14 Jun 2023
USDJPY
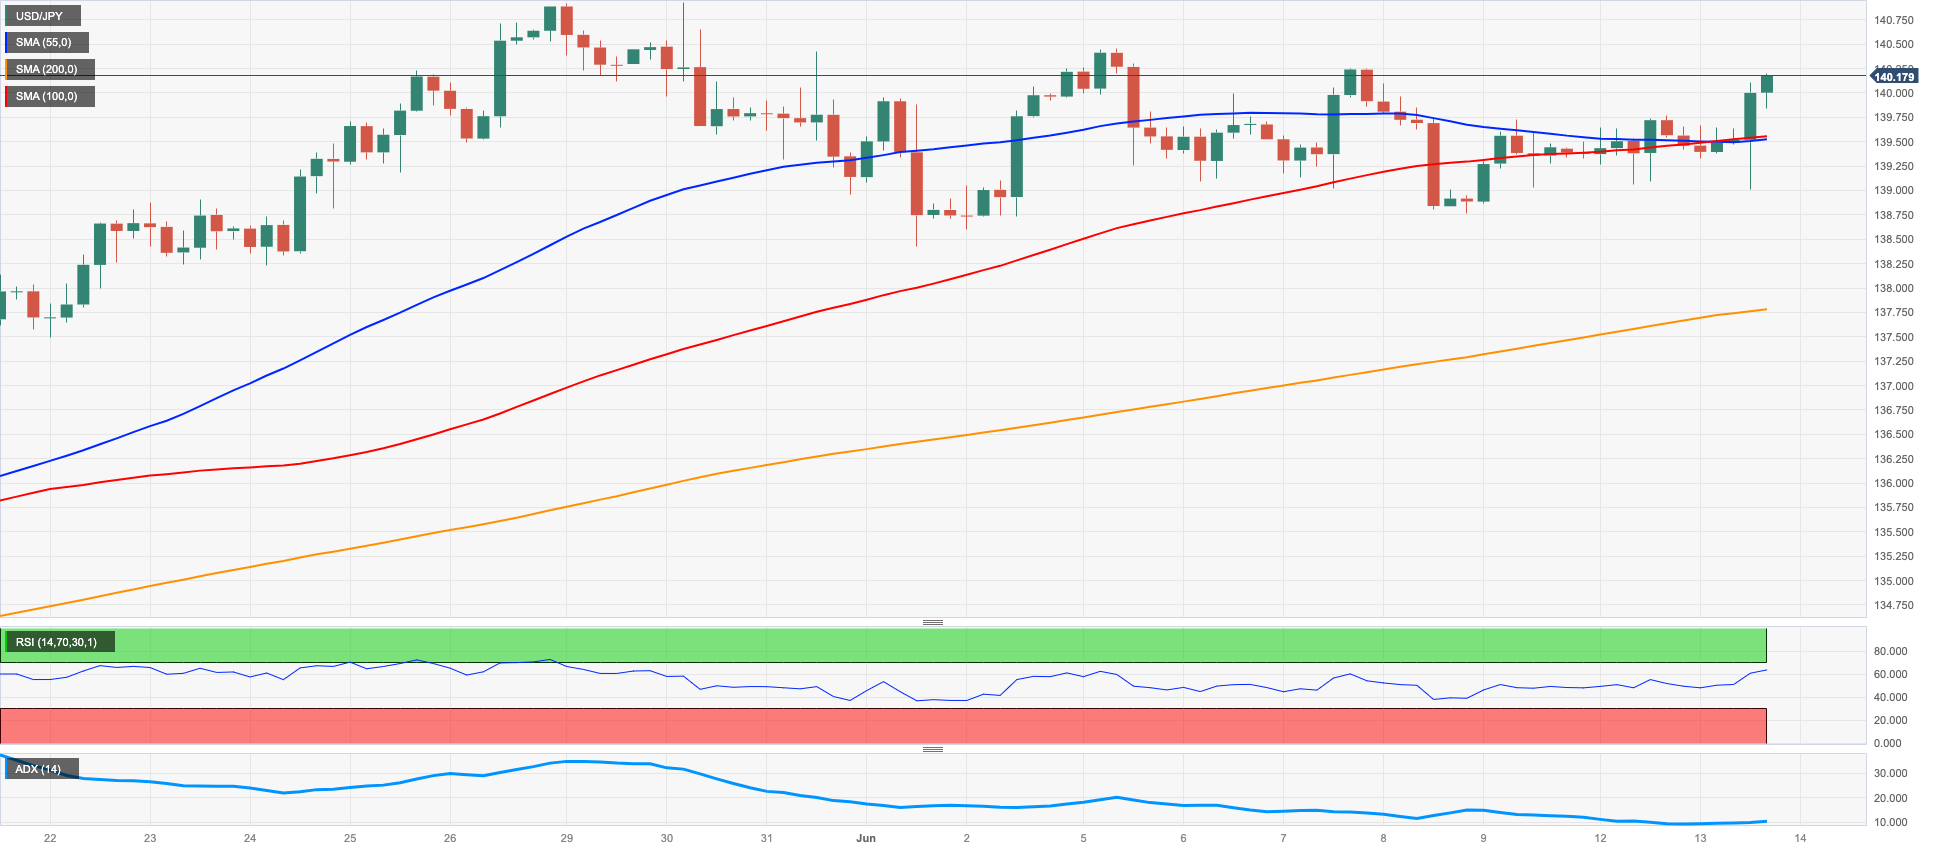
USD/JPY extended the positive performance and clinched the third daily gain in a row on Tuesday, this time surpassing the key 140.00 barrier to print fresh multi-day peaks.
The persistent improvement in the appetite for risk-associated assets put the Japanese yen under extra pressure and encouraged spot to accelerate gains past the 140.00 hurdle
Also contributing to the move to 3-day highs in the pair was the rebound in US yields across the curve, while the JGB 10-year yields extended the gradual decline for the third consecutive day.
In the Japanese calendar, the BSI Large Manufacturing index contracted 0.4% QoQ in the April-June period.
If USD/JPY pair manages to break out of its current consolidation phase, it is anticipated to test several significant levels. These include the 2023 high at 140.93 (May 30), as well as the weekly highs of 142.25 (November 21, 2022) and 151.94 (October 21). Just the opposite, immediate support is encountered at the June low of 138.42 (June 1), followed by the crucial 200-day SMA at 137.26 and the transitory 55-day and 100-day SMAs at 135.98 and 134.66, respectively. South from here comes the weekly low of 133.01 (April 26) ahead of a minor support level at 132.01 (April 13), and the April low at 130.62 (April 5). The loss of the latter could potentially pave the way for a decline towards the March low of 129.63 (March 24) and the February low of 128.08 (February 8). The daily RSI ticked higher to the boundaries of 62.
Resistance levels: 140.20 140.45 140.93 (4H chart)
Support levels: 138.75 138.42 137.65 (4H chart)
GBPUSD
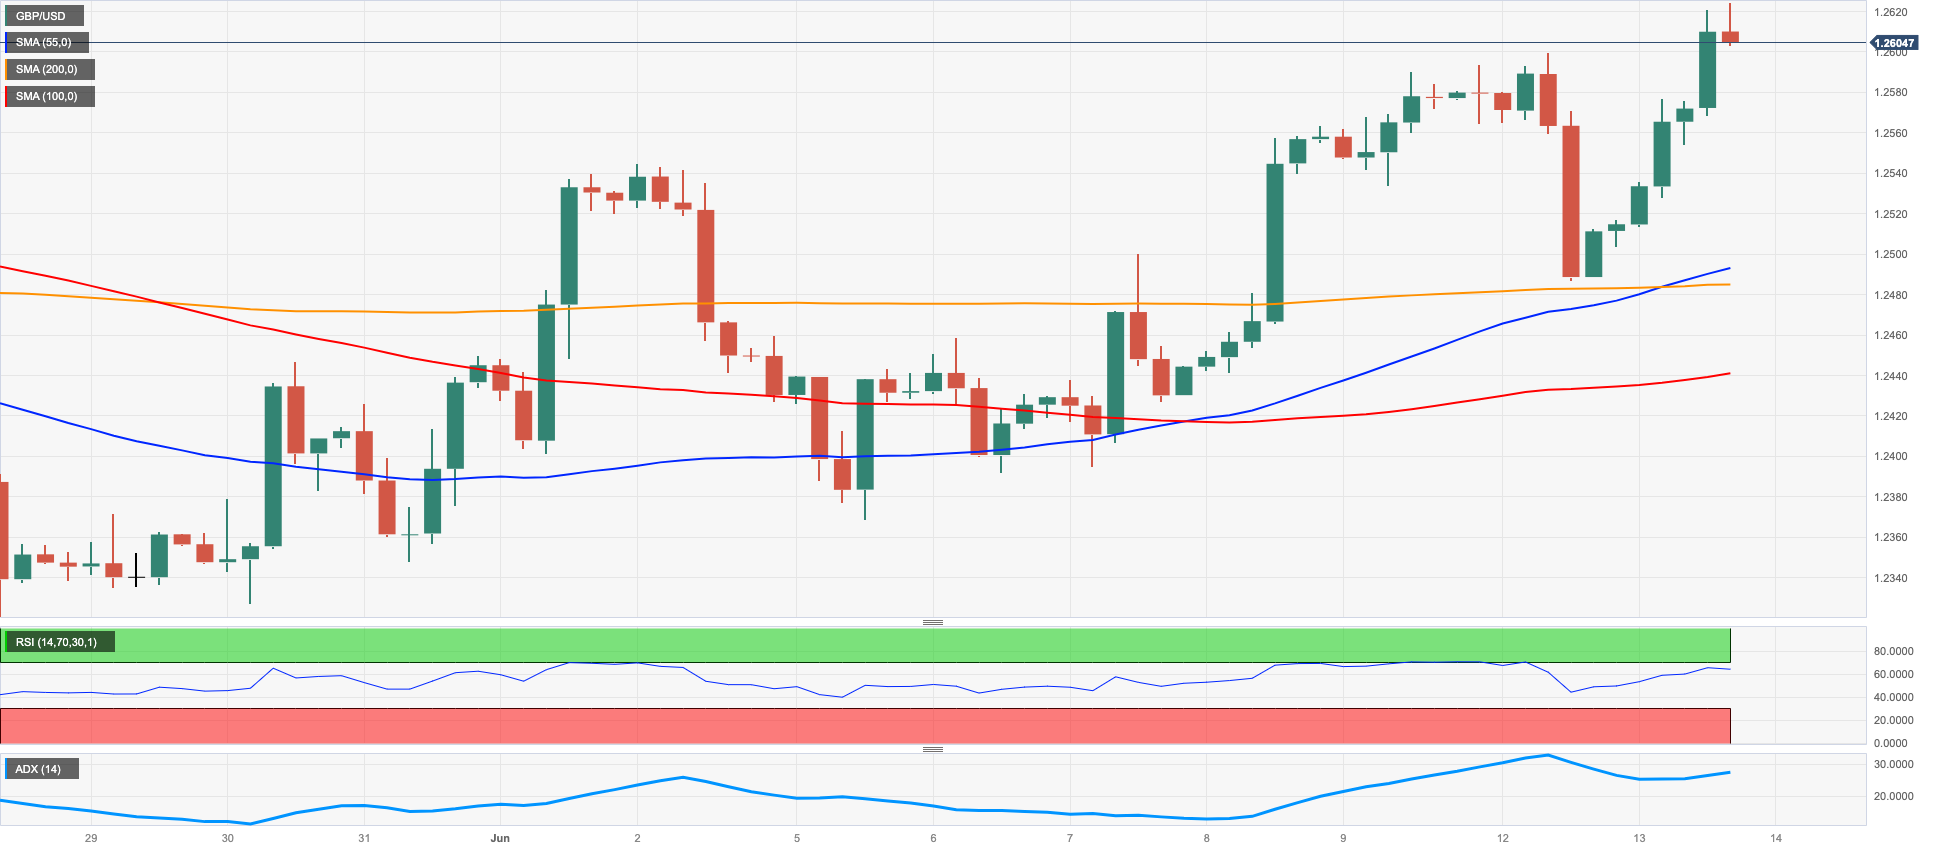
GBP/USD regained its smile and quickly left behind Monday’s pullback, advancing to fresh tops just above the 1.2600 barrier, where the key 2022-2023 resistance line sits.
Indeed, Cable picked up further pace on the back of the intense sell-off in the greenback, particularly exacerbated following the release of US inflation figures and a firmer conviction of a pause in the Fed’s tightening campaign on Wednesday.
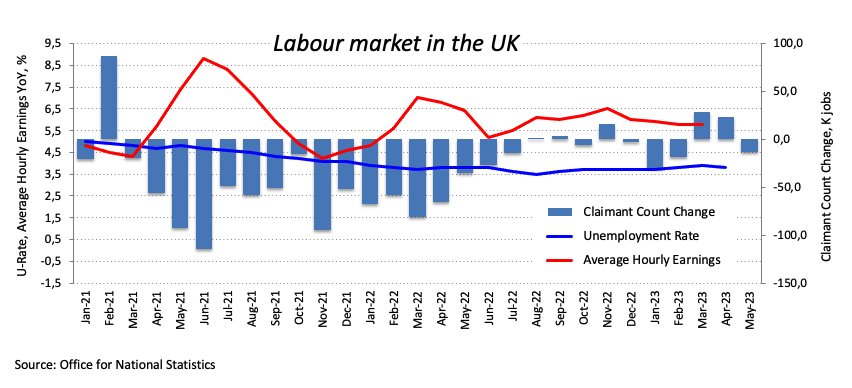
Extra support for the quid came after auspicious prints from the UK labour market report, where Employment Change rose by 250K people in March and the Unemployment Rate ticked lower to 3.8% in April. In addition, the Average Earnings inc. Bonus rose 6.5% YoY in the 3-month to April and the Claimant Count Change shrank by 13.6K people in May.
The strong advance in the pair also echoed in the UK money market, where the 10-year Gilt yields rose to monthly highs past the 4.45% level.
Around the BoE, Governor A. Bailey reported that the bank had incorporated greater inflation persistence into their models. He noted that food inflation was taking a longer time to decrease compared to their initial expectations. Additionally, he mentioned that while inflation is expected to decrease, the process will require a longer period.
These better-than-estimated readings did nothing but reinforce the prospects for further rate hikes by the BoE, starting with another quarter-point increase at next week’s event.
In order for GBP/USD to maintain its upward momentum, it needs to exceed the June top at 1.2605 (June 13). If it manages to do so, its next targets would be the 2023 peak at 1.2679 (May 10), followed by the 200-week SMA at 1.2871, and eventually the psychological threshold of 1.3000. On the other hand, immediate contention emerges at the May low of 1.2308 (May 25), which remains propped up by the proximity of the interim 100-day SMA (1.3211) and the April low of 1.2274 (April 3). Further downward movement would encounter crucial support at the 200-day SMA at 1.2024 before the 2023 low at 1.1802 (March 8). The day-to-day RSI rose past the 60 mark.
Resistance levels: 1.2624 1.2679 1.2772 (4H chart)
Support levels: 1.2486 1.2368 1.2347 (4H chart)
AUDUSD
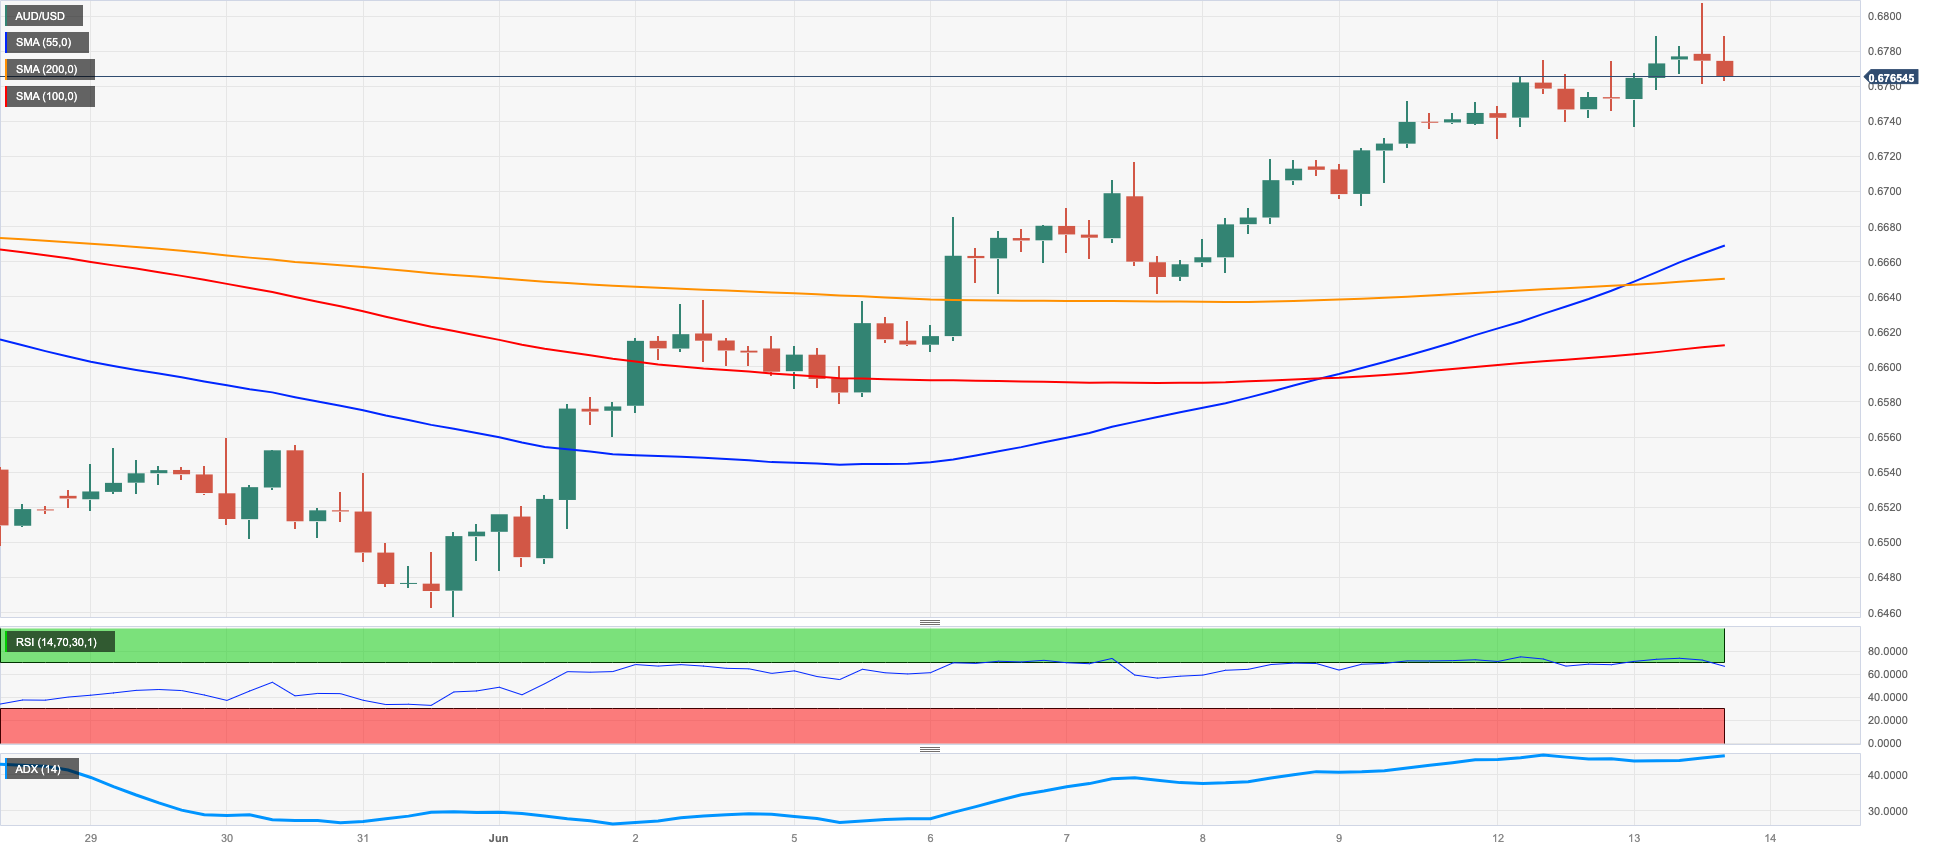
Further downside pressure hurt the greenback and sponsored the fourth consecutive daily advance in AUD/USD on turnaround Tuesday, this time briefly trespassing the key 0.6800 hurdle.
In fact, the Aussie dollar gathered extra steam in response to the favourable context in the risk complex as well as the generalized upbeat mood in the commodity universe, despite the fact that prices of iron ore retreated from Monday’s multi-week highs.
In Oz, the Consumer Confidence Index tracked by Westpac improved marginally to 79.2 in June (from 79.0).
Extra gains in AUD/USD are expected to challenge the May peak of 0.6818 (May 10) before eventually reaching the psychological milestone of 0.7000. Other noteworthy targets to bear in mind include the weekly high of 0.7029 (February 14) ahead of the 2023 top at 0.7157 (February 2). On the downside, the next support of note appears at the 200-day SMA at 0.6689 prior to the 2023 low of 0.6458 (May 31). Down from here emerges the weekly low of 0.6386 (November 10, 2022) before the November 2022 low of 0.6272 (November 3). The everyday RSI climbed past the 63 area.
Resistance levels: 0.6806 0.6818 0.6920 (4H chart)
Support levels: 0.6692 0.6641 0.6579 (4H chart)
GOLD
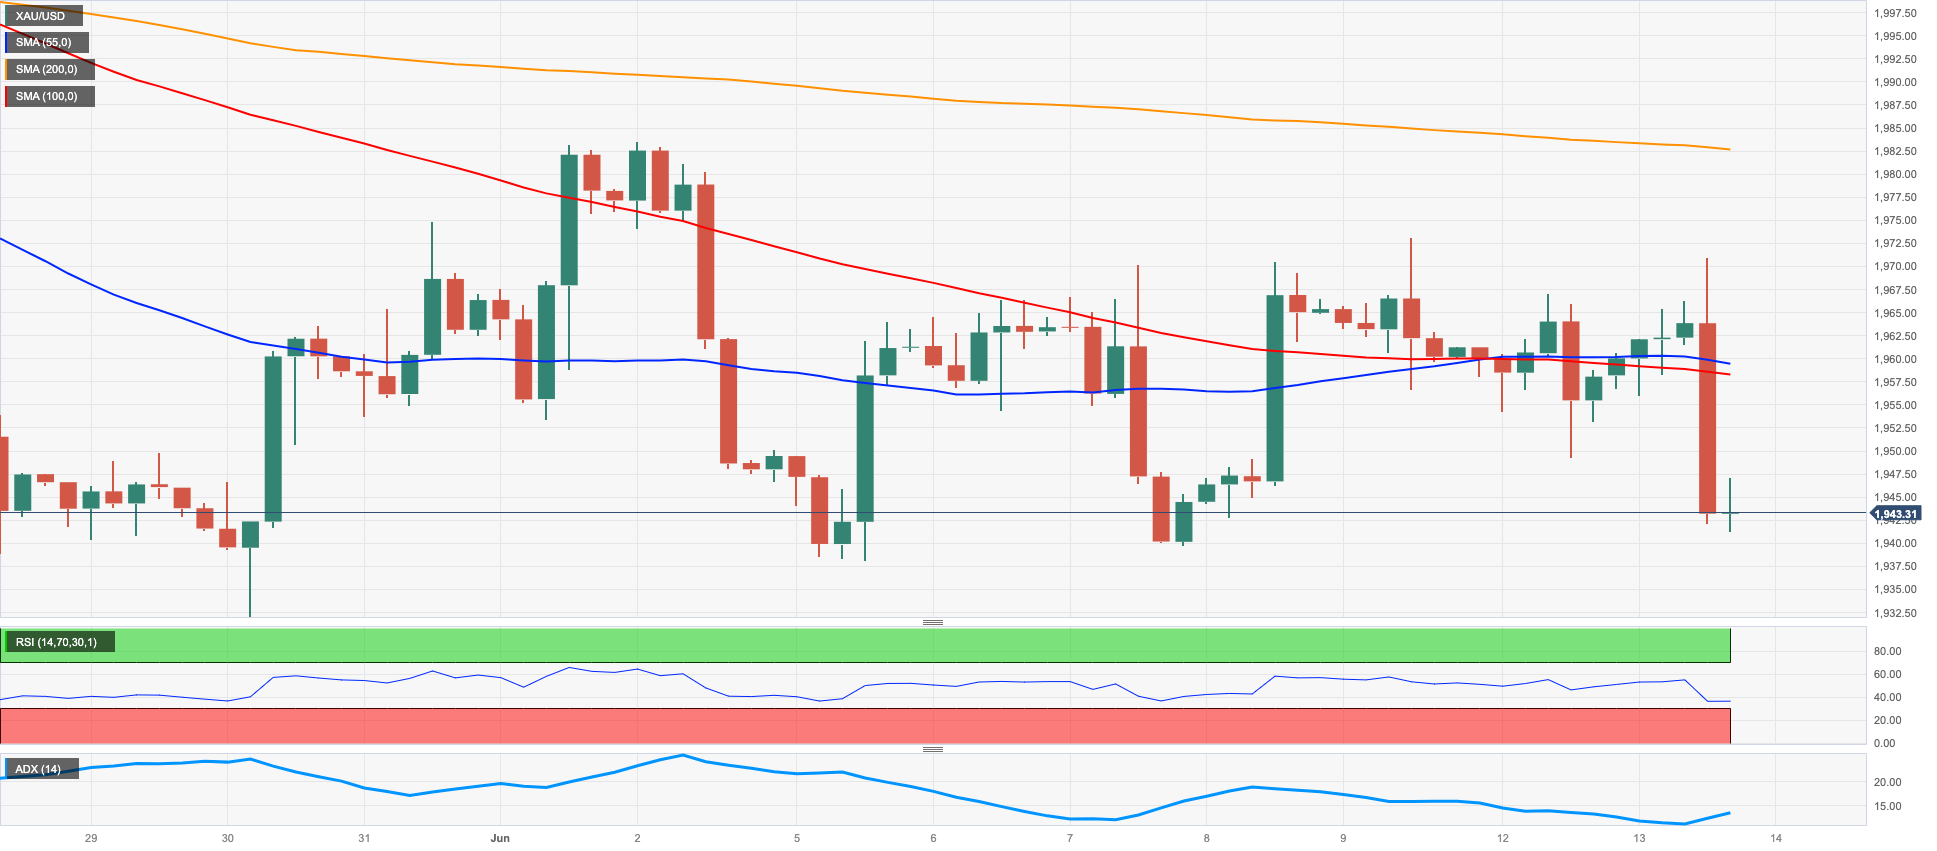
Further weakness in the yellow metal dragged prices to 3-day lows near the $1940 zone per ounce troy on Tuesday.
The continuation of the leg lower in bullion came despite the greenback's acceleration of its decline to new multi-week lows when gauged by the USD Index (DXY), although the marked rebound in US yields across the curve seems to have weighed further on the precious metal.
Moving forward, gold is expected to closely follow the next FOMC and ECB interest rate decisions on Wednesday and Thursday, respectively. So far, a pause in the Fed’s hiking cycle is largely priced in, as is a 25 bps rate hike by the ECB.
Gold is currently trading within a narrow range of prices, and it remains uncertain when it will break out of this consolidation. If it does break out, it could potentially challenge the June high of $1983 and reach the significant milestone of $2000, with no major resistance levels until it reaches the 2023 top of $2067 (May 4), the 2022 peak of $2070 (March 8), and the all-time record of $2075 (August 7, 2020). On the downside, the immediate support level is the May low of $1932, followed by the 200-day SMA at $1843 and the 2023 low of $1804 on February 28.
Resistance levels: $1973 $1985 $2022 (4H chart)
Support levels: $1942 $1932 $1885 (4H chart)
CRUDE WTI
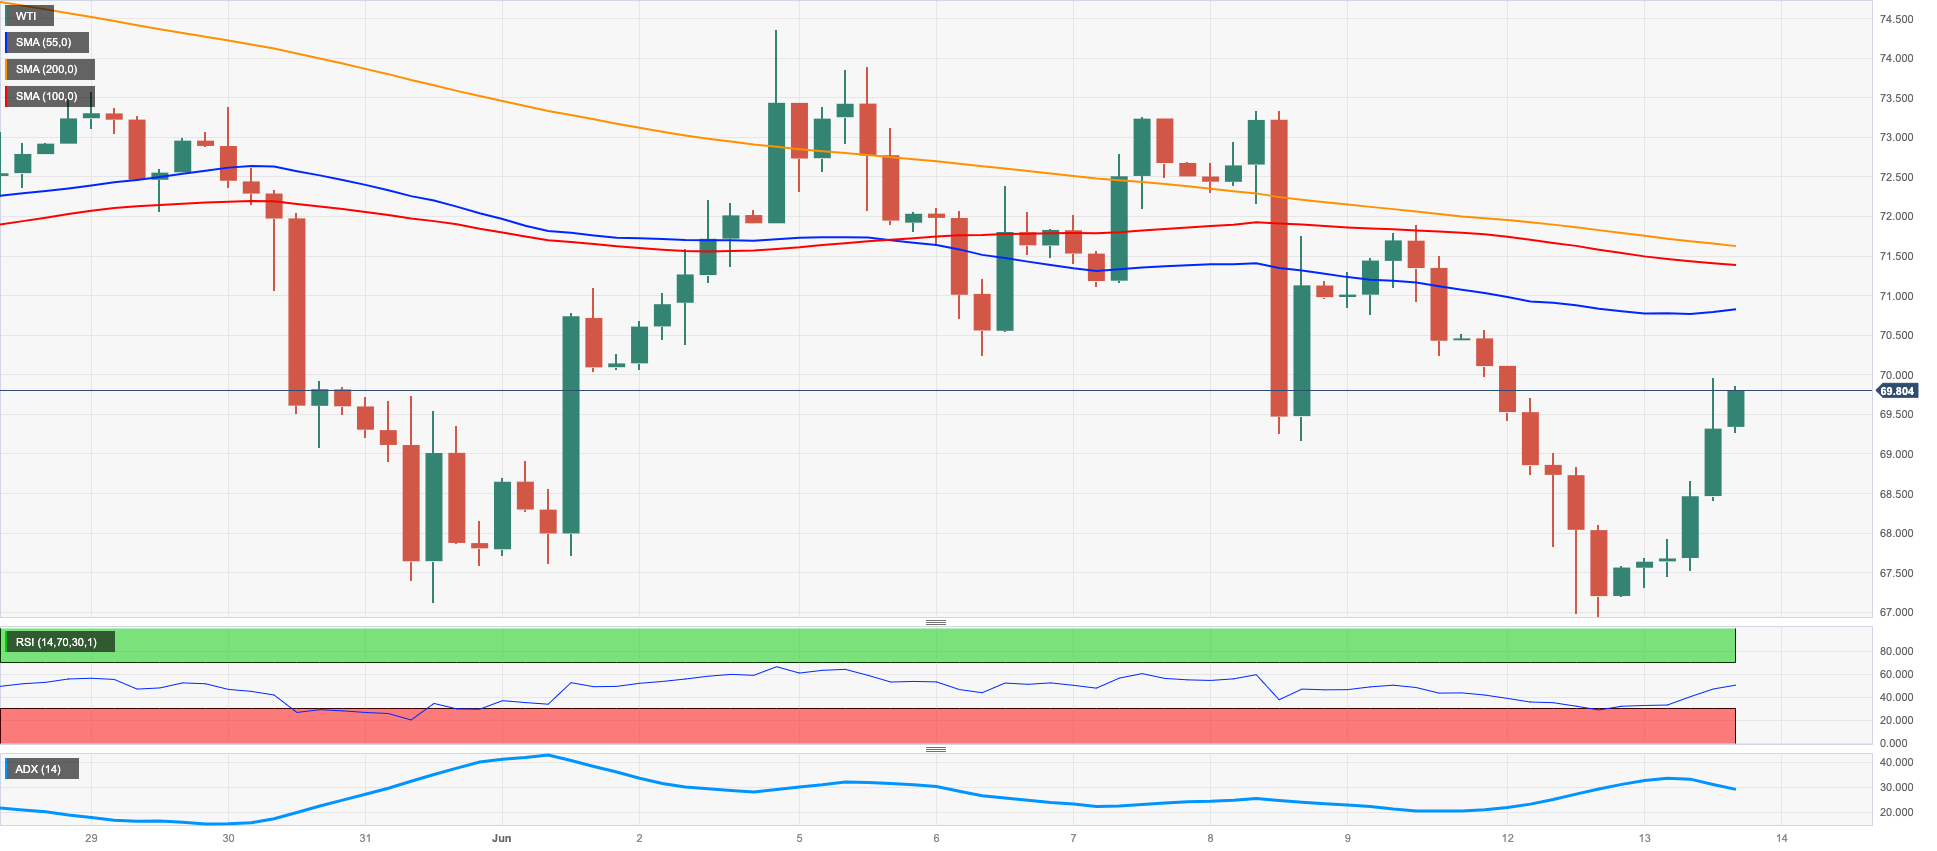
WTI prices rebounded markedly and refocused on the key $70.00 mark per barrel after bottoming out at fresh monthly lows in the sub-$67.00 region on Monday.
In fact, the commodity regained its smile after the PBoC reduced the short-term interest rate to underpin the so-far uneven economic recovery in the aftermath of the coronavirus pandemic. The unexpected move by the Chinese central bank was the first one since August 2022.
Extra strength for the commodity followed the sharp decline in the greenback as well as the firm conviction that the Fed might skip a move on the interest rate at its meeting on Wednesday.
Later in the session, the API will release its report on US crude oil stockpiles in the week leading up to June 9.
A more sustainable rebound in WTI is expected to retest the June high of $74.92 (June 5), which is just ahead of the 100-day SMA at $75.01 and the important 200-day SMA at $78.60. Moving upward, the weekly top of $79.14 (April 24 )is followed by the key barrier of $80.00 per barrel and the 2023 peak of $83.49 (April 12), with the November 2022 high of $93.73 on November 7 following. Contrarily, the next support aligns at the June low of $66.86 (June 13). A deeper drop from here might target the 2023 bottom of $63.61 (May 4) before the December 2021 low of $62.46 (December 2) and the key level of $60.00 per barrel.
Resistance levels: $69.79 $71.67 $73.24 (4H chart)
Support levels: $66.77 $63.61 $62.42 (4H chart)
GER40
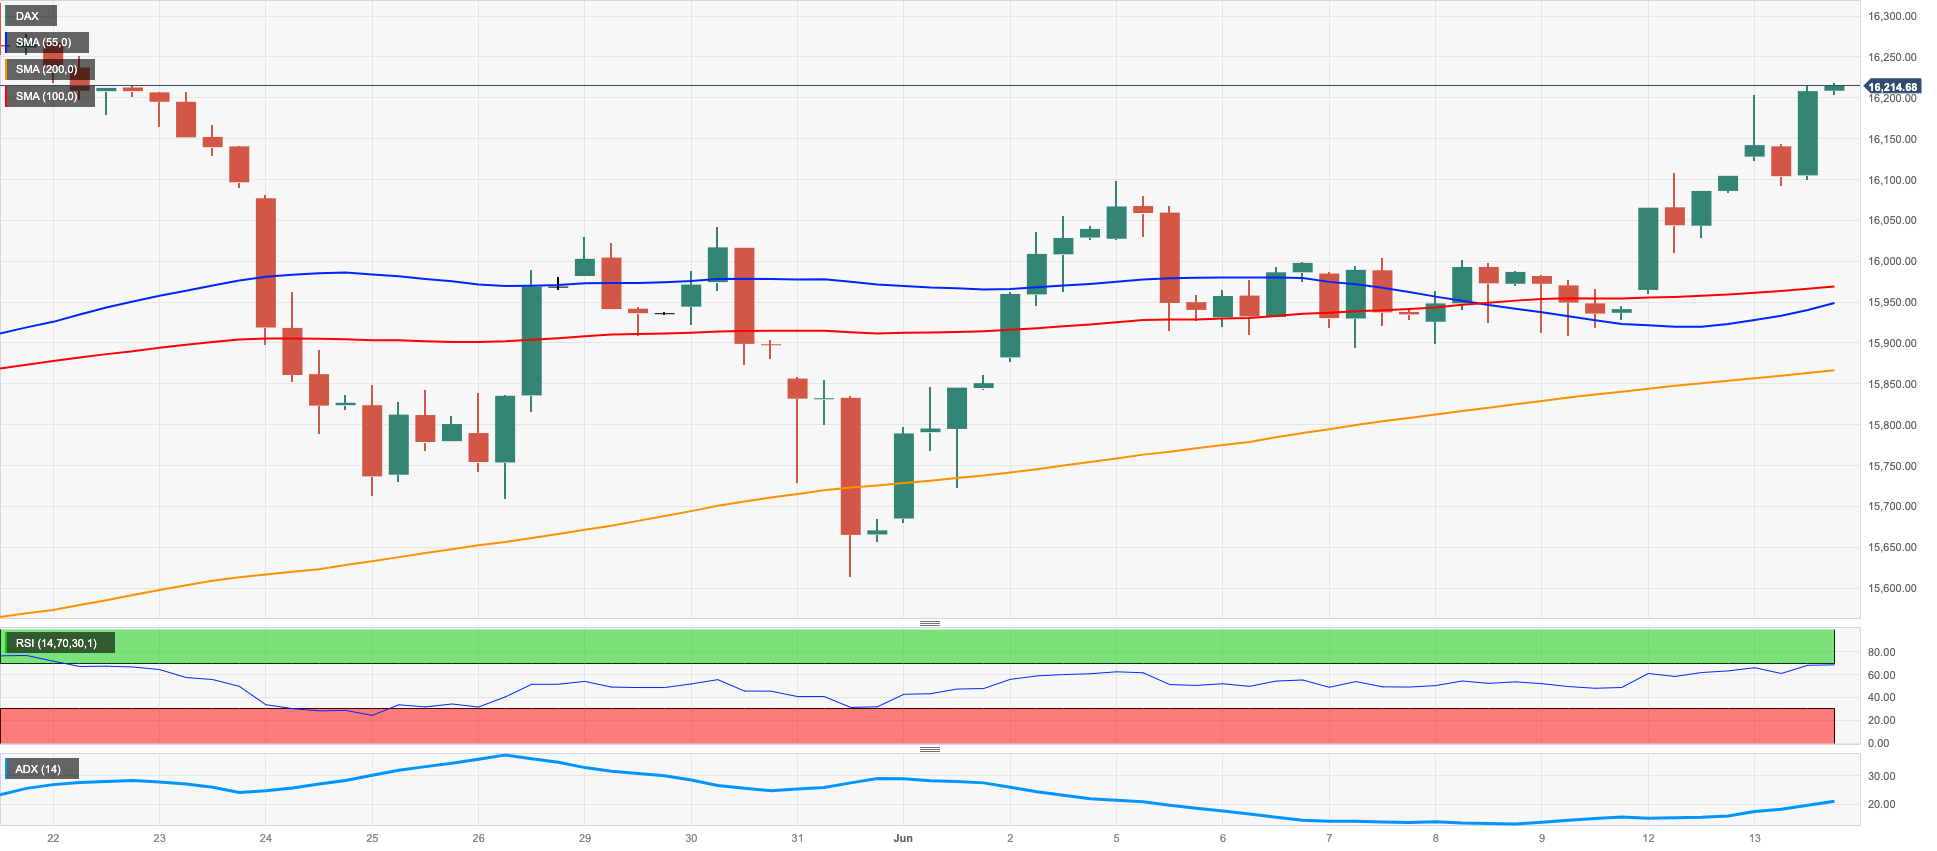
German equities tracked by the DAX40 reference index added to Monday’s promising session and closed at 3-week highs around the 16200 region, at shouting distance from the all-time high recorded on May 19 (16331).
Optimism among market participants surged in response to further signals of the continuation of the downtrend in US inflation, which in turn supported the expected pause in the hiking cycle by the Fed at its meeting on Wednesday.
Around the ECB, investors already anticipate a quarter-point rate raise on Thursday, while a similar move seems to be favouring July for the time being.
In line with their American peers, 10-year bund yields rose to 2-day highs around 2.45%.
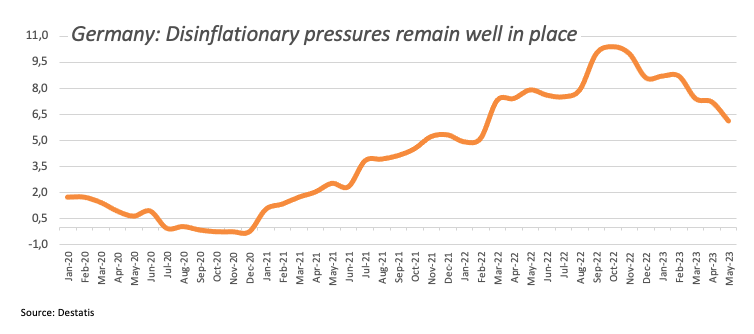
In Germany, the Current Account surplus narrowed to €21.8B in April, while final inflation figures saw the CPI rise 6.1% YoY in May and contract 0.1% MoM. Finally, the Economic Sentiment measured by the ZEW survey improved a tad to -8.5 for the month of June.
The DAX40 recorded a new June top at 16232 (June 13). Further up comes the all-time high of 16331 (May 19). Occasional bearish attempts should initially target the temporary 55-day SMA at 15818 followed by the May low of 15629 (May 31) and the interim 100-day SMA at 15582. Further south, the emphasis shifts to the April low of 15482 (April 5), ahead of a rather shaky support level at 14809 (March 24) and the crucial 200-day SMA at 14587. The March low of 14458 (March 20) is further south. The daily RSI improved further and approached the 61 level.
Best Performers: Covestro, Zalando SE, Adidas
Worst Performers: Vonovia, Siemens Energy AG, Symrise AG
Resistance levels: 16232 16331 17000? (4H chart)
Support levels: 15818 15629 15482 (4H chart)
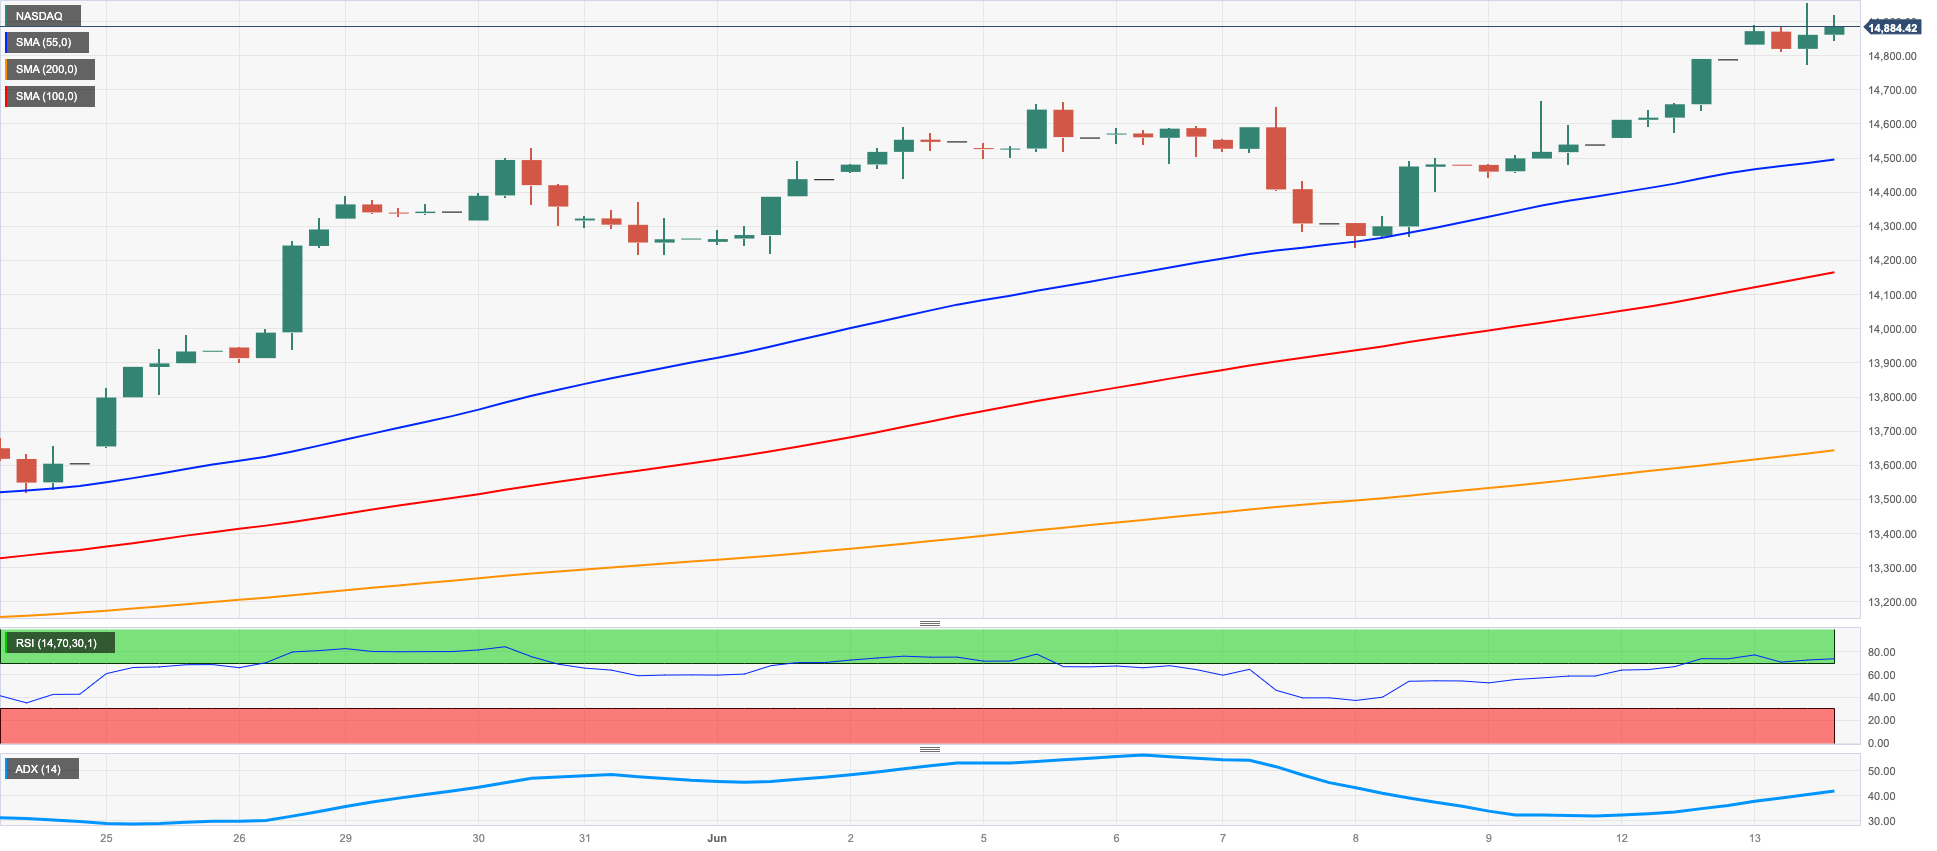
NASDAQ
Another day, another high in the tech benchmark Nasdaq 100.
Indeed, the leading index for the US tech sector rose to the vicinity of the key 15000 mark on Tuesday, an area last seen in early April 2022.
Furthermore, the index rose for the third consecutive session on the back of the solid performances of Amazon, Tesla, and Apple (which reached fresh all-time peaks), while the persistent sell-off in the greenback and expectations of an ‘on-hold’ outcome at the Fed’s gathering on Wednesday also contributed to the daily advance in the index.
If the Nasdaq 100 index manages to surpass its 2023 high of 14931 (June 13), it could potentially continue its upward trend and reach the March 2022 peak at 15265 (March 29), with the next significant level to watch being 16000. On the other hand, the immediate support levels to keep an eye on include the weekly low of 13520 (May 24), followed by the transitory 55-day SMA at 13474 and the May low of 12938 (May 4), which is supported by the temporary 100-day SMA at 12931. Before reaching the 2023 low of 10696 (January 6), there are several support levels to consider, such as the April low of 12724 (April 25), the 200-day SMA at 12204, the March low of 11695 (March 13), and the weekly lows of 11550 (January 25) and 11251 (January 26). The daily RSI remained well in the overbought territory near 75.
Top Gainers: Rivian Automotive, Lucid Group, NXP
Top Losers: Biogen, MercadoLibre, GE Healthcare
Resistance levels: 14931 15161 15265 (4H chart)
Support levels: 14283 13938 13520 (4H chart)
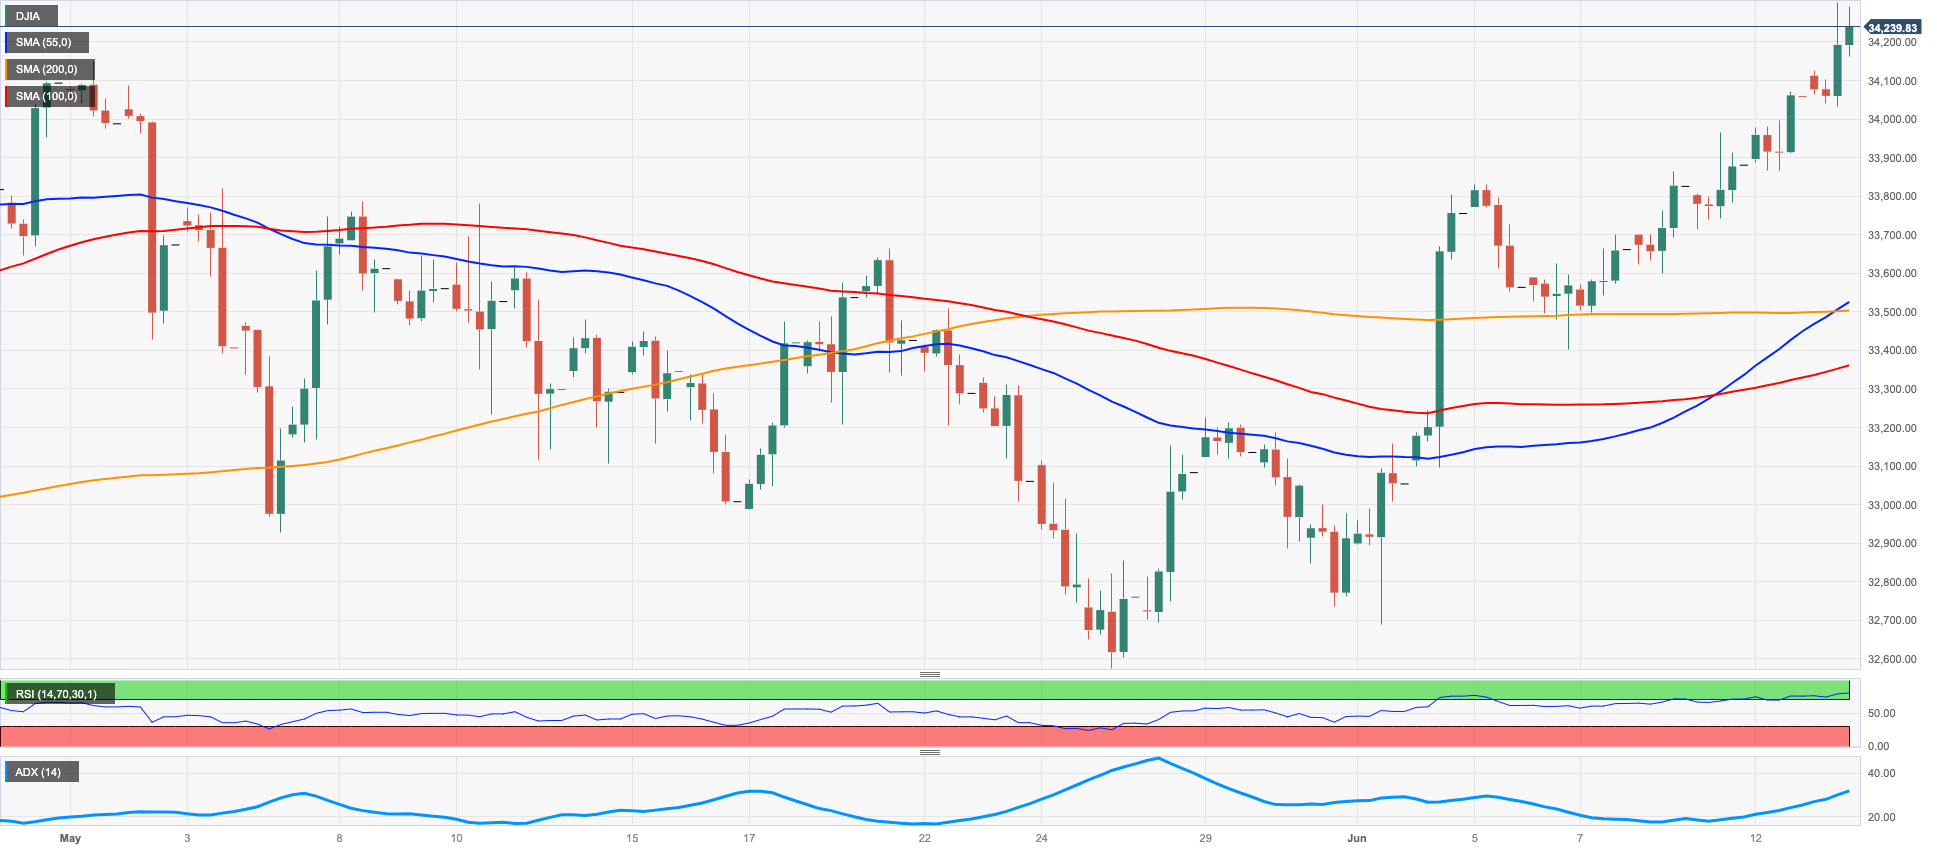
DOW JONES
The lower-than-expected US inflation figures during the month of May underpinned the likelihood of a pause in the Fed’s tightening programme on Wednesday, reigniting optimism among investors and lifting the US benchmark Dow Jones to new 4-month peaks north of the 34000 mark on Tuesday.
Indeed, the index extended its positive streak for the sixth session on Tuesday, bolstered as well by the weak tone in the greenback and the generalized bid bias in the US markets.
On the whole, the Dow Jones gained 0.57% to 34259, the S&P500 advanced 0.74% to 4370, and the tech-heavy Nasdaq Composite rose 0.80% to 13569.
The Dow Jones is anticipated to sustain its upward momentum, but breaching the June high of 34310 (June 13) is likely to shift focus to the 2023 peak at 34342 (January 13), ahead of the December 2022 top at 34712 (December 13). If the index successfully surpasses this level, the next target to consider would be the April 2022 peak at 35492 (April 21). On the opposite side, there are interim support levels at the 55-day and 100-day SMAs at 33476 and 33341, respectively, prior to the key 200-day SMA at 32776, followed by the May low at 32586 (May 25) and the 2023 low at 31429 (March 15). In the event of further decline, the next significant support level would be the 2022 low at 28660 (October 13). The daily RSI rose past the 65 level.
Top Performers: Caterpillar, Dow, Intel
Worst Performers: Salesforce Inc, Visa A, Apple
Resistance levels: 34310 34712 35492 (4H chart)
Support levels: 33399 33331 32586 (4H chart)
MACROECONOMIC EVENTS

All Information & Updates provided by:

All information relating to the financial markets available on this page has been prepared and issued by FXStreet (Forexstreet SL, Spain, Reg: B62498233) on the basis of publicly available information and all information believed to be reliable and does not conflict with Kuwaiti local laws, and all necessary care has been taken to before the company to ensure that the facts mentioned are correct from the source.
NCM Investment nor any of its directors or employees shall in any way be held responsible for the contents of this news, and the information contained on this page is intended only to provide clients with publicly available information and should not be construed as investment advice, report or analysis and/or constitute an offer or invitation to buy or sell financial instruments of any kind.
RISK WARNING: Forex and CFDs are highly risky leveraged products, as losses can exceed deposits. Please ensure you understand all the risks and take independent advice if necessary. NCM will segregate the clients based on the criteria of the regulator and its bylaws. NCM does not provide any advisory service; the material published does not constitute advice or a recommendation for a transaction in any financial instrument. NCM accepts no responsibility for any use of the content presented and any consequences of that use. Anyone acting on the information provided does so at their own risk.