
- Contact Us:
-

-

-

-


Daily Market Updates
15 Jun 2023
USDJPY
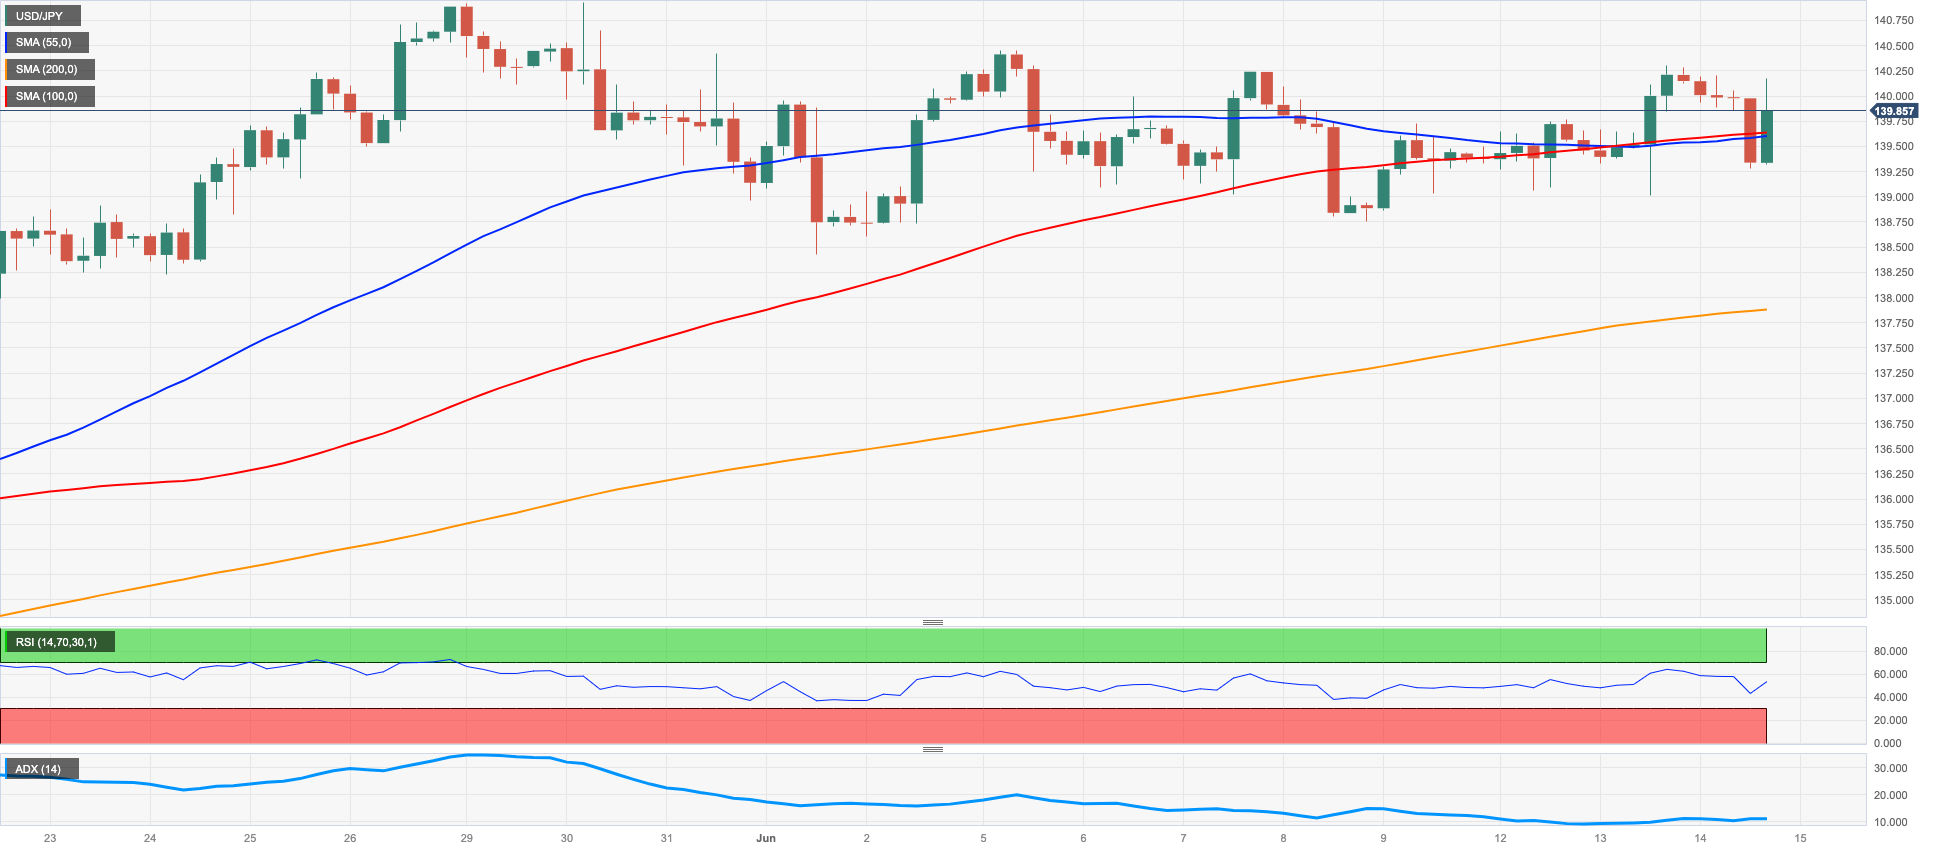
USD/JPY came under some renewed downside pressure and gave away part of the weekly advance on Wednesday, returning to the sub-140.00 region in the wake of the FOMC event.
Indeed, the selling interest in the pair gathered further steam on the back of the intense sell-off in the greenback and the decline in US yields in the 10y-30y segment, particularly following the ‘on-hold’ stance by the Federal Reserve at its event on Wednesday.
Meanwhile in Japan, the JGBP 10-year yields kept the side-lined fashion well in place around 0.42%.
If USD/JPY pair manages to break out of its present consolidation phase, it is expected to test the 2023 top of 140.93 (May 30) as well as the weekly highs of 142.25 (November 21, 2022) and 151.94 (October 21). Immediate support, instead, is seen at the June low of 138.42 (June 1) prior to the significant 200-day SMA at 137.24 and the temporary 55-day and 100-day SMAs at 136.12 and 134.77, respectively. The weekly low of 133.01 (April 26) follows, ahead of a minor support level of 132.01 (April 13) and the April low of 130.62 (April 5). The loss of the latter might pave the way for a drop towards the March low of 129.63 (March 24) before the February low of 128.08 (February 8). The day-to-day RSI broke below the 58 mark.
Resistance levels: 140.30 140.45 140.93 (4H chart)
Support levels: 138.75 138.42 137.80 (4H chart)
GBPUSD
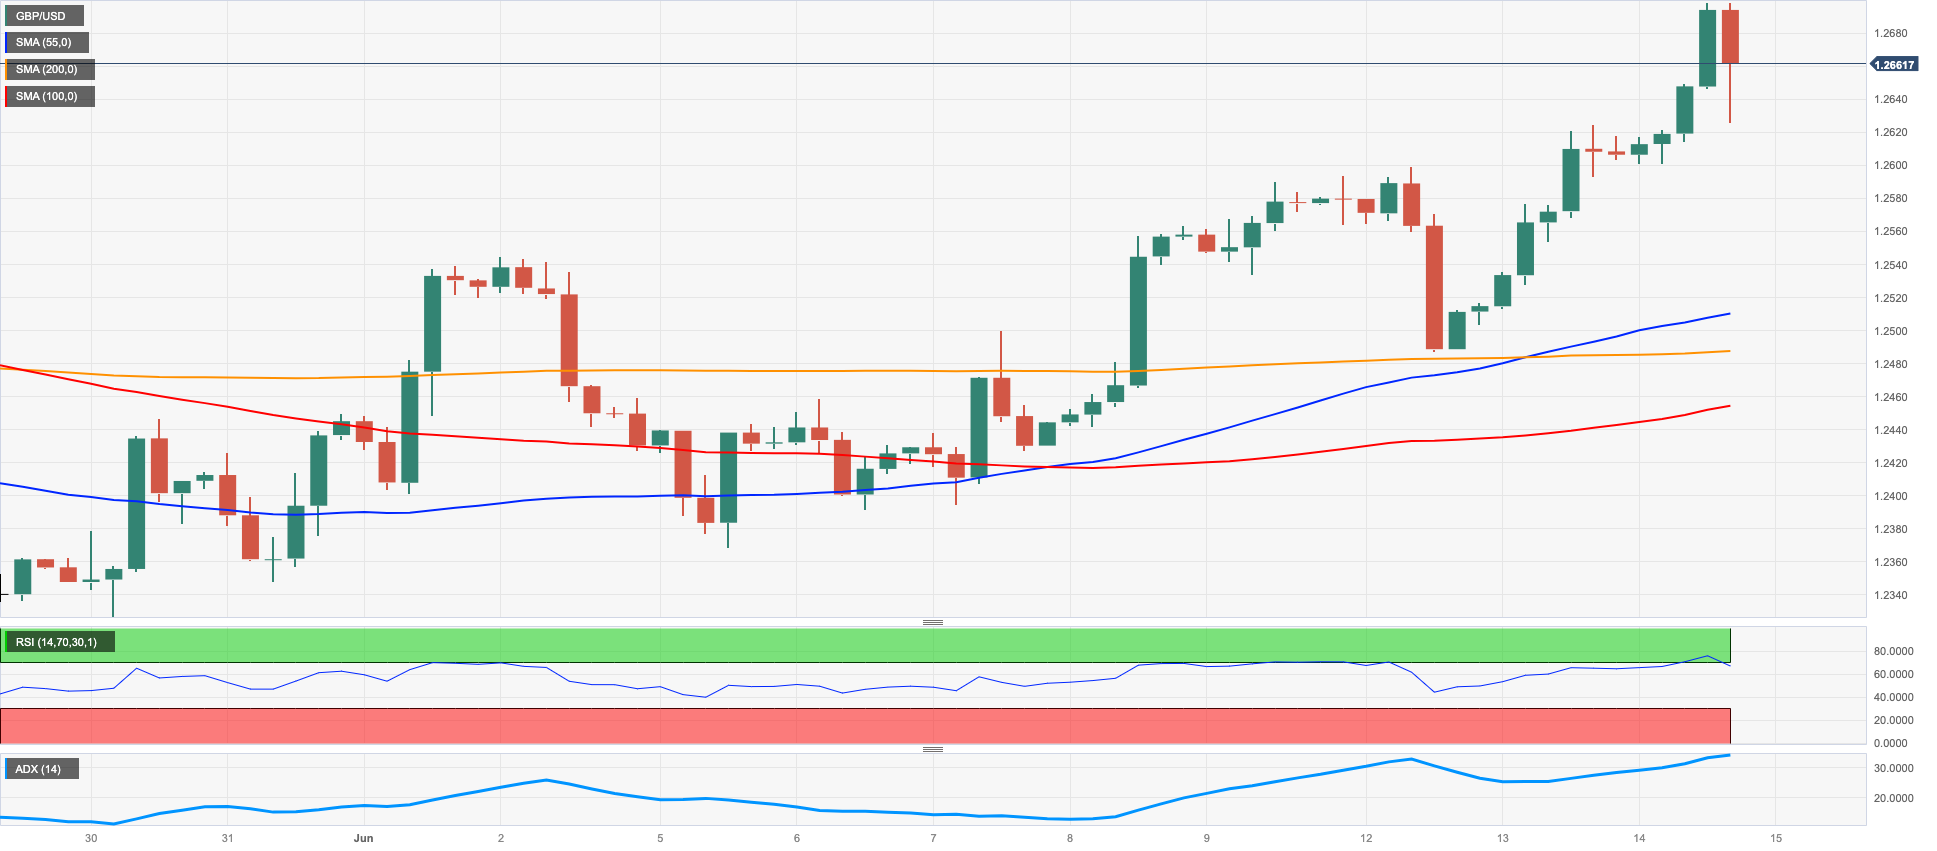
GBP/USD maintained the ongoing bullish bias well in place for the second session in a row and extended the march north to levels just shy of the 1.2700 hurdle on Wednesday, an area last traded in April 2022.
Another positive session in Cable came in tandem with the increasing selling pressure around the greenback, which in turn morphed into a deeper pullback in the USD Index (DXY) to fresh lows well in the sub-103.00 zone.
The move lower in the dollar, however, somewhat alleviated after the Fed stayed on the sidelines and left the interest rate unchanged at its event on Wednesday, as widely anticipated by market participants.
Busy day in the UK calendar saw the GDP 3-Month Average expand 0.1% in April, while the yearly GDP rose 0.5% in the same month. Additional results for the month of April showed Construction Output expanded 3.6% YoY, the trade surplus narrowed to £14.996B, Industrial Production contracted 1.9% from a year earlier and Manufacturing Production dropped 0.9% vs. the same month of 2022. Finally, the NIESR Monthly GDP Tracker came in flat in May.
GBP/USD recorded a new 2023 peak at 1.2698 on June 14. The surpass of this level should put a potential test of the 200-week SMA at 1.2871 back on the radar prior to the psychological level of 1.3000. Having said that, the pair faces immediate support at the May low of 1.2308 (May 25), as it is propped up by the nearby provisional 100-day SMA (1.2313) and the April low of 1.2274 (April 3). If the price continues to fall, it will encounter significant support at the 200-day SMA at 1.2030 before reaching the 2023 low at 1.1802 (March 8). The day-to-day RSI climbed above the 64 area
Resistance levels: 1.2698 1.2772 1.3089 (4H chart)
Support levels: 1.2486 1.2368 1.2347 (4H chart)
AUDUSD
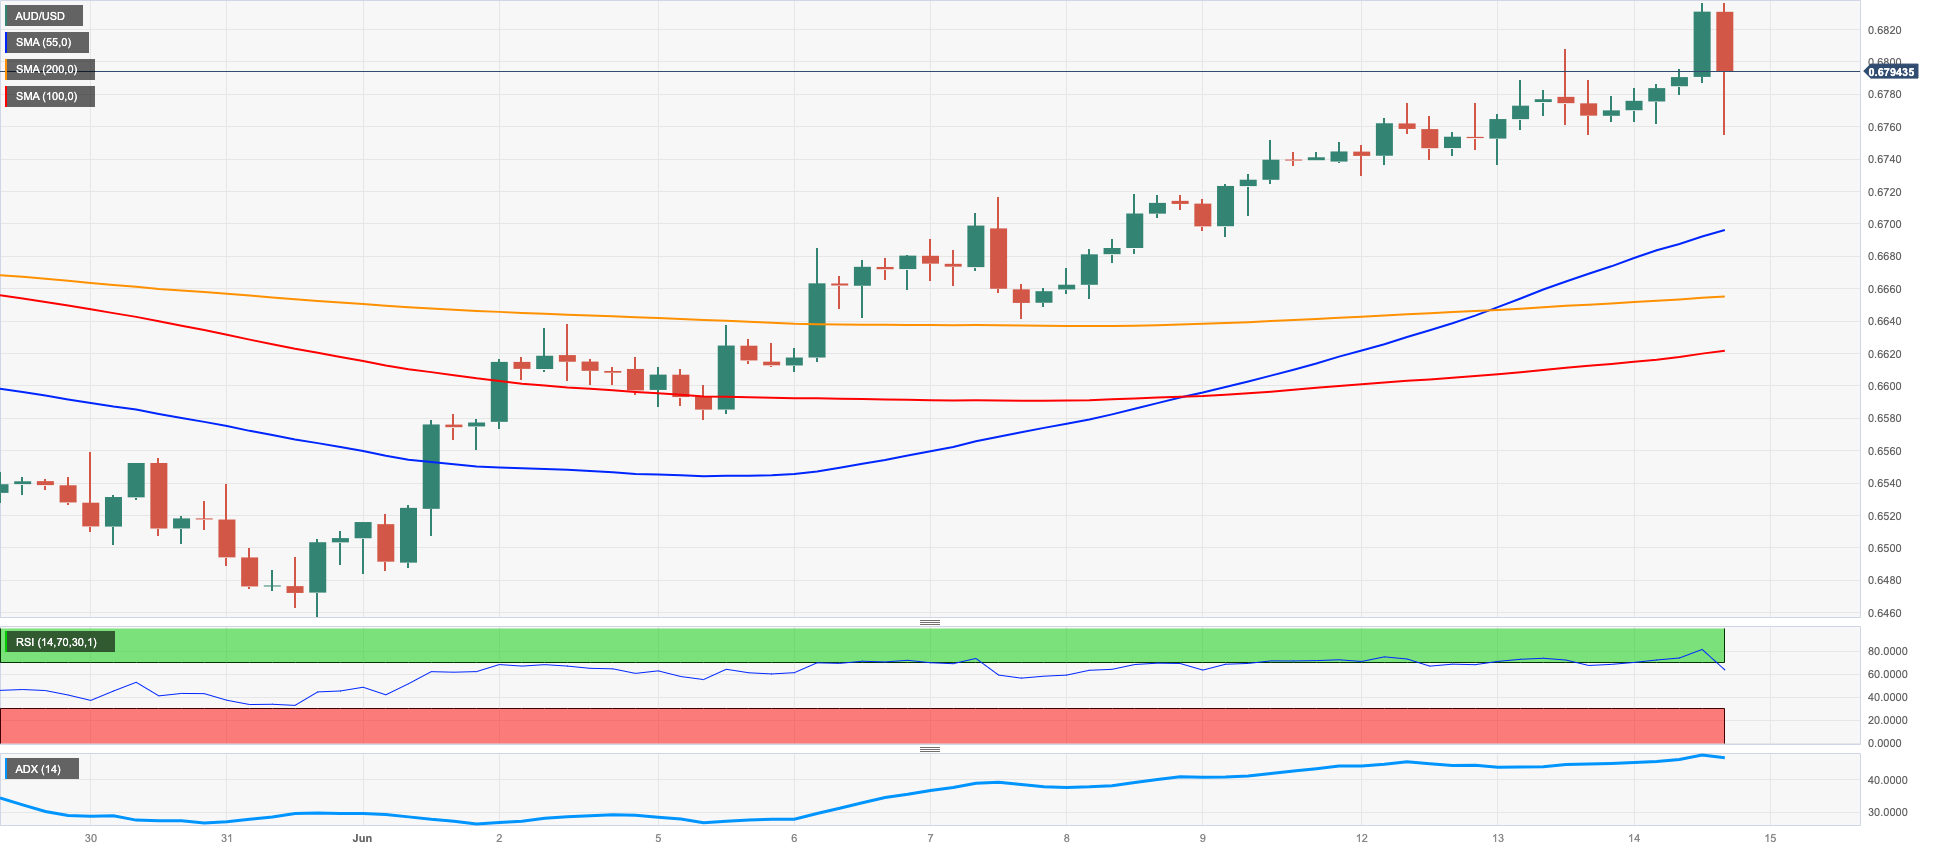
AUD/USD rose for the fifth consecutive session on Wednesday, this time surpassing the key 0.6800 mark on quite a convincing style to print new 4-month peaks.
Indeed, the marked daily decline in the greenback actually facilitated an additional upside momentum for spot, which received further support from the strengthening trend observed across the commodity universe.
On the latter, copper prices added to the previous daily gain and flirted with multi-week highs, while iron ore reversed the previous daily decline.
The Aussie docket was empty on Wednesday.
Further gains in AUD /USD are expected to challenge the June high of 0.6835 (June 14) and eventually reach the psychological milestone of 0.7000. Other notable targets include the weekly high at 0.7029 (February 14) and the 2023 top at 0.7157 (February 2). On the downside, the next notable support appears at the 200-day SMA at 0.6689 ahead of the 2023 low of 0.6458 (May 31). From here, the move is down to the weekly low of 0.6386 (November 10 2022) before reaching the November 2022 low at 0.6272 (November 3). The daily chart's RSI approached the 67 level.
Resistance levels: 0.6835 0.6920 0.7029 (4H chart)
Support levels: 0.6755 0.6692 0.6641 (4H chart)
GOLD
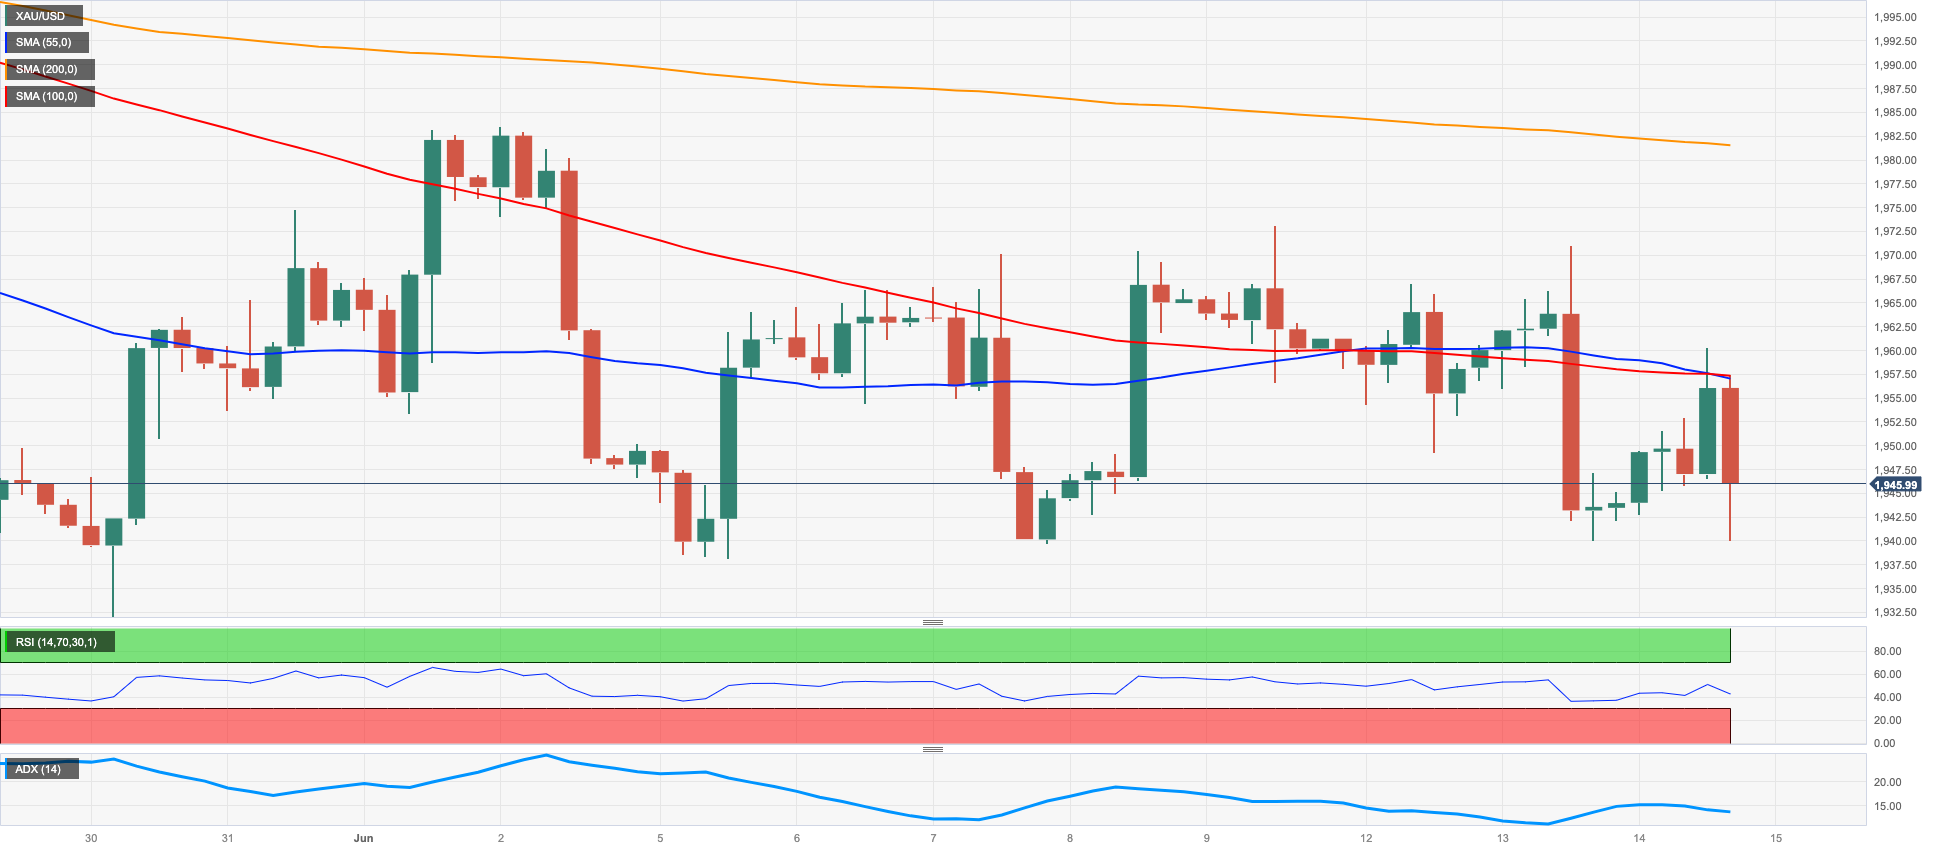
Finally, gold prices managed to reverse the recent downtrend and edged higher to the $1960 zone per troy ounce on Wednesday.
The marked recovery in the yellow metal came exclusively in response to the strong drop in the greenback, which was accentuated after the Fed signalled a pause in its tightening campaign at its gathering on Wednesday.
The mixed tone in US yields across the curve also lent legs to the precious metal and bolstered the corrective rebound midweek.
The next risk event for bullion comes at the ECB meeting on Thursday, where the bank is largely predicted to hike the policy rate by 25 bps, while a similar move in July still remains in the pipeline.
Gold is currently experiencing a period of consolidation. The timing of when it will break out of this pattern remains uncertain. However, if it does break out, it has the potential to challenge the June high of $1983 (June 2) and hit the significant milestone of $2000. There are no major resistance levels until it reaches the 2023 peak of $2067 (May 4), the 2022 top of $2070 (March 8), and the all-time record of $2075 (August 7, 2020). On the downside, the immediate support level is the May low of $1932 (May 30), seconded by the 200-day SMA at $1844, and the 2023 low of $1804 on February 28.
Resistance levels: $1973 $1985 $2022 (4H chart)
Support levels: $1942 $1932 $1885 (4H chart)
CRUDE WTI
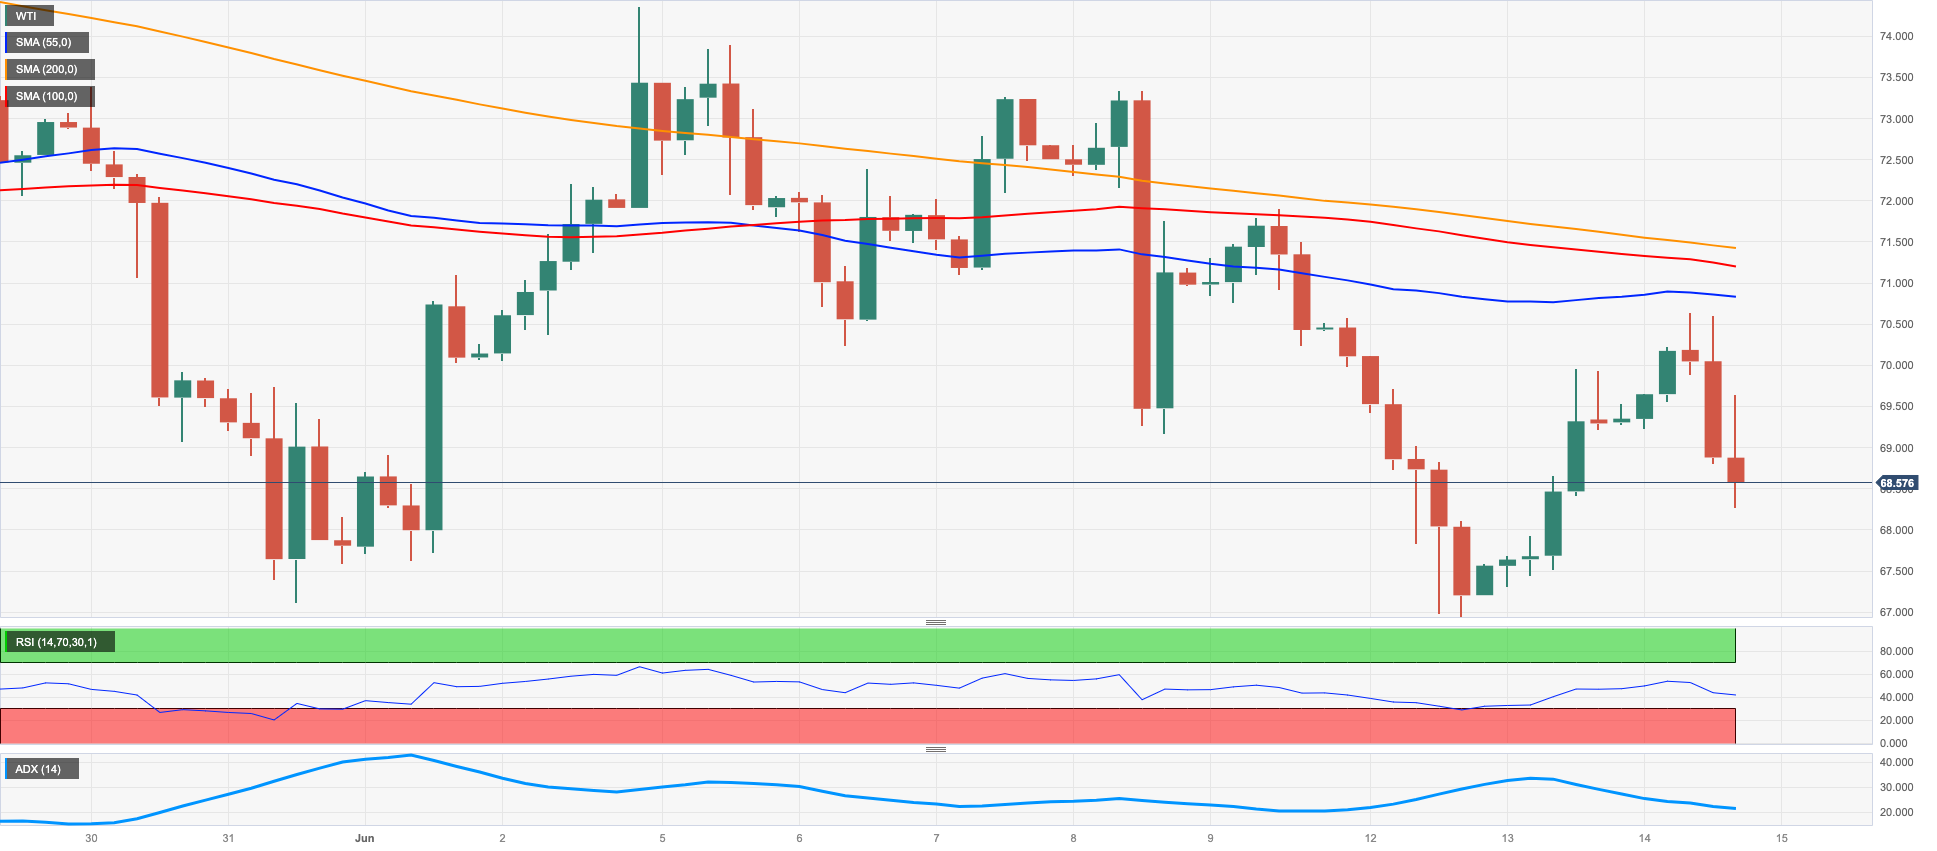
Prices of WTI briefly surpassed the key $70.00 mark per barrel and retreated afterwards, ending Wednesday’s session with moderated losses near the $68.00 mark per barrel.
The strong retracement in the greenback kept the commodity initially afloat amidst the unexpected large build in the weekly US inventories, as per the EIA report, although the perception that the Fed might not be done just yet regarding rate hikes reignited recession concerns and their direct impact on the demand for the commodity.
On the EIA report, the agency reported that US crude oil inventories unexpectedly increased by 7.919M barrels in the week to June 9, while supplies at Cushing went up by 1.554M barrels, Weekly Distillate Stocks rose by 2.123M barrels and gasoline stockpiles grew by 2.108M barrels.
Also in the oil calendar appeared the IEA’s monthly report, where the agency stated that they are raising the forecast for oil-demand growth in 2023 by 200 kbpd, bringing it to 2.4 mbpd. They also mentioned that the total demand is expected to rise to 102.3 mbpd and projected a 6% growth in oil demand between 2022 and 2028, reaching 105.7 mbpd. The report also highlighted that oil-demand growth is expected to slow down in 2024, with an estimated increase of 860 kbpd. This would result in a total demand of 103.1 mbpd. According to the IEA, 2024 will mark the conclusion of the post-pandemic demand recovery, with growth anticipated at 860,000 bpd. Furthermore, the IEA raised their oil-supply forecasts for 2023 by 200 kbpd, reaching 101.3 mbpd. The report also indicated their projection of a 1 mbpd increase in oil supply in 2024, bringing it to 102.3 mbpd.
WTI is projected to retest its June high of $74.92 (June 5), which is reinforced by the 100-day SMA and comes ahead of the crucial 200-day SMA at $78.51. Moving ahead, the weekly high of $79.14 (April 24) is followed by the critical barrier of $80.00 per barrel, the 2023 peak of $83.49 (April 12), and the November 2022 top of $93.73 (November 7). The next level of support, on the other hand, is at the June low of $66.86 (June 13). A deeper slide from here might target the 2023 low of $63.61 (May 4) before the December 2021 low of $62.46 (December 2) and the critical level of $60.00 per barrel.
Resistance levels: $70.44 $71.52 $73.24 (4H chart)
Support levels: $66.77 $63.61 $62.42 (4H chart)
GER40
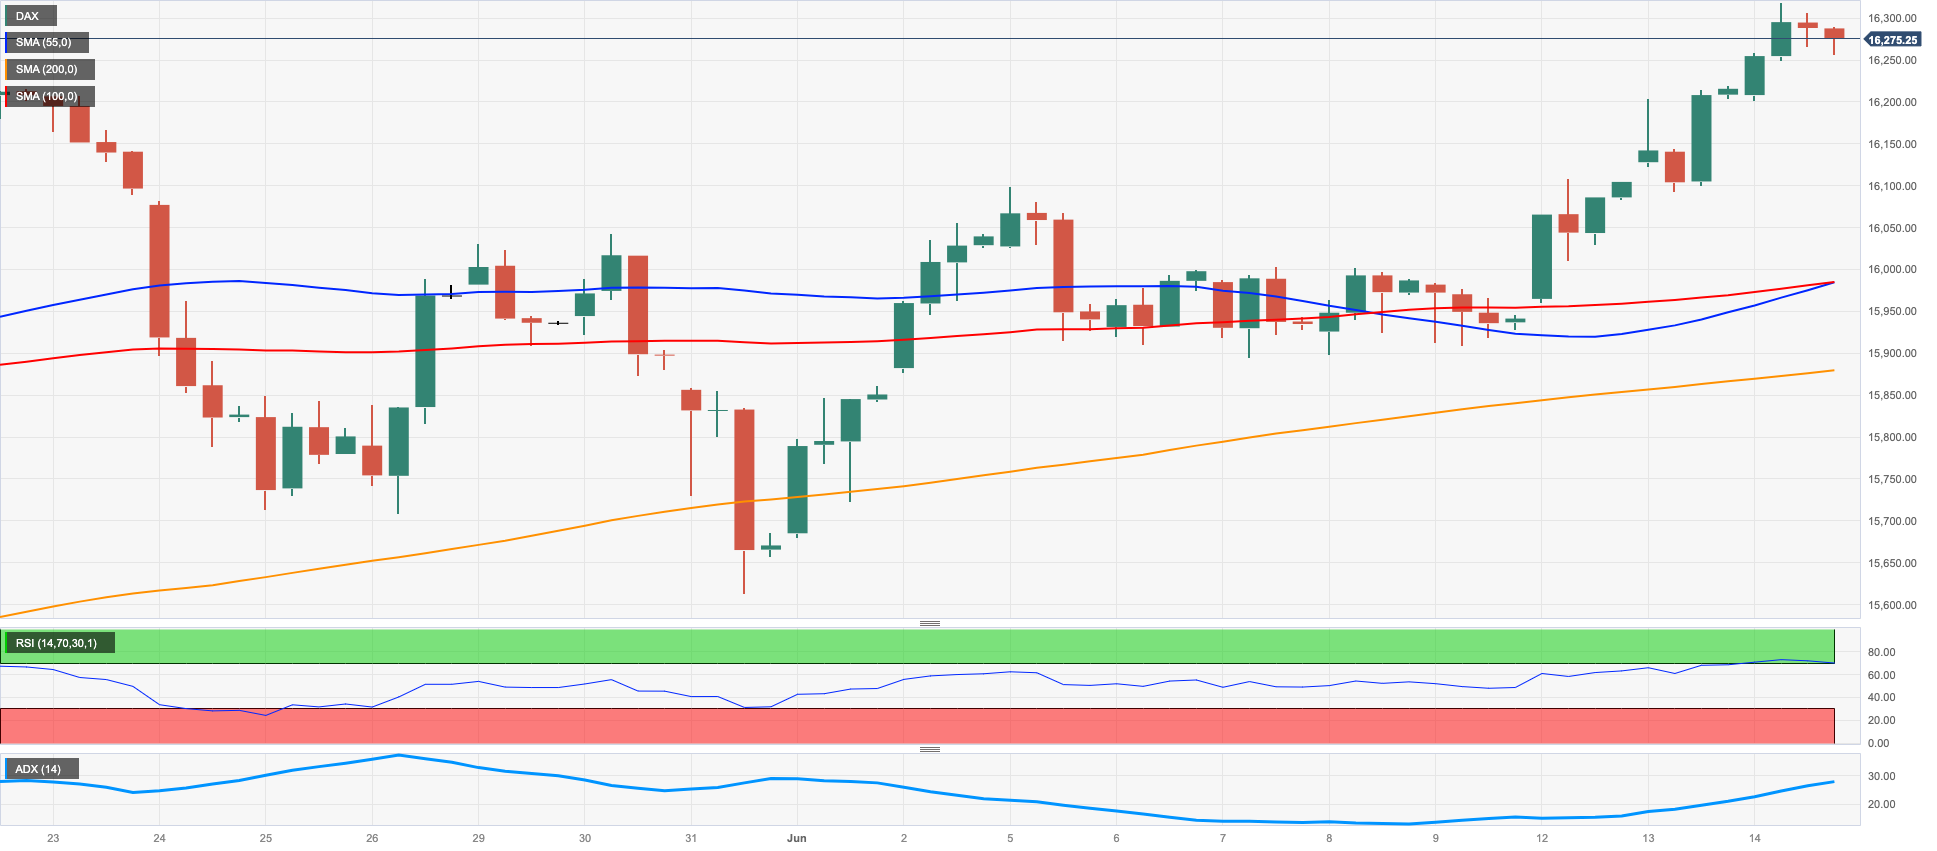
Germany’s DAX40 advanced further and clinched a new all-time high past the 16300 level on Wednesday amidst the generalized better mood in the European markets.
In the meantime, investors remained optimistic ahead of the most likely pause by the Federal Reserve and the largely anticipated quarter-point hike by the ECB on Thursday.
Back at the ECB, the presence of weaker economic data, combined with the notable easing in the energy markets and the recent, unexpectedly sharp decline in inflation, provides compelling grounds for advocating an expedited conclusion to the interest rate cycle.
In the meantime, the 10-year bund yields traded within an inconclusive range around 2.45%.
In the domestic docket, Wholesale Prices contracted at a monthly 1.1% in May and 2.6% from a year earlier.
The DAX40 reached a new all-time top at 16336 (June 14). In the event of occasional bearish attempts, the initial targets would be the temporary 55-day SMA at 15843, followed by the May low of 15629 (May 31), and the provisional 100-day SMA at 15595. If the market moves further downwards, the focus will shift towards the April low of 15482 (April 5), followed by a relatively uncertain support level at 14809 (March 24) and the critical 200-day SMA at 14606. Moving even lower, the March low of 14458 (March 20) comes into play. The daily RSI ticked higher past 63.
Best Performers: Zalando SE, Vonovia, Symrise AG
Worst Performers: MTU Aero, Henkel VZO, Covestro
Resistance levels: 16336 17000? (4H chart)
Support levels: 16004 15705 15629 (4H chart)
NASDAQ
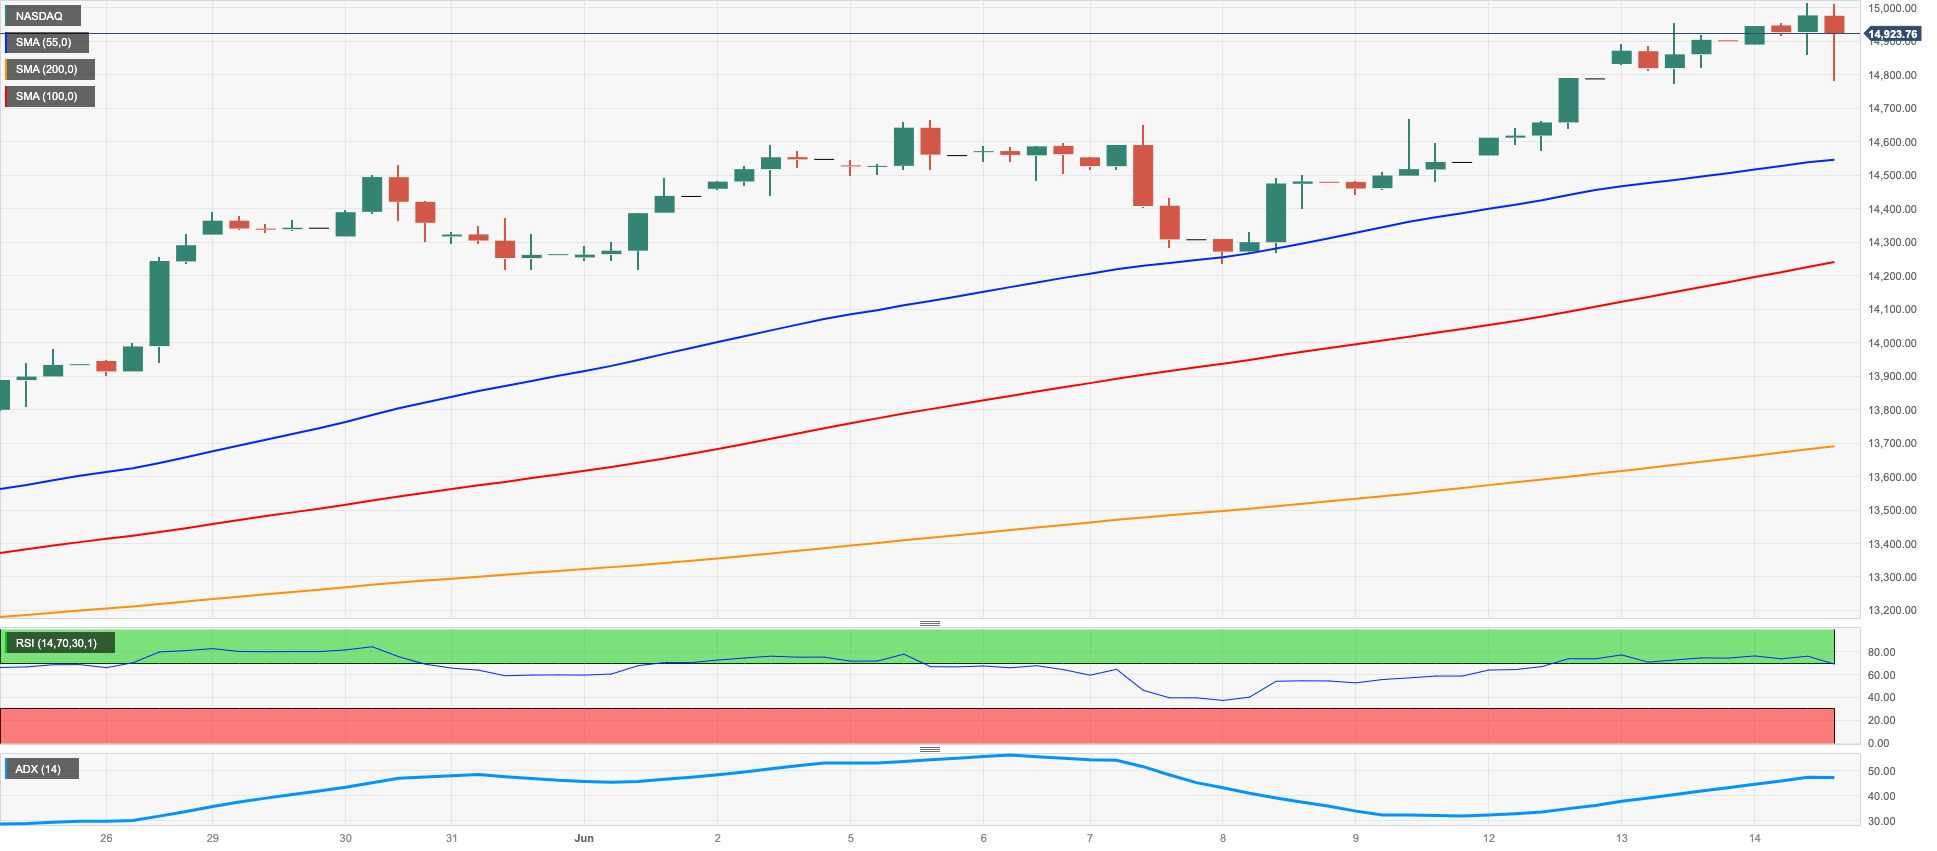
The upside momentum in the Nasdaq 100 remained everything but mitigated on Wednesday.
In fact, the tech sector benchmark index advanced for the sixth session in a row and flirted with recent 2023 highs just above the key 15000 mark (June 13).
The move higher in the index came despite the Fed leaving the door open to further rate hikes in the next few months at its meeting on Wednesday, while the weaker dollar and mixed US yields also underpinned daily gains.
If the Nasdaq 100 index manages to surpass its 2023 high of 150017 (June 13), it could potentially continue its upward trend and reach the March 2022 peak of 15265 (March 29), with the next significant level to watch being 16000. By contrast, immediate support levels to monitor include the weekly low of 13520 (May 24), which appears underpinned by the provisional 55-day SMA (13515) and the May low of 12938 (May 4), which looks also reinforced by the vicinity of the interim 100-day SMA (12964). Before reaching the 2023 low of 10696 (observed on January 6), there are several support levels to consider, such as the April low of 12724 (April 25), the 200-day SMA at 12215, the March low of 11695 (March 13), and the weekly lows of 11550 (January 25) and 11251 (January 26). The daily RSI remains well within the overbought territory above 75.
Top Gainers: Intel, NVIDIA, Broadcom
Top Losers: Diamondback, Rivian Automotive, Moderna
Resistance levels: 15017 15161 15265 (4H chart)
Support levels: 14283 13938 13520 (4H chart)
DOW JONES
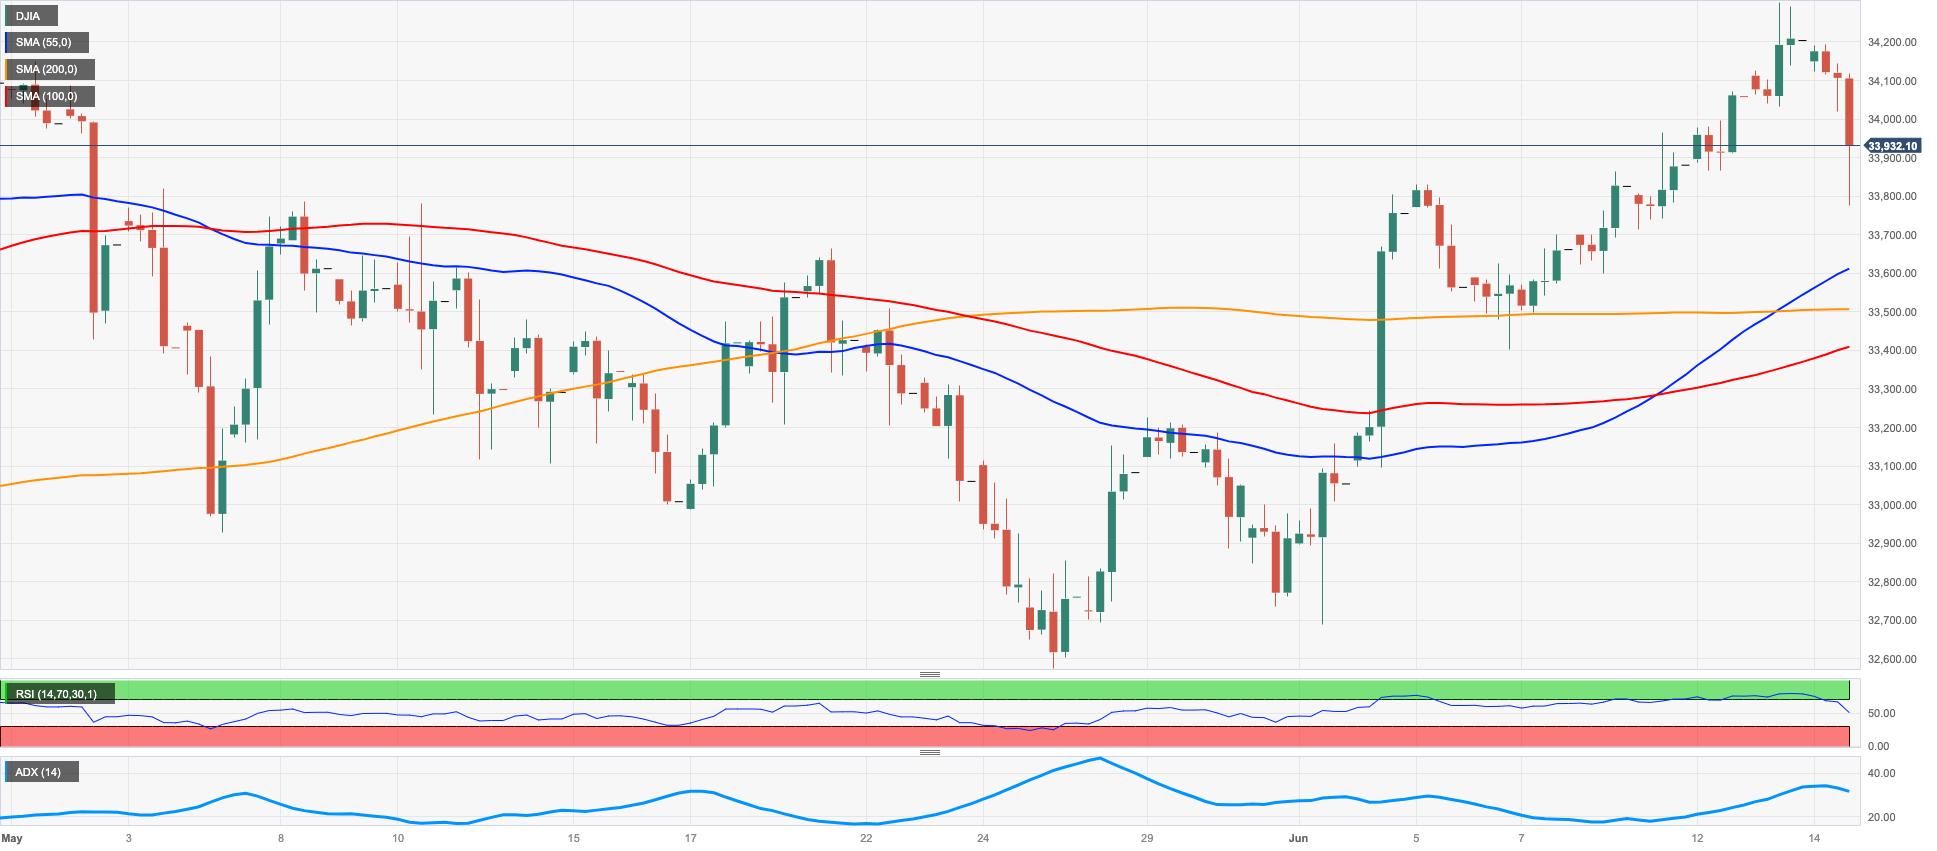
Equities tracked by the Dow Jones abandoned the area of recent peaks past the 34000 mark and halted at the same time a 6-session positive streak on Wednesday.
Indeed, traders’ mood turned soured after the Federal Reserve maintained its policy settings without making changes but indicated a higher projected peak rate, suggesting that any pause in adjustments could be brief.
On the whole, the Dow Jones dropped 0.62% to 33998, the S&P500 rose 0.02% to 4371, and the tech-reference Nasdaq Composite advanced 0.19% to 13605.
The Dow Jones is expected to maintain its upward pace, but a break of the June high of 34310 (June 13) is likely to transfer attention to the 2023 peak of 34342 (January 13), ahead of the December 2022 top of 34712 (December 13). If the index successfully overcomes this level, the April 2022 top at 35492 (April 21) would be the next objective to consider. On the other hand, temporary support levels exist at the 55-day and 100-day SMAs of 33504 and 33347, respectively, prior to the critical 200-day SMA of 32784, which is followed by the May low of 32586 (May 25) and the 2023 low of 31429 (March 15). In the case of additional drop, the 2022 low of 28660 (October 13) would be the next key support level. The daily RSI deflated below the 60 mark.
Top Performers: Nike, Intel, Walmart
Worst Performers: UnitedHealth, Boeing, Walt Disney
Resistance levels: 34310 34712 35492 (4H chart)
Support levels: 33783 33399 32586 (4H chart)
MACROECONOMIC EVENTS

All Information & Updates provided by:

All information relating to the financial markets available on this page has been prepared and issued by FXStreet (Forexstreet SL, Spain, Reg: B62498233) on the basis of publicly available information and all information believed to be reliable and does not conflict with Kuwaiti local laws, and all necessary care has been taken to before the company to ensure that the facts mentioned are correct from the source.
NCM Investment nor any of its directors or employees shall in any way be held responsible for the contents of this news, and the information contained on this page is intended only to provide clients with publicly available information and should not be construed as investment advice, report or analysis and/or constitute an offer or invitation to buy or sell financial instruments of any kind.
RISK WARNING: Forex and CFDs are highly risky leveraged products, as losses can exceed deposits. Please ensure you understand all the risks and take independent advice if necessary. NCM will segregate the clients based on the criteria of the regulator and its bylaws. NCM does not provide any advisory service; the material published does not constitute advice or a recommendation for a transaction in any financial instrument. NCM accepts no responsibility for any use of the content presented and any consequences of that use. Anyone acting on the information provided does so at their own risk.