
- Contact Us:
-

-

-

-


Daily Market Updates
16 Jun 2023
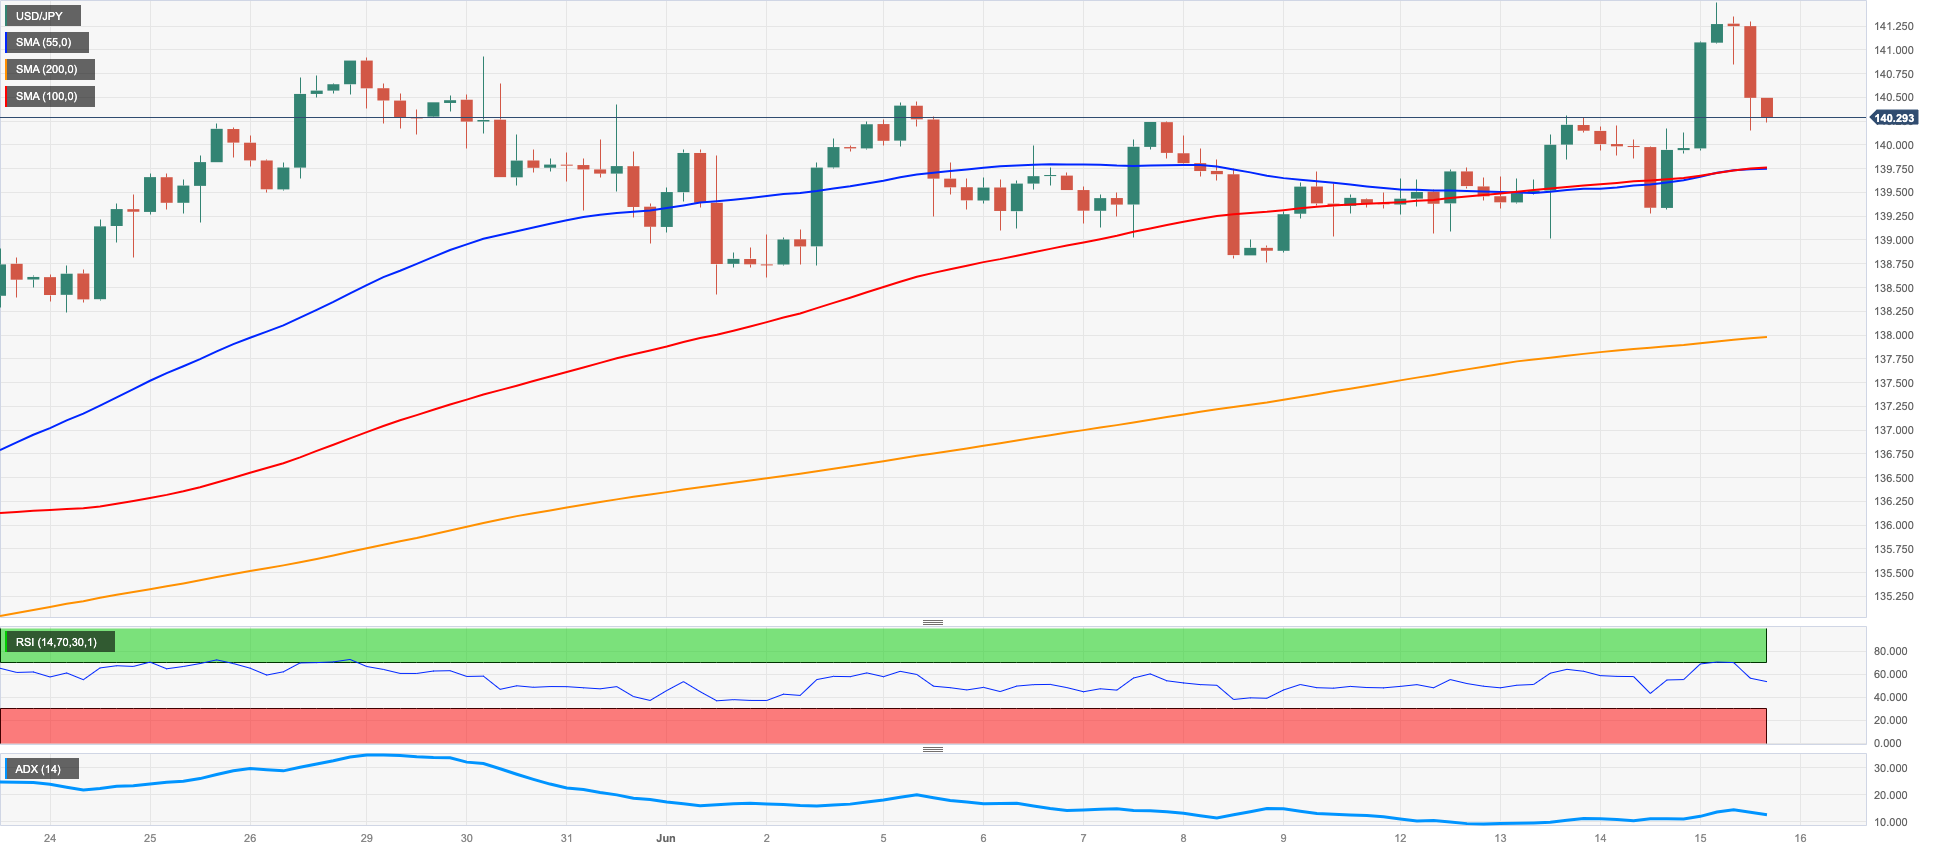
USDJPY
After hitting new 2023 peaks around 141.50, USD/JPY lost some shine and gave away part of that initial strong advance, ending Thursday’s session with decent gains above the 140.00 hurdle.
The sharp pullback in the greenback coupled with declining US yields prompted the pair to change course, particularly soon after the ECB delivered the widely expected 25 bps rate hike at its gathering on Thursday.
In the meantime, investors were gearing up for the BoJ monetary policy meeting due on Friday, where no changes, big or small, are expected from the central bank.
In Japan, the trade deficit widened to ¥1372.5B in May, while Foreign Bond Investment rose ¥14.7B in the week to June 10, and Machinery Orders contracted at an annualized 5.9% in April. Finally, the Tertiary Industry Index expanded 1.2% in May from the previous month.
USD/JPY faces immediate resistance at the 2023 peak at 141.50 (June 15). North from here emerges the weekly high at 142.25 (21 November 2022) ahead of the 2022 top of 151.94 (21 October). On the downside, bears faces the next obstacle at the June low of 138.42 (June 1) before reaching the important 200-day SMA at 137.22 and the transitory 55-day and 100-day SMAs at 136.26 and 134.87, respectively. This is followed by the weekly low of 133.01 (April 26) ahead of minor support at 132.01 (April 13) and the April low of 130.62 (April 5). The loss of the latter could pave the way for a decline towards the March low of 129.63 (March 24) ahead of the February low of 128.08 (February 8). The everyday RSI ticked higher past 62.
Resistance levels: 141.50 141.61 142.25 (4H chart)
Support levels: 139.28 138.75 137.94 (4H chart)
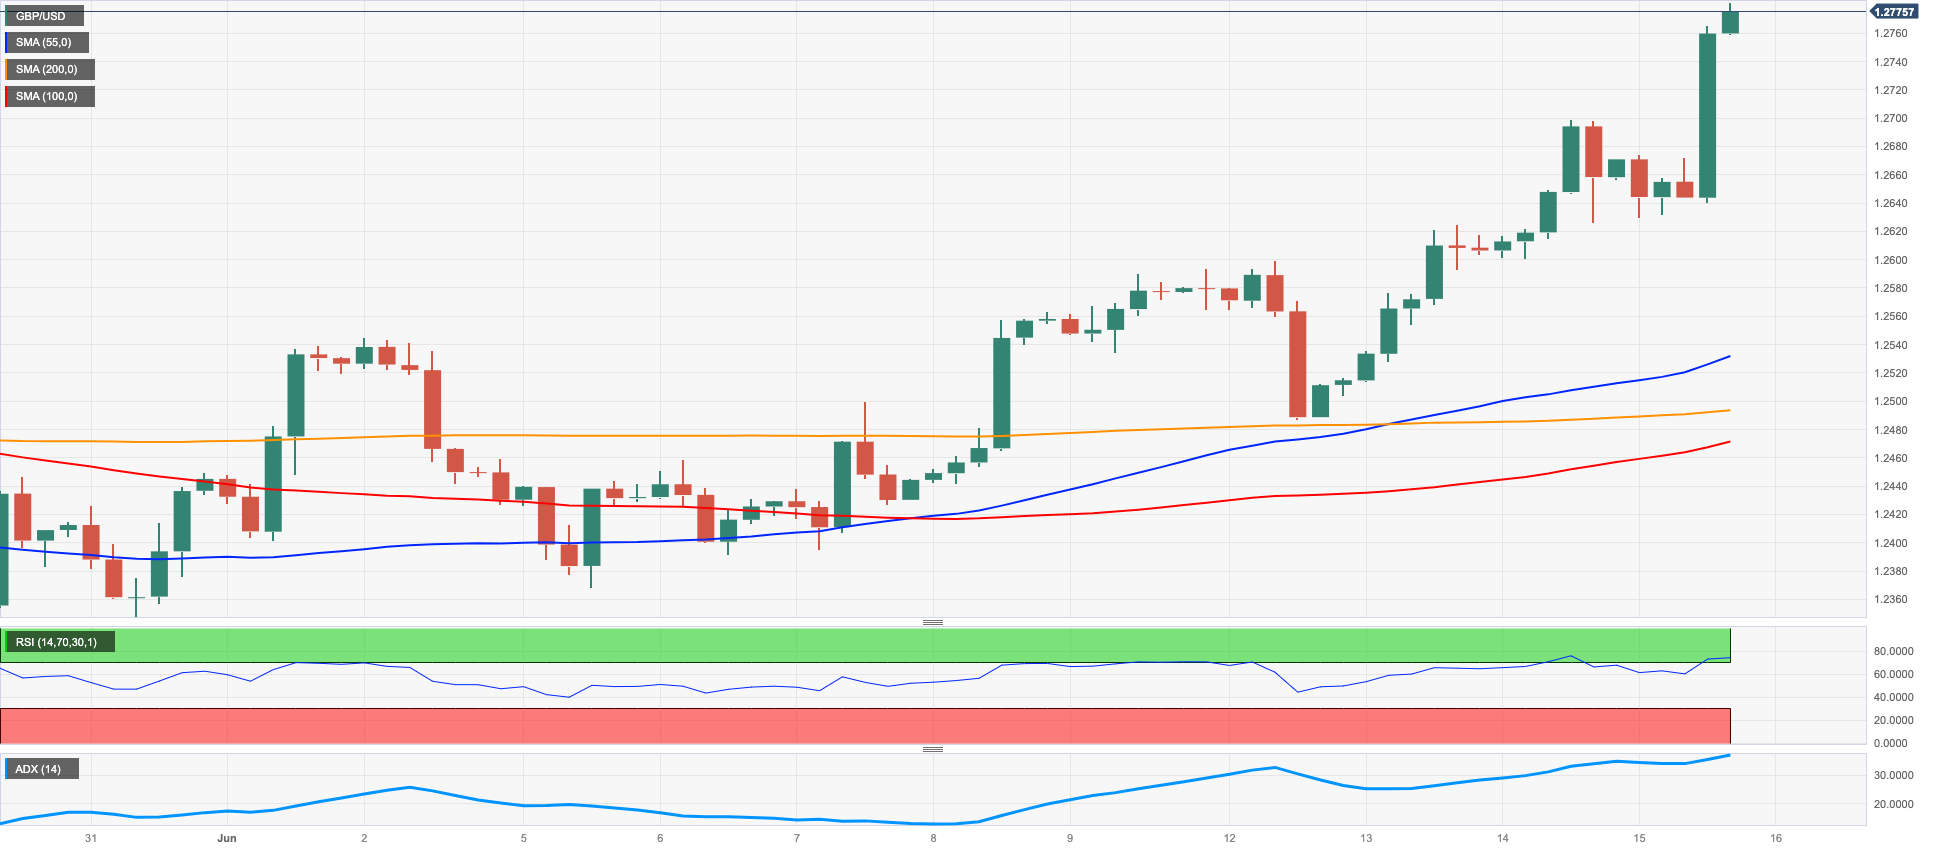
GBPUSD
The much improved sentiment in the risk-associated complex propelled GBP/USD to levels last seen in April 2022, around 1.2780 on Thursday.
The pronounced sell-off in the greenback following the FOMC event did nothing but gather extra pace in response to the hawkish message from the ECB at its event on Thursday, where the central bank raised rates by a quarter point and signalled that more hikes are coming in July.
In the UK money market, the 10-year gilt yields added to Wednesday’s decline near the 4.35% region.
There were no data releases scheduled on the UK calendar on Thursday.
GBP/USD reached a new peak for 2023 at 1.2776 on June 15. Surpassing this level could prompt a potential test of the 200-week SMA at 1.2871 prior to the psychological level of 1.3000. on the other hand, interim contention aligns at the 55-day SMA at 1.2476 ahead of the May low of 1.2308 (May 25), which remains reinforced by the nearby temporary 100-day SMA (1.2317) and comes before the April low of 1.2274 (April 3). If the price continues to decrease, it will encounter significant support at the 200-day SMA at 1.2036 before reaching the 2023 low at 1.1802 (March 8). The RSI on a day-to-day basis climbed further and flirted with 69.
Resistance levels: 1.2776 1.3089 1.3146 (4H chart)
Support levels: 1.2626 1.2486 1.2368 (4H chart)
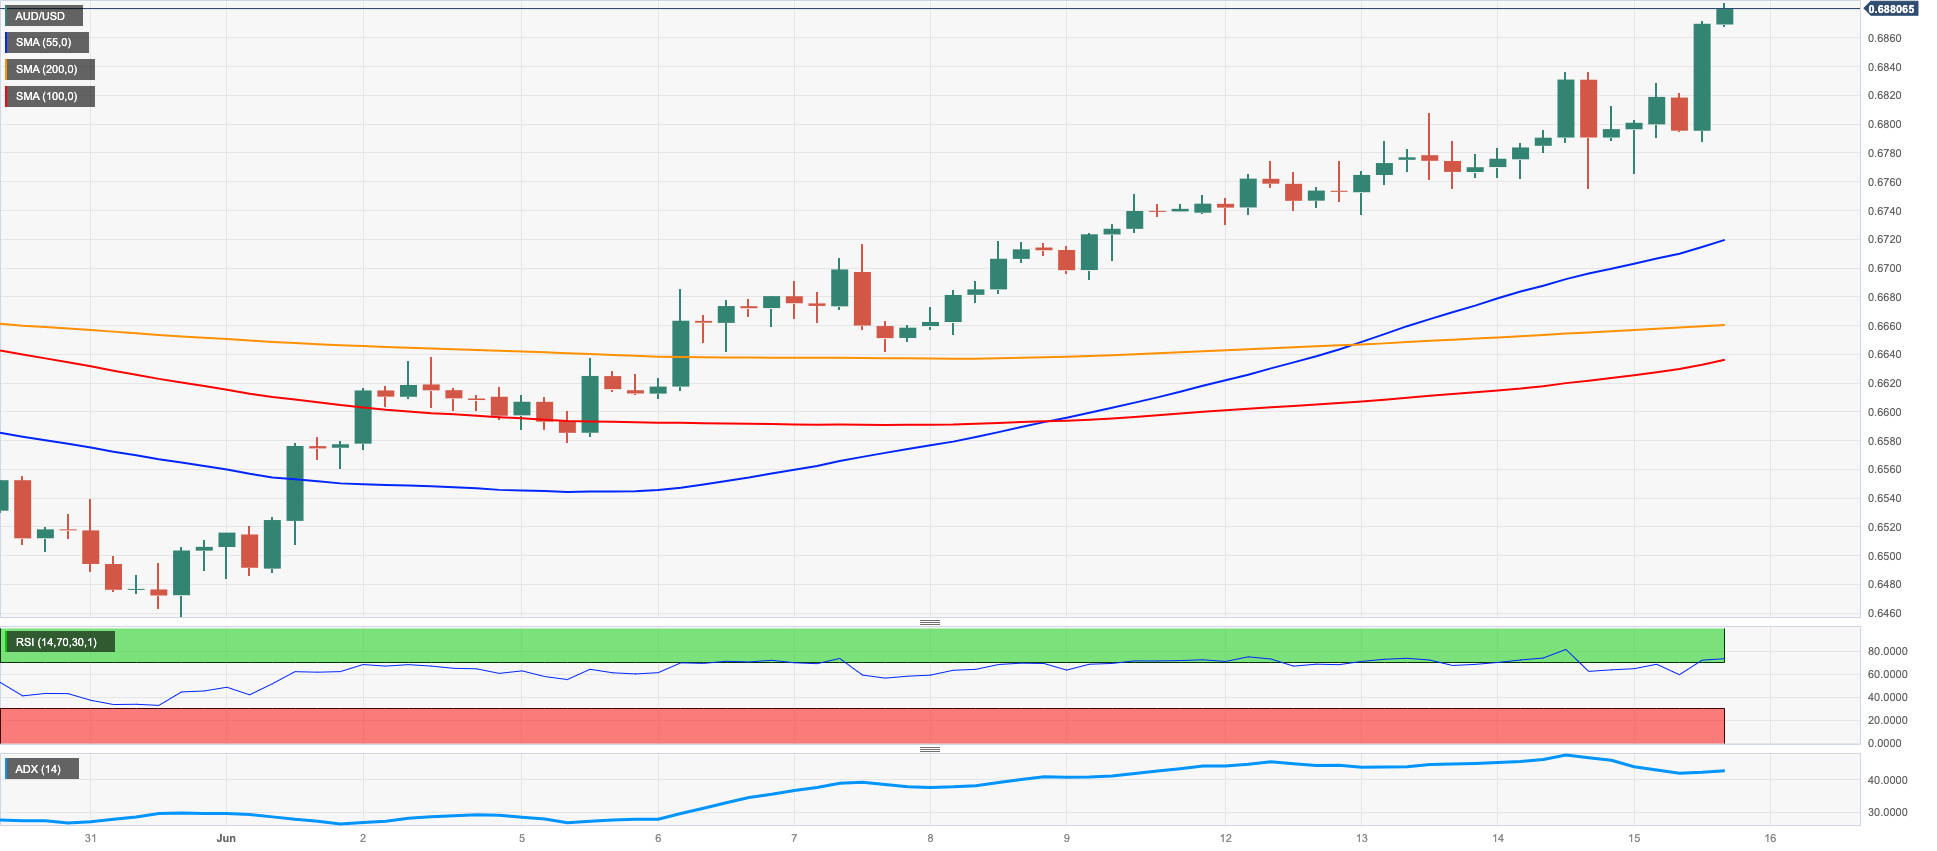
AUDUSD
Happy days for the Aussie dollar!
Indeed, AUD/USD rose to multi-month tops near the 0.6900 region on the back of the intense retracement in the greenback and the firm optimism surrounding the risk-linked galaxy on Thursday.
Another boost for the AUD came from the solid performance of the commodity universe, where both copper prices and iron ore edged higher. In addition, robust prints from May’s jobs report lent further legs to the pair after the Employment Change rose by 75.9K people and the Unemployment Rate ticked lower to 3.6%.
Once AUD/USD clears the June peak of 0.6877 (June 15) it could then embark on a potential visit to the psychological 0.7000 mark. Further up comes the weekly high of 0.7029 (February 14) and the 2023 top of 0.7157 (February 2). On the flip side, the 100-day SMA at 0,.6728 should offer temporary support before the more relevant 200-day SMA at 0.6690. Extra losses from here could retest the 2023 low of 0.6458 (May 31) seconded by the weekly low of 0.6386 (November 10 2022) and the November 2022 low of 0.6272 (November 3). The RSI on the daily chart entered the overbought region above the 71 level.
Resistance levels: 0.6877 0.6920 0.7029 (4H chart)
Support levels: 0.6755 0.6714 0.6660 (4H chart)
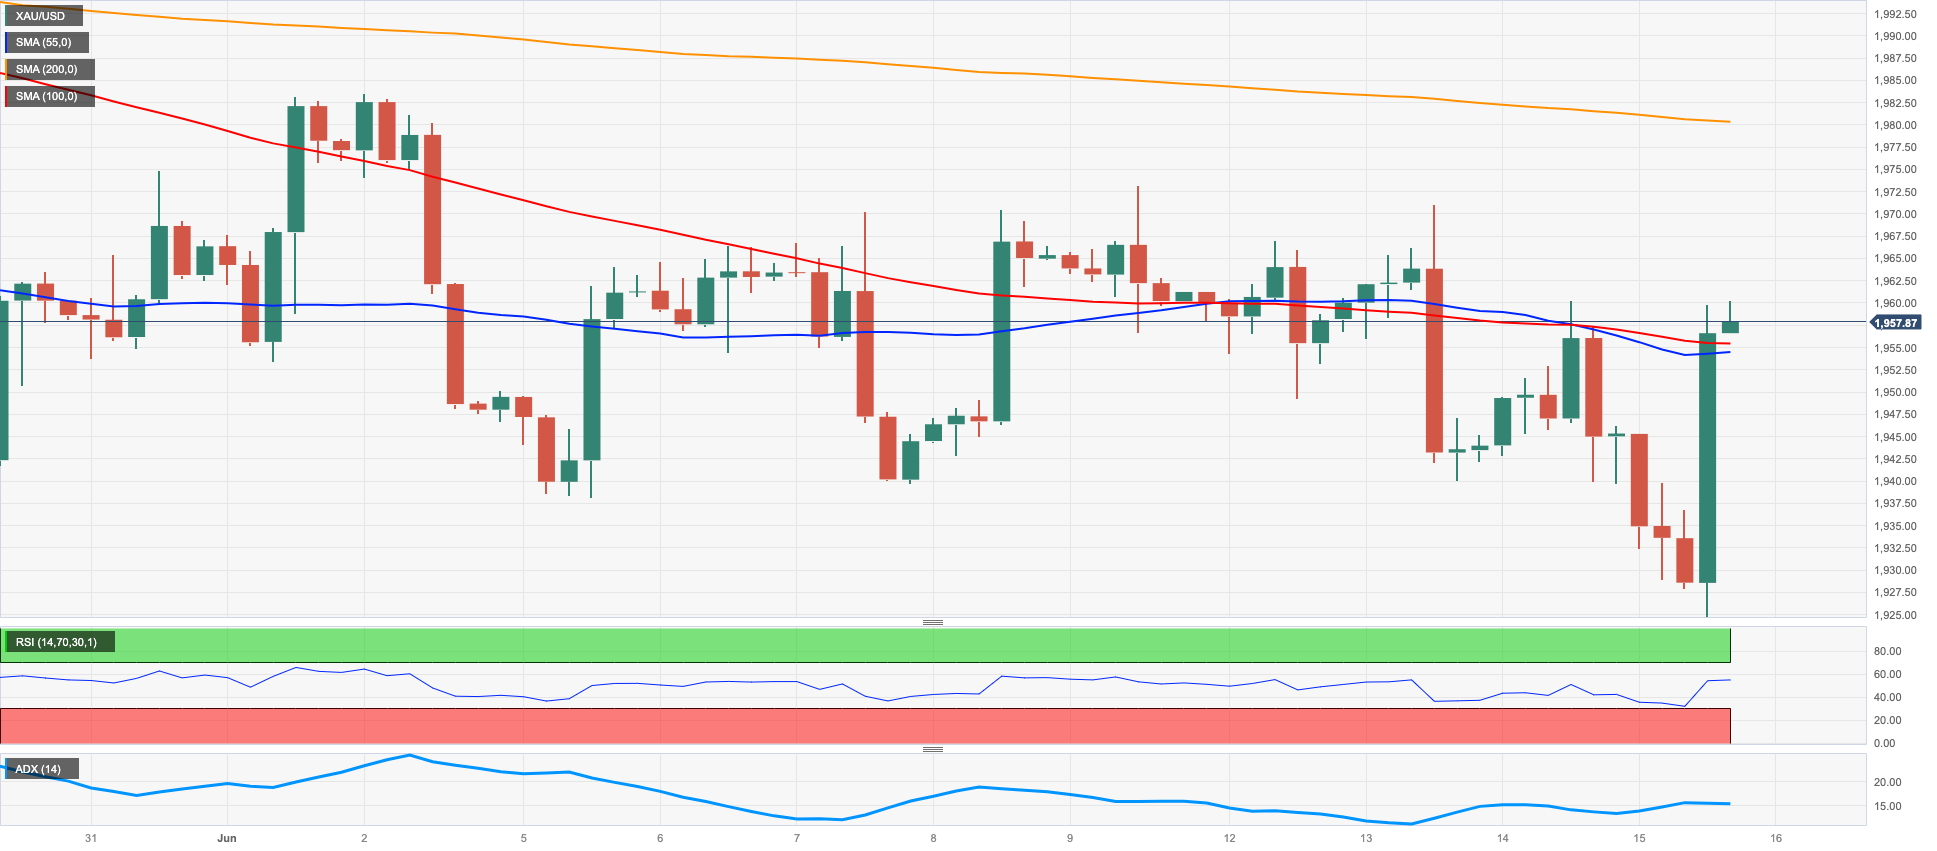
GOLD
Gold prices managed to reverse an initial drop to multi-week lows around $1925 per troy ounce and eventually ended Thursday’s session with marked gains near $1960.
The meltdown of the greenback, which was further fueled by the downtrend in US yields across the curve, triggered a strong bounce in the precious metal, particularly in the wake of the ECB monetary policy meeting.
Gold is currently in a phase of consolidation, and it is uncertain when it will break out of this pattern. However, if a breakout does occur, there is potential for it to challenge the June high of $1983 (June 2) and even reach the significant milestone of $2000. Notably, there are no major resistance levels until it reaches the 2023 peak of $2067 (May 4), the 2022 top of $2070 (March 8), and ultimately the all-time record of $2075 (August 7, 2020). On the contrary, immediate support can be found at the June low of $1925 (June 15), followed by the 200-day SMA at $1845 and the 2023 low of $1804 (February 28).
Resistance levels: $1971 $1983 $2022 (4H chart)
Support levels: $1925 $1885 $1809 (4H chart)
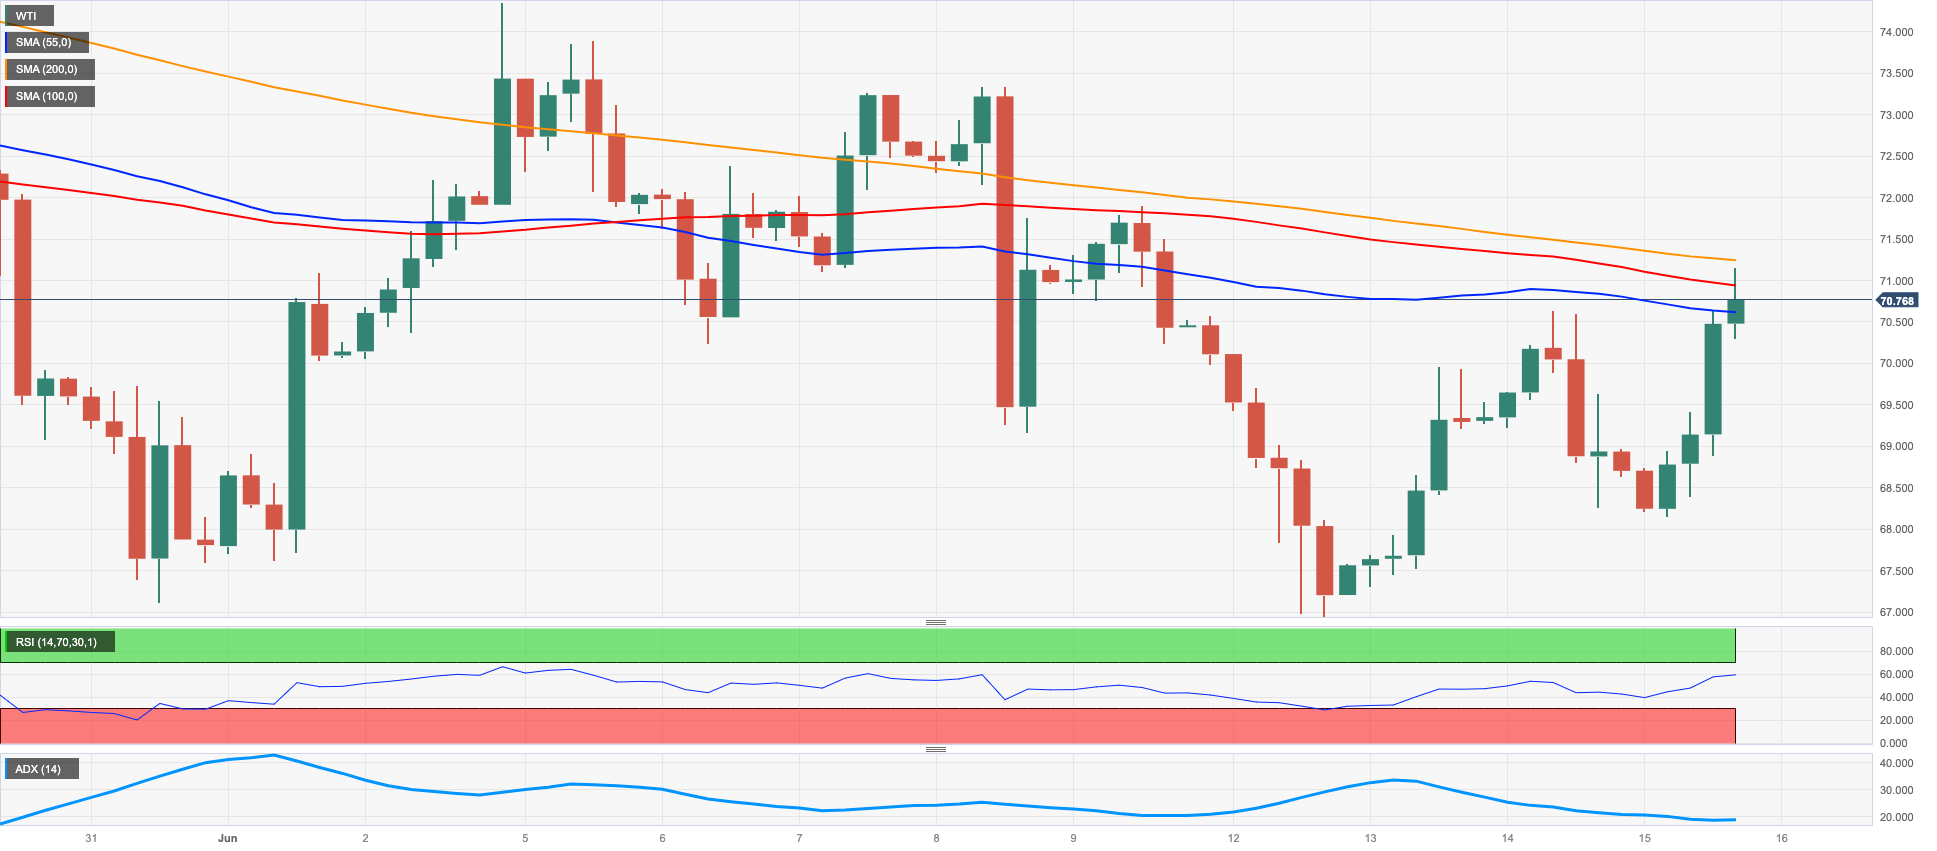
CRUDE WTI
Prices of the American reference for sweet light crude oil reclaimed some ground lost in past session and rebounded strongly to print fresh weekly peaks north of the key $70.00 mark per barrel on Thursday.
The much weaker dollar in combination with positive prospects for Chinese demand supported the move higher in the commodity, although the still uncertain pace of the economic recovery in China and recession fears hovering over the US and Europe seem to have also limited the upside in WTI.
A more serious bullish attempt could see WTI challenging the June high of $74.92 (June 5), confirmed by the 100-day SMA and ahead of the crucial 200-day SMA at $78.43. The weekly high of $79.14 (April 24) is followed by the critical barrier of $80.00 per barrel, the 2023 high of $83.49 (April 12) and the November 2022 high of $93.73 (November 7). In contrast, the next support is at the June low of $66.86 (June 13). A deeper slide from here could target the 2023 low at $63.61 (May 4) ahead of the December 2021 low at $62.46 (December 2) and prior to the critical $60.00 mark per barrel
Resistance levels: $70.93 $73.24 $74.92 (4H chart)
Support levels: $68.03 $66.77 $63.61 (4H chart)
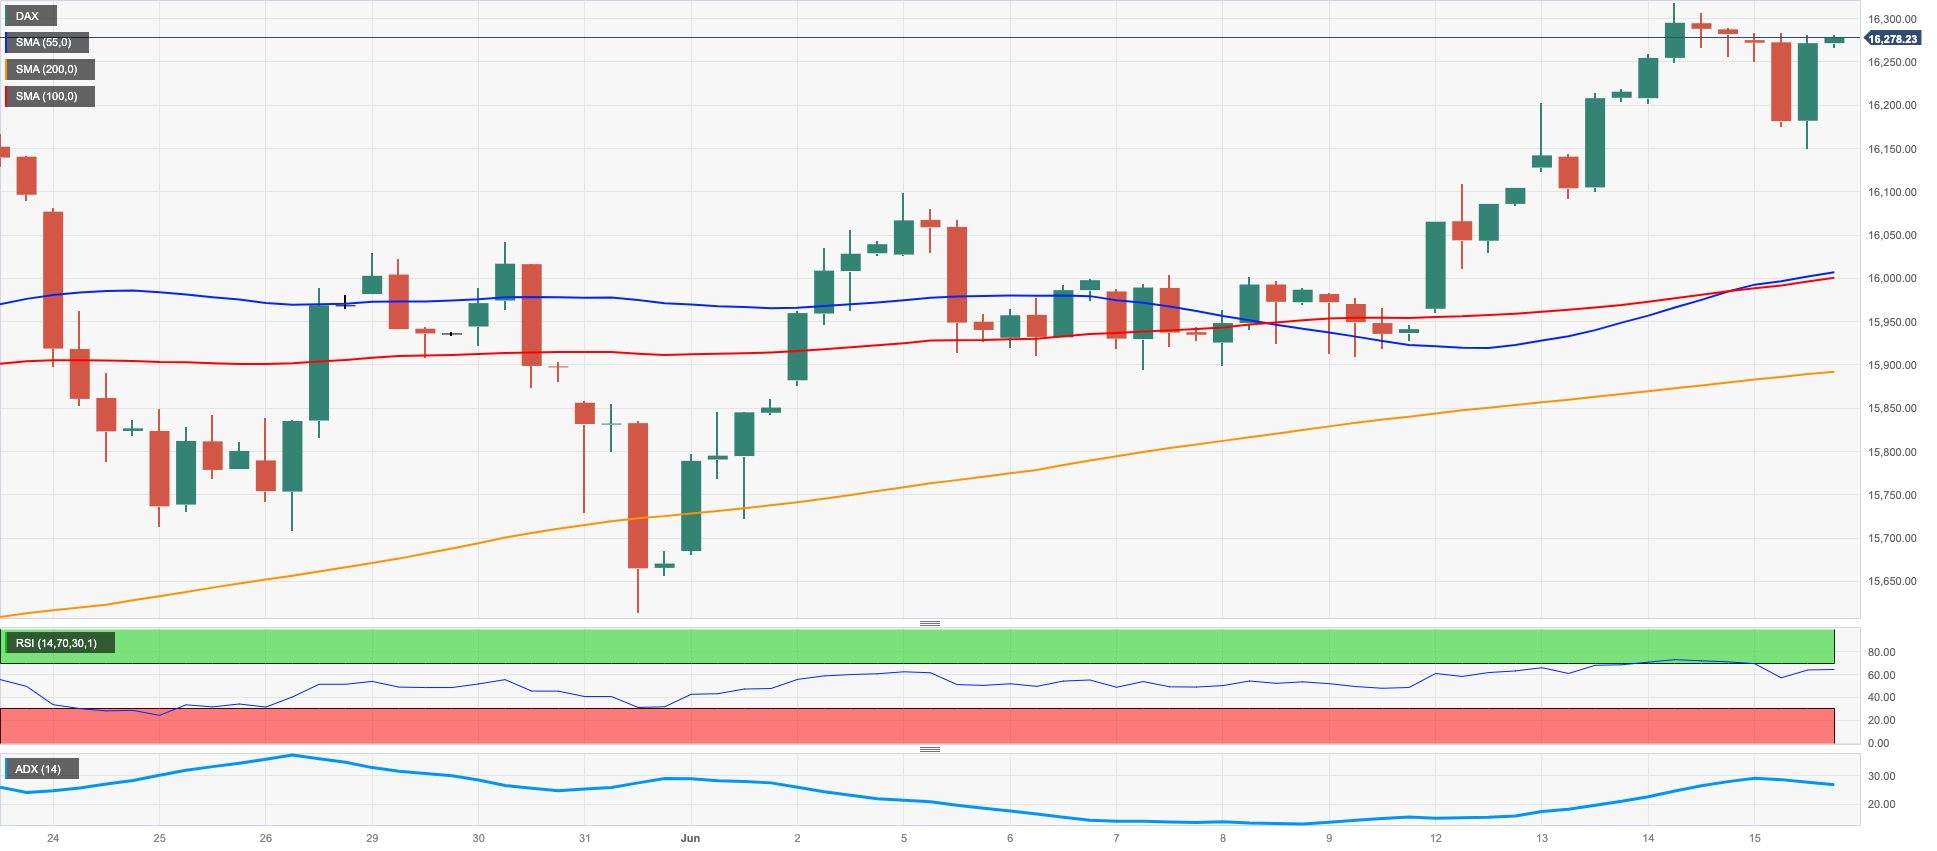
GER40
The DAX40 ended the session with marginal losses around the 16300 zone on Thursday.
The index reversed three consecutive sessions with gains on the back of some renewed prudence among traders after the ECB raised rates by 25 bps and signaled that another hike is coming in July.
The central bank reiterated that inflation will remain elevated for longer while casting doubts over the economic outlook.
Meanwhile, in the German bond markets, the 10-year bund yields rose for the third straight day, this time revisiting the 2.55% area.
On June 14, the DAX40 set a new all-time high of 16336. In the case of a bearish effort, the interim 55-day SMA at 15864 would be the first target, followed by the May low of 15629 (May 31) and the transitory 100-day SMA at 15607. If the market continues to fall, the emphasis will turn to the April low of 15482 (April 5), followed by a potentially shaky support level at 14809 (March 24) and the key 200-day SMA at 14622. Moving down, the March low of 14458 (March 20) enters the picture. The daily RSI deflated a tad to 62.
Best Performers: Symrise AG, Sartorius AG VZO, Deutsche Boerse
Worst Performers: Deutsche Bank AG, Siemens Energy AG, Zalando SE
Resistance levels: 16336 17000? (4H chart)
Support levels: 16004 15719 15629 (4H chart)
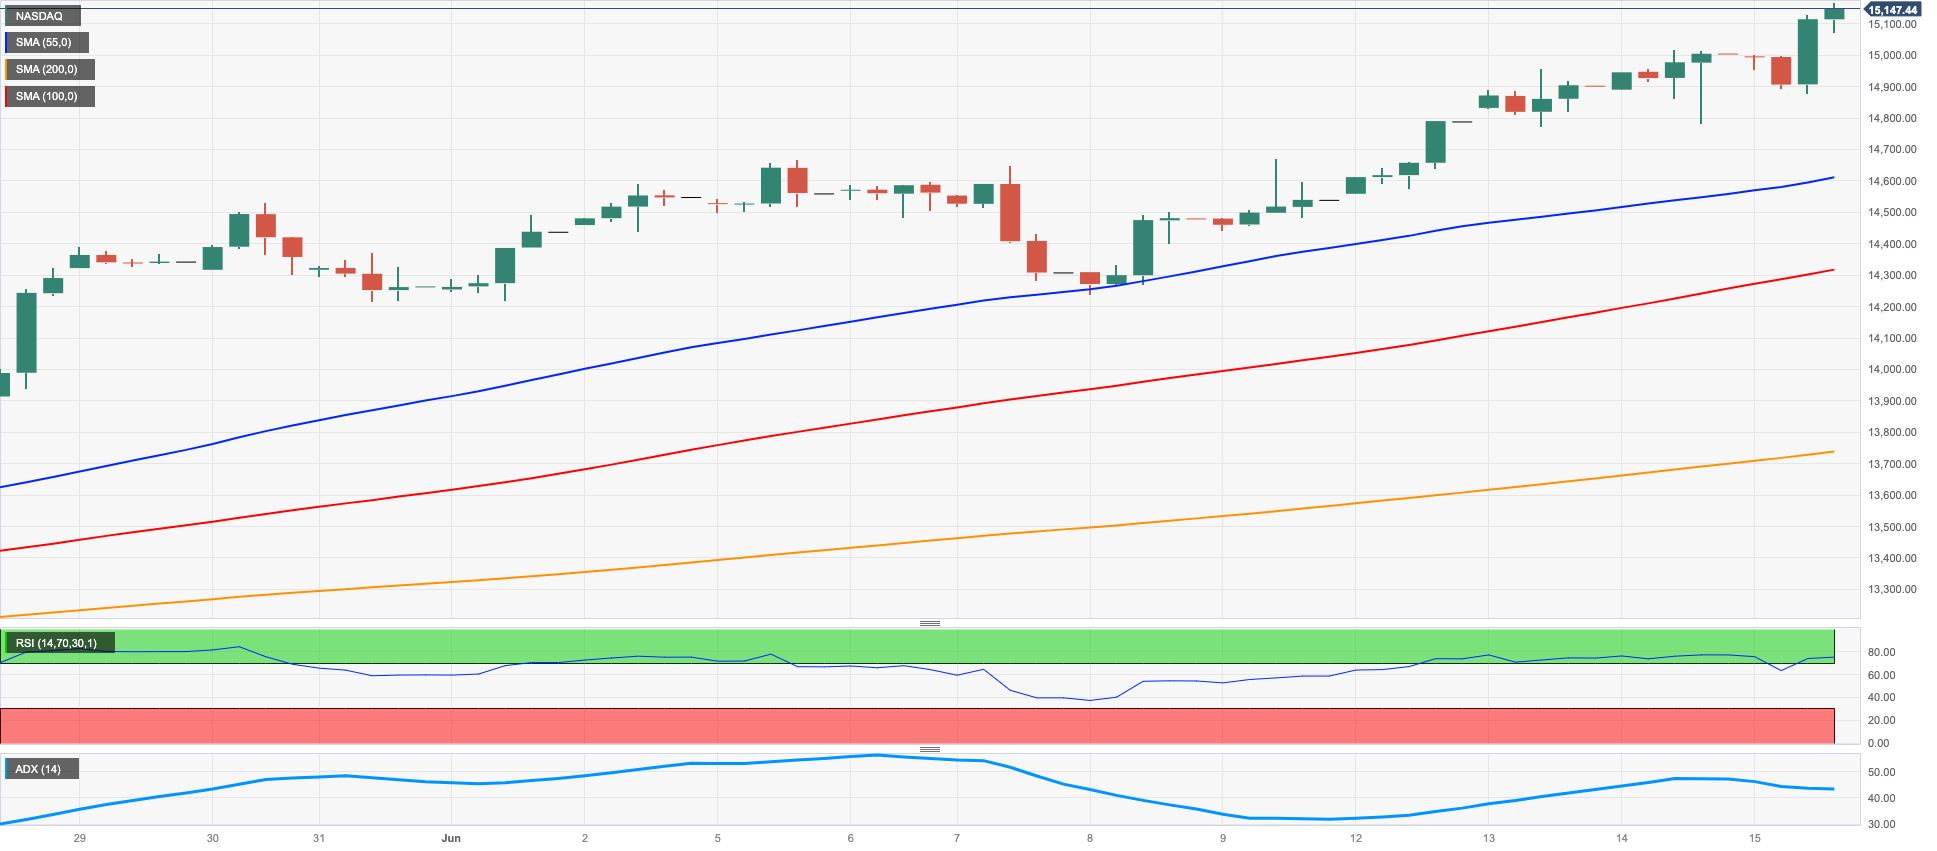
NASDAQ
The tech reference Nasdaq 100 extended further north of the 15000 mark its rally on Thursday, reaching at the same time new YTD peaks.
The sixth consecutive daily advance in the index came in response to lower US yields across the curve and the intense retracement in the greenback, all of which morphed in to extra wings for the index.
If the Nasdaq 100 index surpasses its 2023 high of 15150 (June 5), it may continue its upward trend and potentially reach the March 2022 peak of 15265 (March 29), with the next significant level to watch being 16000. The other way around, there are immediate support levels to monitor, including the weekly low of 13520 (May 24), which is supported by the provisional 55-day SMA (13563), and the May low of 12938 (May 4), which is also reinforced by the vicinity of the provisional 100-day SMA (12998). Before reaching the 2023 low of 10696 (January 6), there are several support levels to consider, such as the April low of 12724 (April 25), the 200-day SMA at 12229, the March low of 11695 (March 13), and the weekly lows of 11550 (January 25) and 11251 (January 26). The daily RSI remains well into the overbought territory past 78.
Top Gainers: T-Mobile US, Crowdstrike Holdings, JD.com Inc Adr
Top Losers: Warner Bros Discovery, Marriott Int, AMD
Resistance levels: 15150 15161 15265 (4H chart)
Support levels: 14283 14074 13520 (4H chart)
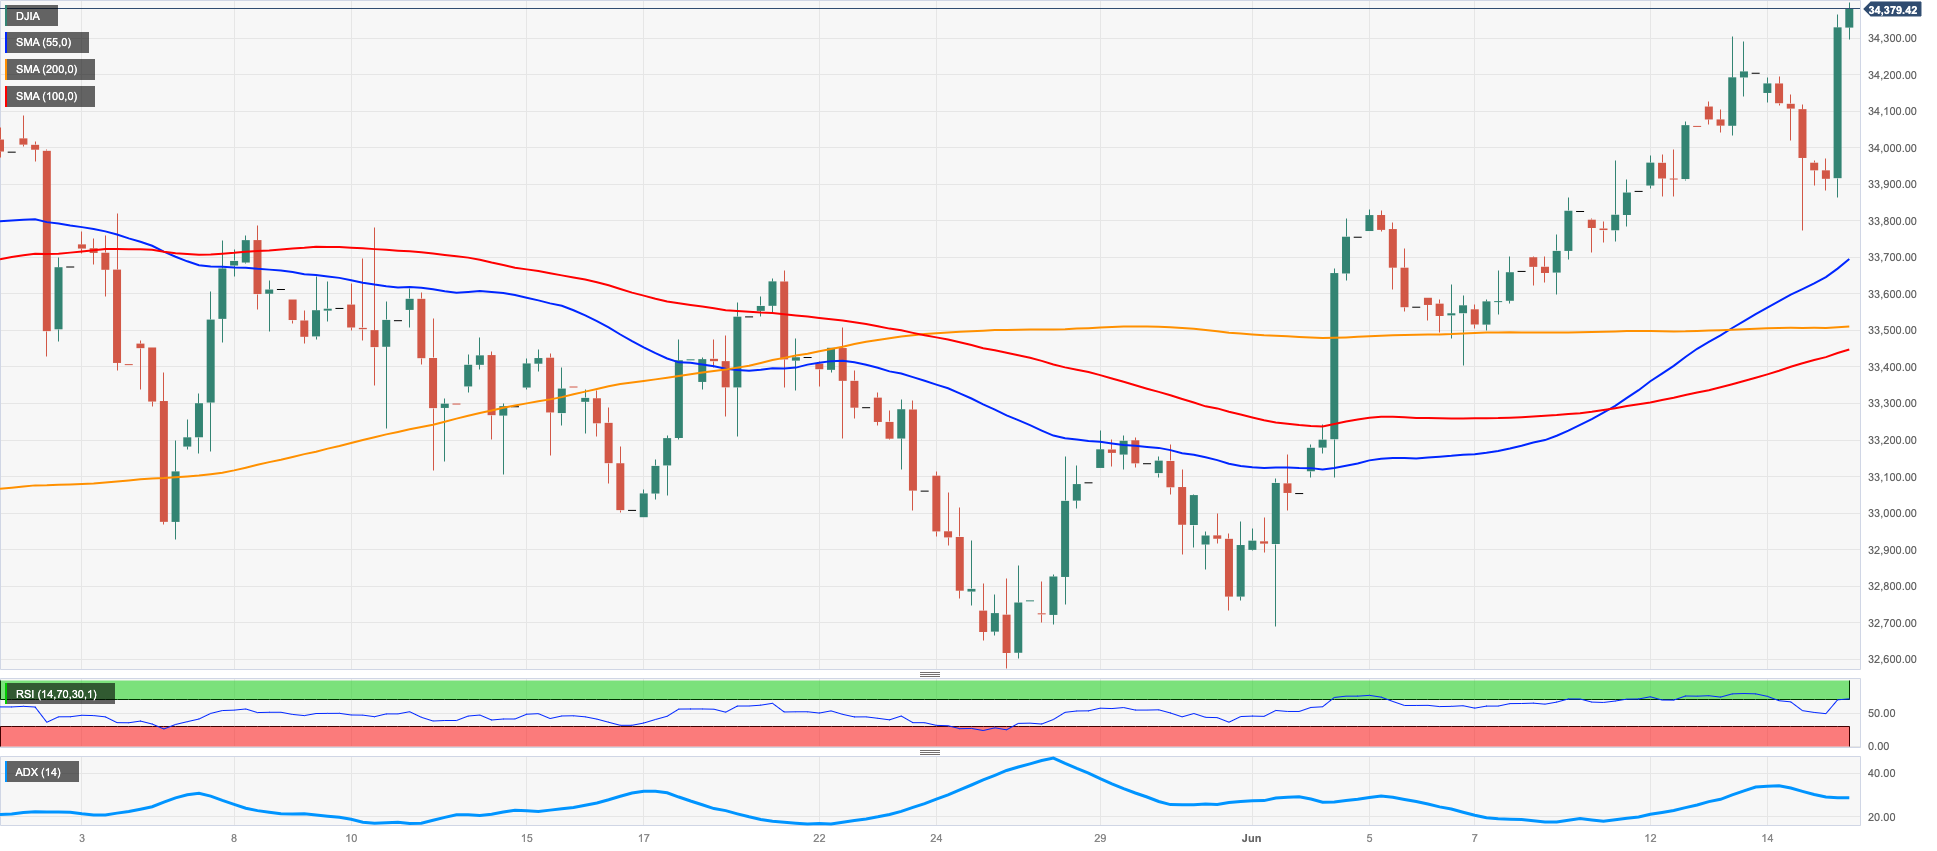
DOW JONES
The optimism among investors and the increasing appetite for the risk complex pushed equities tracked by the benchmark Dow Jones to clinch fresh 2023 highs near the 34400 region on Thursday.
In addition, the strong sell-off in the dollar and diminishing US yields across the curve further bolstered the generalized firm tone in the markets.
All in all, the Dow Jones gained 1.18% to 34379, the S&P500 advanced 1.07% to 4419, and the tech-heavy Nasdaq Composite rose 0.99% to 13761.
It is anticipated that the Dow Jones will continue its upward momentum. Against that, the next up-barrier emerges at the December 20222 top of 34712 (December 13, 2022) ahead of the April 2022 peak at 35492 (21). On the opposite side, there are transitory contention levels at the 55-day and 100-day SMAs of 33539 and 33354, respectively. These support levels exist before reaching the critical 200-day SMA of 32796. Further support levels include the May low of 32586 (May 25) and the 2023 low of 31429 (March 15). In the event of a further decline, the key support level to watch would be the 2022 low of 28660 (October 13). The day-to-day RSI surpassed the 65 region.
Top Performers: UnitedHealth, Microsoft, Amgen
Worst Performers: Nike, American Express, Walt Disney
Resistance levels: 34396 34712 35492 (4H chart)
Support levels: 33783 33399 32586 (4H chart)
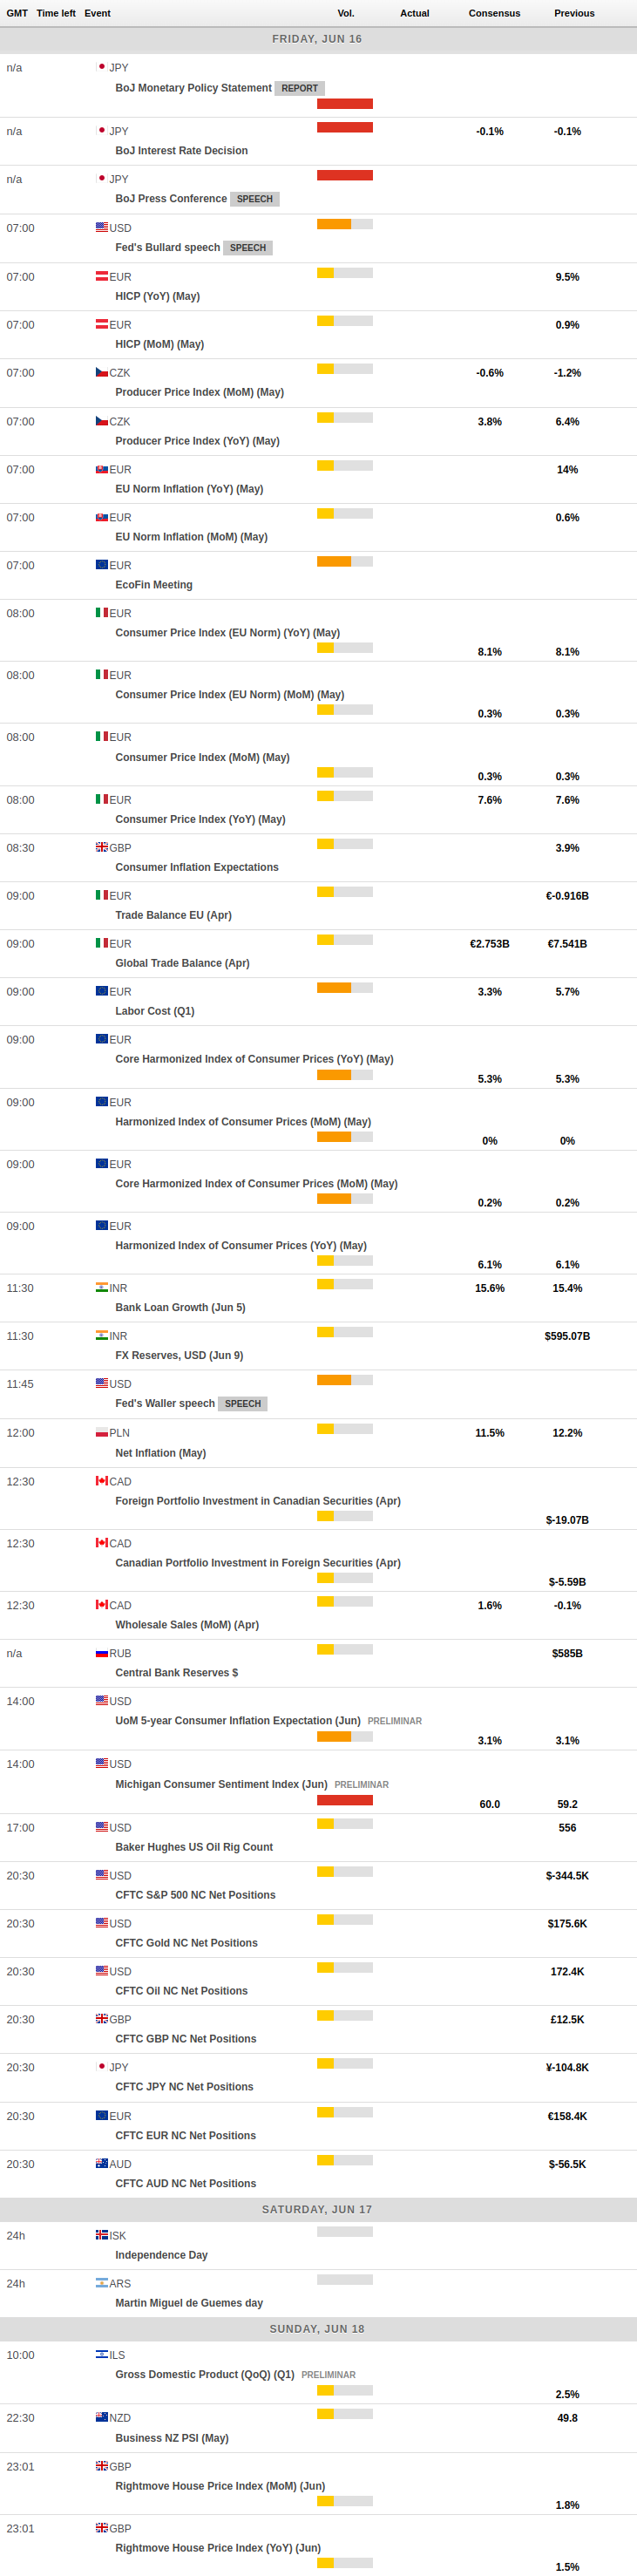
MACROECONOMIC EVENTS
All Information & Updates provided by:

All information relating to the financial markets available on this page has been prepared and issued by FXStreet (Forexstreet SL, Spain, Reg: B62498233) on the basis of publicly available information and all information believed to be reliable and does not conflict with Kuwaiti local laws, and all necessary care has been taken to before the company to ensure that the facts mentioned are correct from the source.
NCM Investment nor any of its directors or employees shall in any way be held responsible for the contents of this news, and the information contained on this page is intended only to provide clients with publicly available information and should not be construed as investment advice, report or analysis and/or constitute an offer or invitation to buy or sell financial instruments of any kind.
RISK WARNING: Forex and CFDs are highly risky leveraged products, as losses can exceed deposits. Please ensure you understand all the risks and take independent advice if necessary. NCM will segregate the clients based on the criteria of the regulator and its bylaws. NCM does not provide any advisory service; the material published does not constitute advice or a recommendation for a transaction in any financial instrument. NCM accepts no responsibility for any use of the content presented and any consequences of that use. Anyone acting on the information provided does so at their own risk.