
- Contact Us:
-

-

-

-


Daily Market Updates
19 Jun 2023
USDJPY
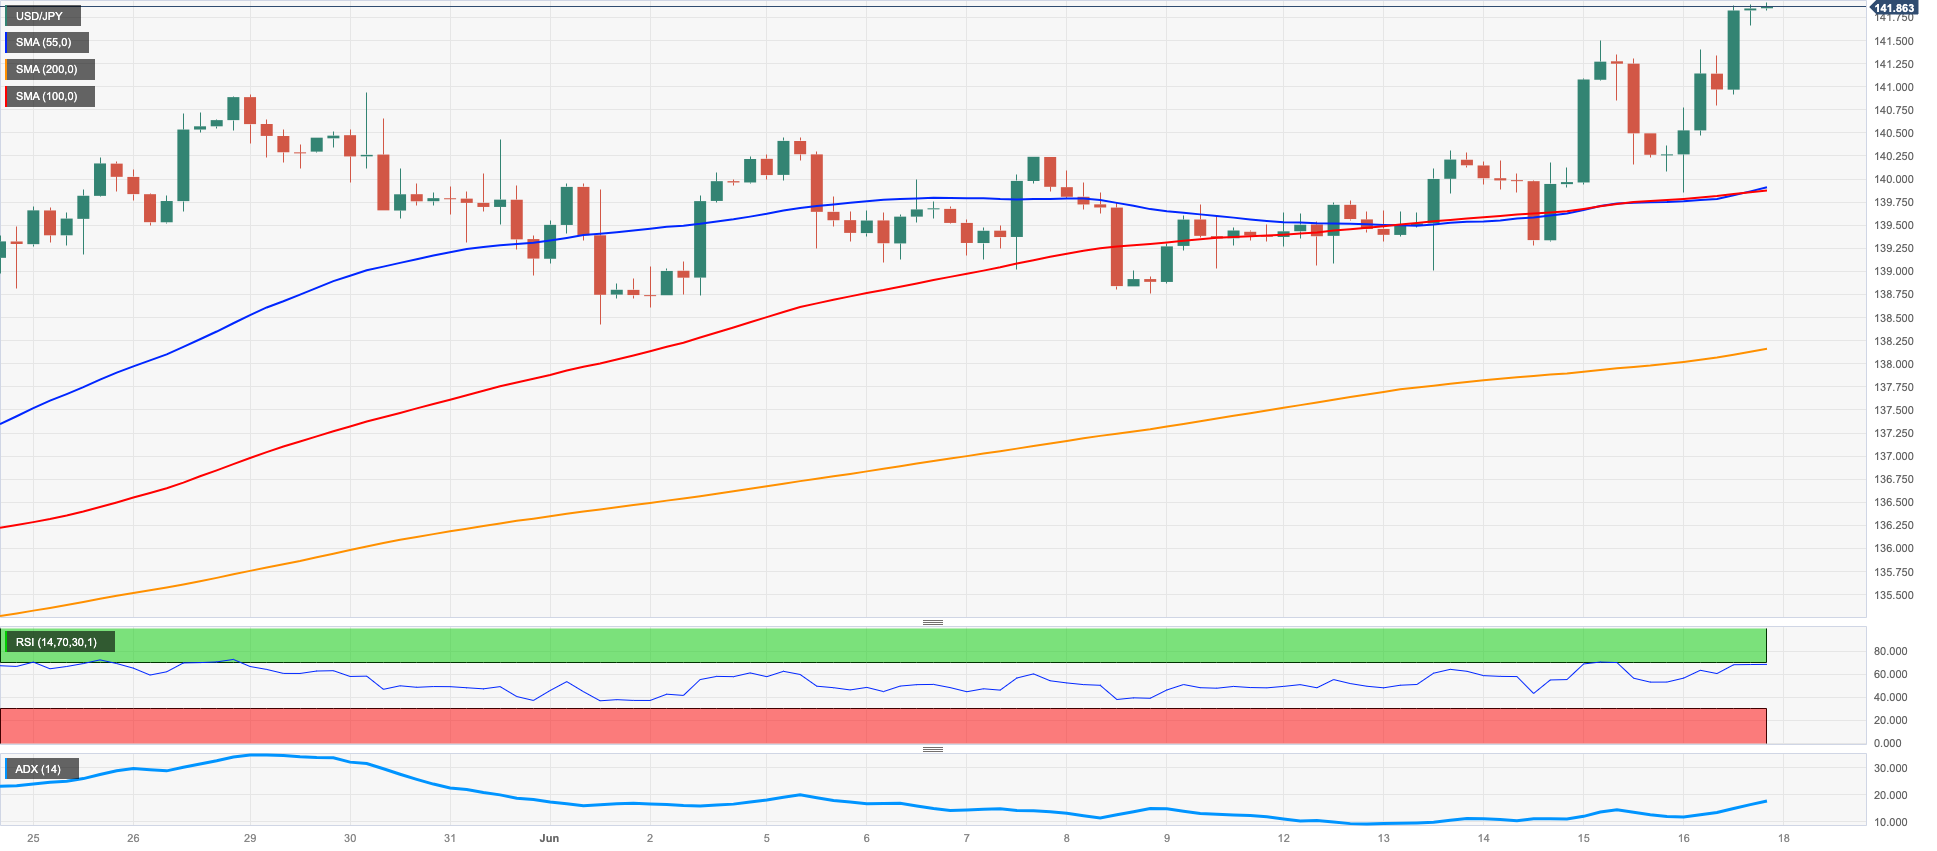
USD/JPY's upward momentum continued to accelerate during the latter part of the week and was validated on Friday, particularly after the BoJ opted to maintain its monetary conditions, which was in line with the predictions of many market participants. On this, the pair rose to fresh YTD peaks around 141.85 and ended a positive week after two declines in a row.
Back at the BoJ event, the central bank acknowledged that inflation expectations have remained relatively stable in recent times but highlighted a slowdown in the year-on-year rate of core inflation (excluding fresh food), primarily due to government measures aimed at reducing energy prices. The bank projected a deceleration in inflation towards the middle of FY2023, emphasizing the need to closely monitor developments in financial and FX markets.
At his press conference, and when queried about the upcoming July meeting, Governor Ueda stated that new data received between policy meetings can influence the outcome, potentially leading to different results. He acknowledged the possibility of occasional surprises but noted that a significant change in the inflation outlook could prompt a policy shift.
In the meantime, and looking at the central banks’ divergences, the Fed chose not to increase rates earlier in the week, while the ECB raised its main rate once again and suggested that there could be more hikes in the future as they continue their efforts to combat inflation. This scenario leaves the door open to extra pressure on the Japanese currency in the near-to-medium term.
Extra support for the upside bias in the pair came from the rebound in US yields across the curve, while the JGB 10-year yields dropped to the area of monthly lows around the 0.40%.
USD/JPY is right before resistance at the 2023 high at 141.85 (June 16). North of here, the weekly high at 142.25 (November 21 2022) is ahead of the 2022 top at 151.94 (October 22). On the downside, bears face the next obstacle at the June low of 138.42 (June 1) before reaching the important 200-day SMA at 137.22 and the provisional 55-day and 100-day SMAs at 136.42 and 134.99, respectively. It follows the weekly low at 133.01 (April 26) before the minor support at 132.01 (April 13) and the April low at 130.62 (April 5). The loss of the latter could pave the way for a decline towards the March low of 129.63 (March 24) prior to the February low of 128.08 (February 8). The daily RSI climbed beyond 68.
Resistance levels: 141.85 142.25 146.79 (4H chart)
Support levels: 139.85 139.28 139.01 (4H chart)
GBPUSD
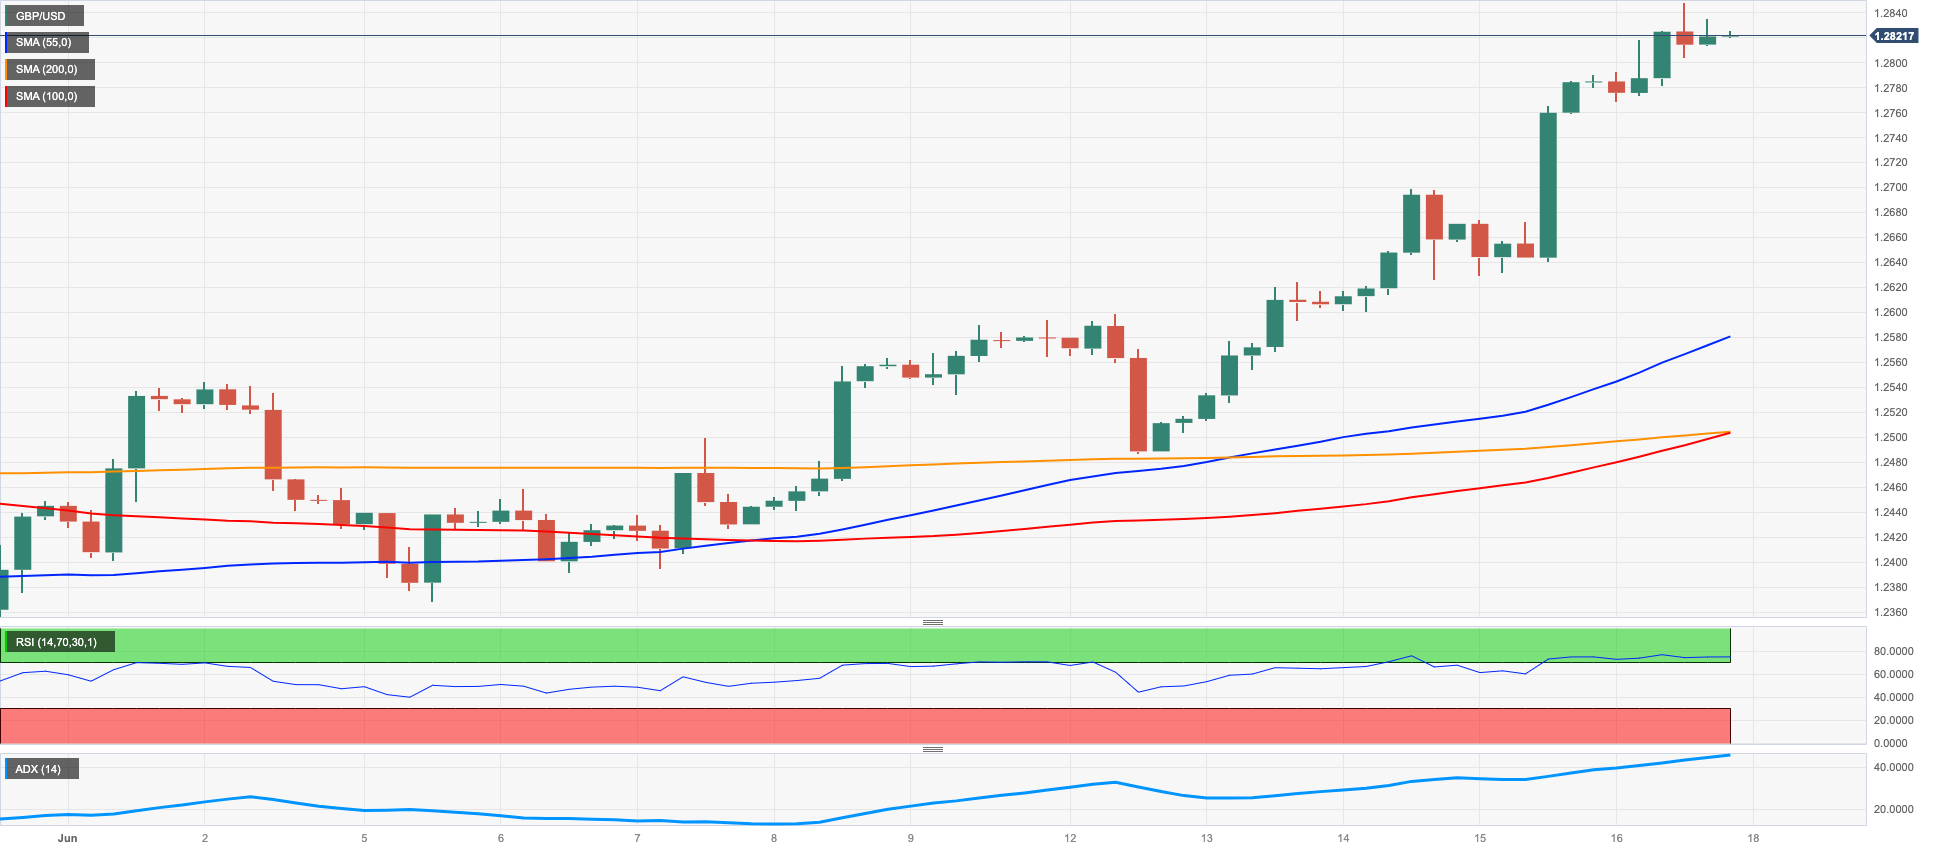
Further upside on Friday saw GBP/USD surpass the 1.2800 barrier for the first time since late April 2022 despite the late rebound in the greenback and some loss of momentum in the risk complex.
Indeed, the British pound advanced for the fourth session in a row vs. a weakened dollar this week as market participants continued to assess the Fed’s hawkish pause on Wednesday and the hawkish hike by the ECB the following day.
There were no data releases scheduled in the UK docket at the end of the week.
On June 16, GBP/USD reached a new high for 2023, hitting 1.2848. If this level is surpassed, it could potentially lead to a test of the 200-week SMA at 1.2872, which precedes the psychological 1.3000 hurdle. By contrast, provisional contention emerges at the 55-day SMA at 1.2486 prior to the June low of 1.2368 (June 5). Further south comes the May low of 1.2308 (May 25) ahead of the April low of 1.2274 (April 3) and the key 200-day SMA at 1.2042, all before reaching the 2023 low at 1.1802 (March 8). The everyday RSI entered the overbought ground near 71.
Resistance levels: 1.2848 1.3089 1.3146 (4H chart)
Support levels: 1.2626 1.2486 1.2368 (4H chart)
AUDUSD
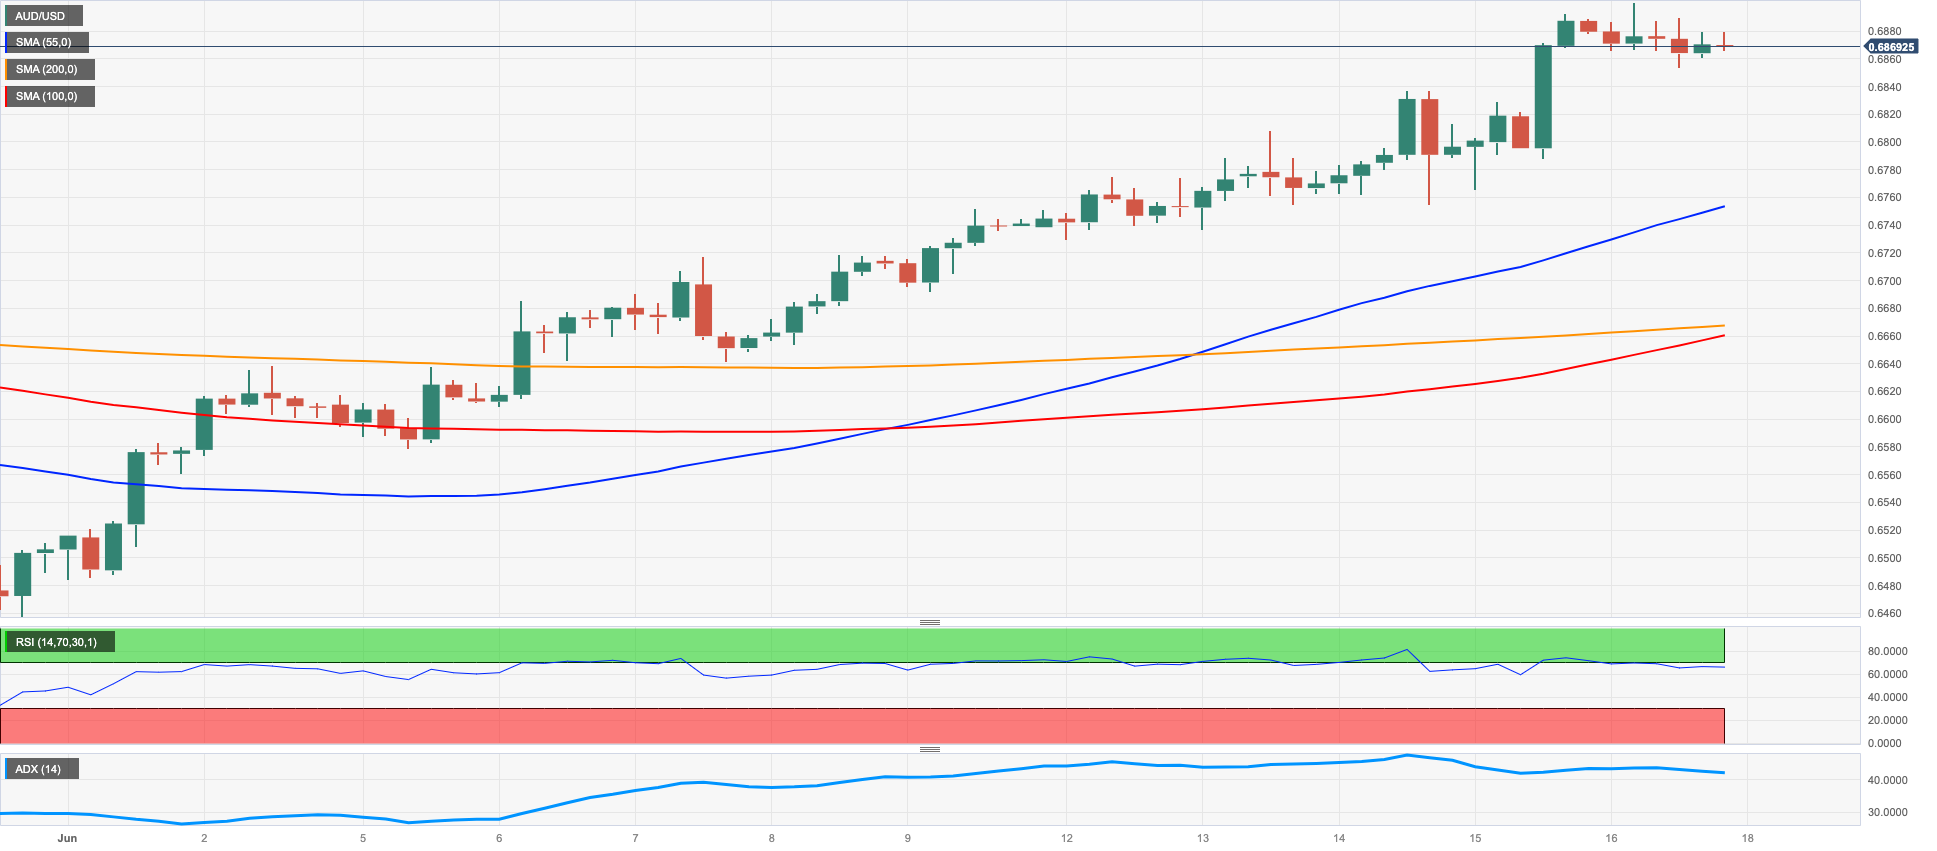
Towards the end of the week, AUD/USD's significant monthly upward trend appeared to have hit a roadblock just below the 0.6900 level. Throughout June, the Aussie dollar has seen gains in all but two sessions, returning to levels not seen since the end of February.
When examining the weekly chart, the pair has closed with gains for the past three consecutive weeks.
The minor decline in the spot price on a daily basis came in response to the late bounce in the greenback and due to technical reasons, as the pair had reached overbought levels. Additionally, small declines in copper prices and a lack of progress in iron ore prices contributed to the daily retracement.
There were no notable events on the Australian calendar on Friday.
Once the AUD/USD breaks over the June top of 0.6899 (June 16), it might make a move towards the crucial 0.7000 level. The weekly high of 0.7029 (February 14) is followed by the 2023 high of 0.7157 (February 2). On the flip side, the 100-day SMA at 0.6728 should provide brief contention ahead of the more relevant 200-day SMA at 0.6690. Extra losses from here might retest the 2023 low of 0.6458 (May 31), followed by the weekly lows of 0.6386 (November 10 2022) and 0.6272 (November 3). The daily RSI eased below 71, still in the overbought territory.
Resistance levels: 0.6899 0.6920 0.7029 (4H chart)
Support levels: 0.6755 0.6692 0.6641 (4H chart)
GOLD
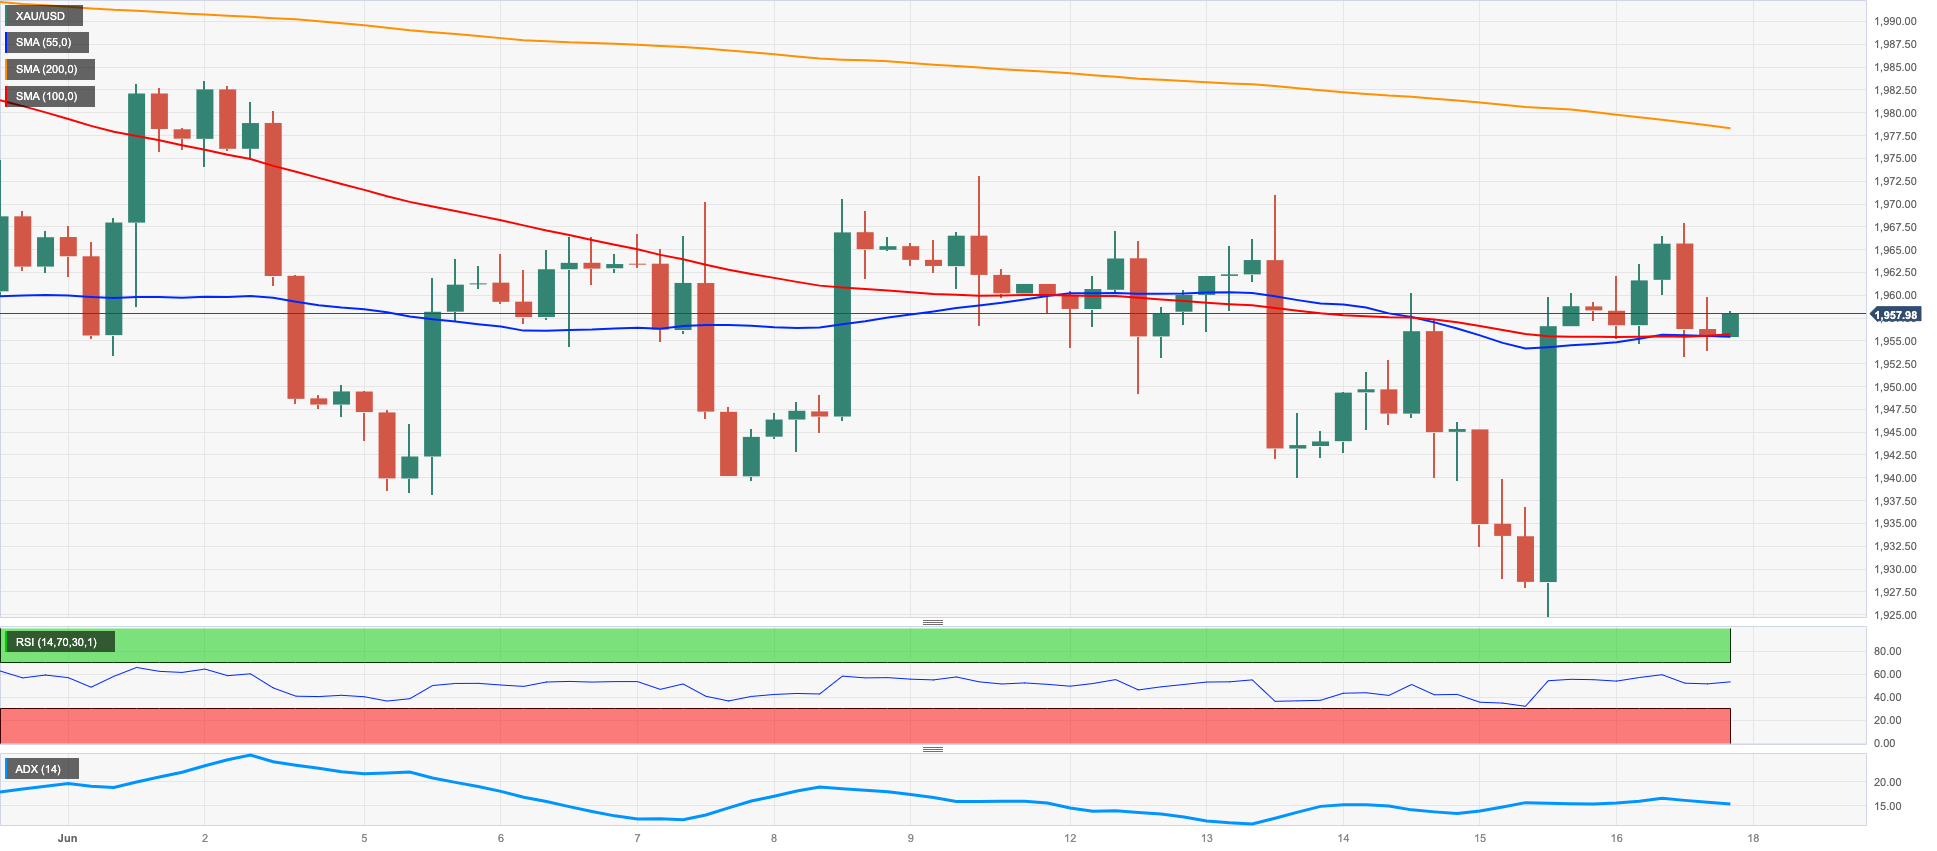
The price of an ounce of gold charted an inconclusive session and ended the week near the $1960 region, fading at the same time the marked bullish attempt seen on Thursday.
Gold’s upward movement lost traction in response to a late recovery in the value of the US dollar and a reversal of initial pessimism observed in US yields. Additionally, renewed concerns about an economic downturn seemed to have strengthened the demand for gold and somehow limited the daily downside.
If gold manages to break above the current consolidation range, there is a possibility that it will attack the June high of $1983 (June 2) and even reach the important milestone of $2000. Notably, there are no major resistance levels until it reaches the 2023 top of $2067 (May 4), the 2022 peak of $2070 (March 8) and finally the all-time record of $2075 (August 7, 2020). On the contrary, immediate support is found at the June low of $1925 (June 15), followed by the 200-day SMA at $1846 and the 2023 low of $1804 (February 28).
Resistance levels: $1973 $1983 $2022 (4H chart)
Support levels: $1925 $1885 $1809 (4H chart)
CRUDE WTI
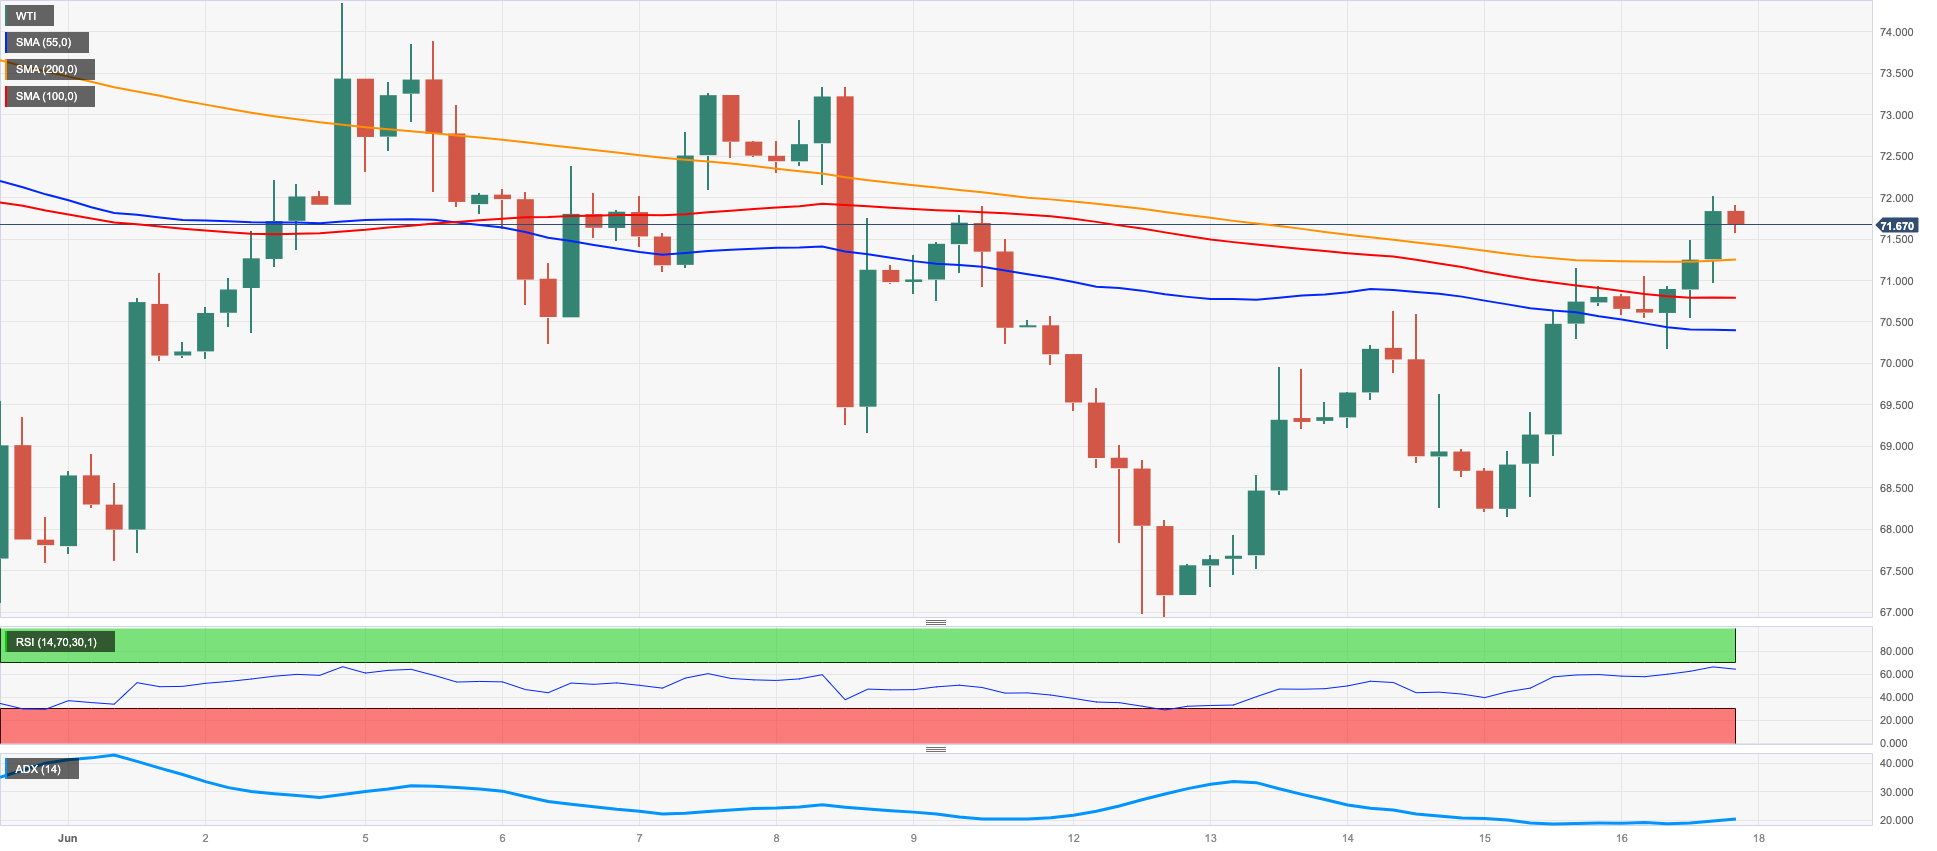
WTI prices continued to rise, building upon the gains seen on Thursday, and concluded the week above the $71.00 mark per barrel. This helped the commodity achieve modest gains for the week, following two consecutive declines.
During this period, crude oil prices were influenced by market concerns regarding the supply side. Notably, the anticipated increase in Chinese demand for crude oil and the recently announced oil output cuts by OPEC+ took centre stage.
These particular concerns overshadowed the revived speculation, driven by central banks, that the US and European economies could potentially experience a recession in the second half of the year. Additionally, the sluggish recovery of the Chinese economy from the impact of the COVID pandemic was also a contributing factor.
In terms of the oil industry calendar, driller Baker Hughes reported that the number of active oil rigs in the US dropped by 4 in the week leading up to June 16, bringing the total count to 552.
If there is a more significant bullish effort, WTI could potentially challenge the June high of $74.92 (June 5), which is affirmed by the temporary 100-day SMA and is located just before the crucial 200-day SMA at $78.34. Beyond that, the weekly top of $79.14 (April 24) is followed by the key barrier of $80.00 per barrel, the 2023 peak of $83.49 (April 12), and the November 2022 high of $93.73 (November 7). Having said that, the nearest support is located at the June low of $66.86 (June 13). If prices continue to drop further, the next possible target would be the 2023 low at $63.61 (May 4), followed by the December 2021 low at $62.46 (December 2) and the critical $60.00 level per barrel.
Resistance levels: $71.44 $73.24 $74.92 (4H chart)
Support levels: $70.15 $68.03 $66.77 (4H chart)
GER40
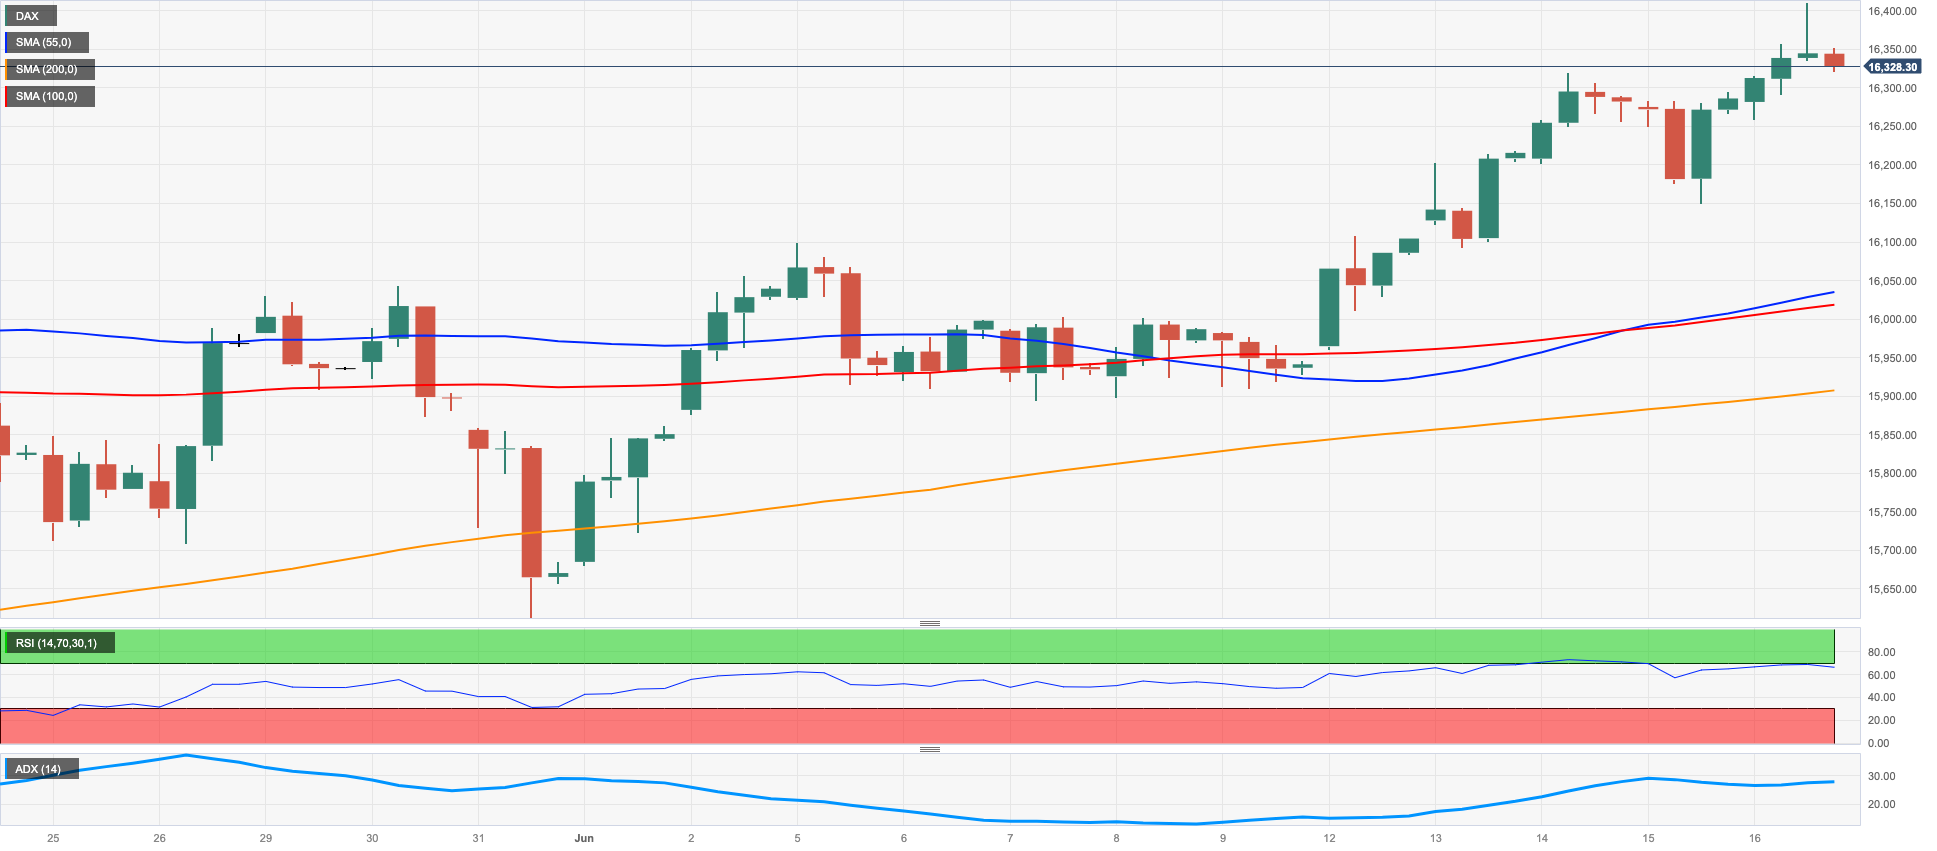
On Friday, German stocks represented by the DAX40 index reached a record-breaking high, surpassing the 16400 level. However, by the end of the session, they slipped just below that threshold.
In the meantime, stocks in Europe, overall, experienced an upward trend on Friday, driven by a combination of mixed risk sentiment, optimism regarding China's recovery, and the belief that both the European Central Bank (ECB) and the Federal Reserve are nearing the end of their interest rate hikes.
Despite this positive performance in stocks, there was a contrasting decrease in the German 10-year bund yields, which retreated to around 2.45% after experiencing three consecutive days of gains.
On June 16, the DAX40 set a new all-time high of 16427. In the case of a bearish effort, the temporary 55-day SMA at 15886 would be the first target, followed by the May low of 15629 (May 31), which appears reinforced by the interim 100-day SMA at 15620. If the market continues to fall, the emphasis will turn to the April low of 15482 (April 5), followed by a minor support level at 14809 (March 24) and the key 200-day SMA at 14640. Moving down, the March low of 14458 (March 20) enters the picture. The daily RSI ticked higher and surpassed the 64 mark.
Best Performers: Rheinmetall AG, Zalando SE, Sartorius AG VZO
Worst Performers: Infineon, BASF, Deutsche Bank AG
Resistance levels: 16427 17000? (4H chart)
Support levels: 16004 15719 15629 (4H chart)
NASDAQ
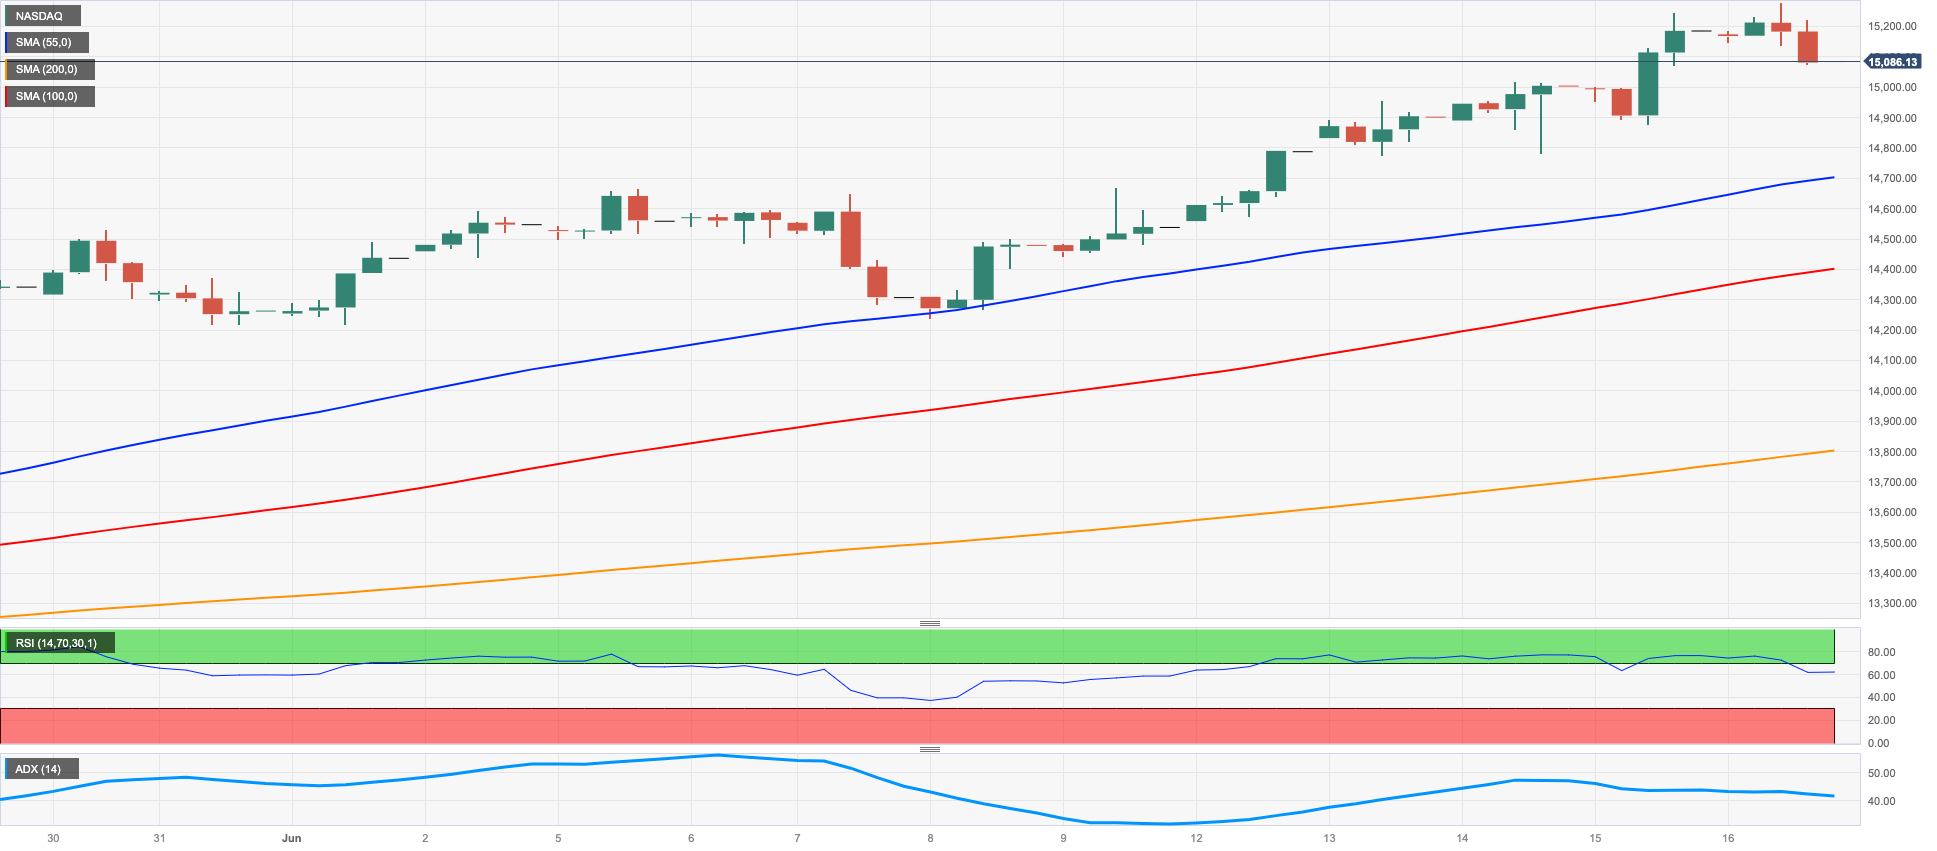
On Friday, the Nasdaq 100, the benchmark index for the tech sector, hit a new high for the year, reaching nearly 15300, before experiencing modest losses at the end of the session.
This index has reached levels not seen since January 2022 and has maintained a bullish position for another week. In fact, since the beginning of the year, the index has only had losses in 6 weeks.
The bearish note in the index was accompanied by losses in megacaps Microsoft and Apple, while the late bounce in the buck and the recovery in US yields all collaborated with the daily knee-jerk.
If the Nasdaq 100 index surpasses its 2023 high of 15284 (June 16), it may continue its upward trend and potentially reach the 16000 mark. The other way around, there are immediate support levels to monitor, including the interim 55-day SMA at 13606, closely followed by the weekly low of 13520 (May 24) and the May low of 12938 (May 4). The breakdown of the latter exposes a potential drop to the April low of 12724 (April 25), ahead of the 200-day SMA at 12243 and the March low of 11695 (March 13). The daily RSI remained well into the overbought territory near 79.
Top Gainers: Sirius XM, Walgreen Boots, Tesla
Top Losers: Autodesk, AMD, Netflix
Resistance levels: 15284 16017 16607 (4H chart)
Support levels: 14283 13520 13010 (4H chart)
DOW JONES
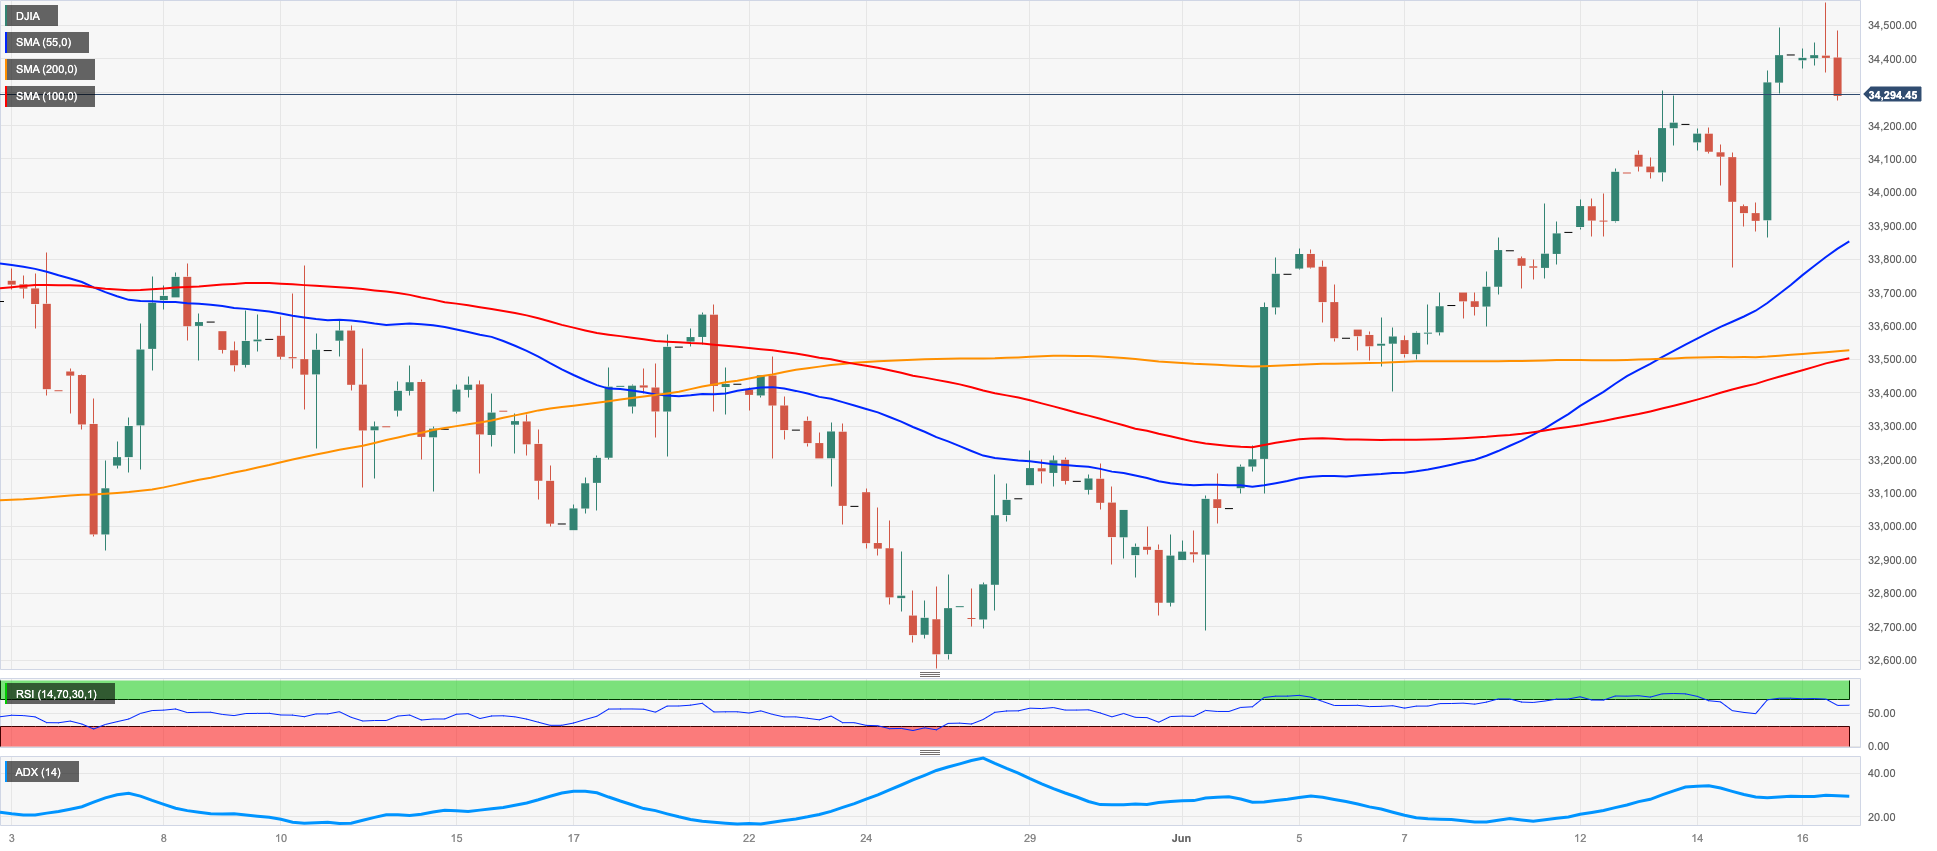
Market participants' growing optimism initially propelled the Dow Jones stock index to reach a new peak for 2023, nearing the 34600 level by the week's end. However, subsequent hawkish comments from Fed speakers (Barkin and Waller) poured cold water over that initial upbeat mood and sent stocks lower by the end of the day.
The initial positive sentiment was driven by the belief that the Federal Reserve may be nearing the conclusion of its tightening measures, which supported the upbeat atmosphere early on Friday’s NA session.
Despite the FOMC event leaving the possibility of resuming the hiking cycle open, particularly at the July meeting, the expectation that interest rates could reach a peak around 5.60% remained well and sound among traders.
Overall, the Dow Jones retreated 0.32% to 34299, the S&P500 dropped 0.37% to 4409, and the tech-reference Nasdaq Composite lost 0.68% to 13689.
The Dow Jones Industrial Average is expected to continue its upward trend. That said, the next up-barrier appears at 2023 peak at 34588 (June 16) seconded by the December 2022 high of 34712 (December 13) and the April 2022 high of 35492 (April 21). In opposition, there is temporary contention at the 55-day and 100-day SMAs at 33571 and 33361, respectively. These levels of support exist prior to reaching the key 200-day SMA of 32809. Further support levels include the May low of 32586 (May 25) and the March low of 2023 at 31429 (March 15). Down from here, the crucial support level to monitor is the 2022 low of 28660 (October 13). The RSI for the day appeared deflated below the 63 mark.
Top Performers: Walgreen Boots, Intel, Visa A
Worst Performers: Walt Disney, Microsoft, UnitedHealth
Resistance levels: 34588 34712 35492 (4H chart)
Support levels: 33783 33399 32586 (4H chart)
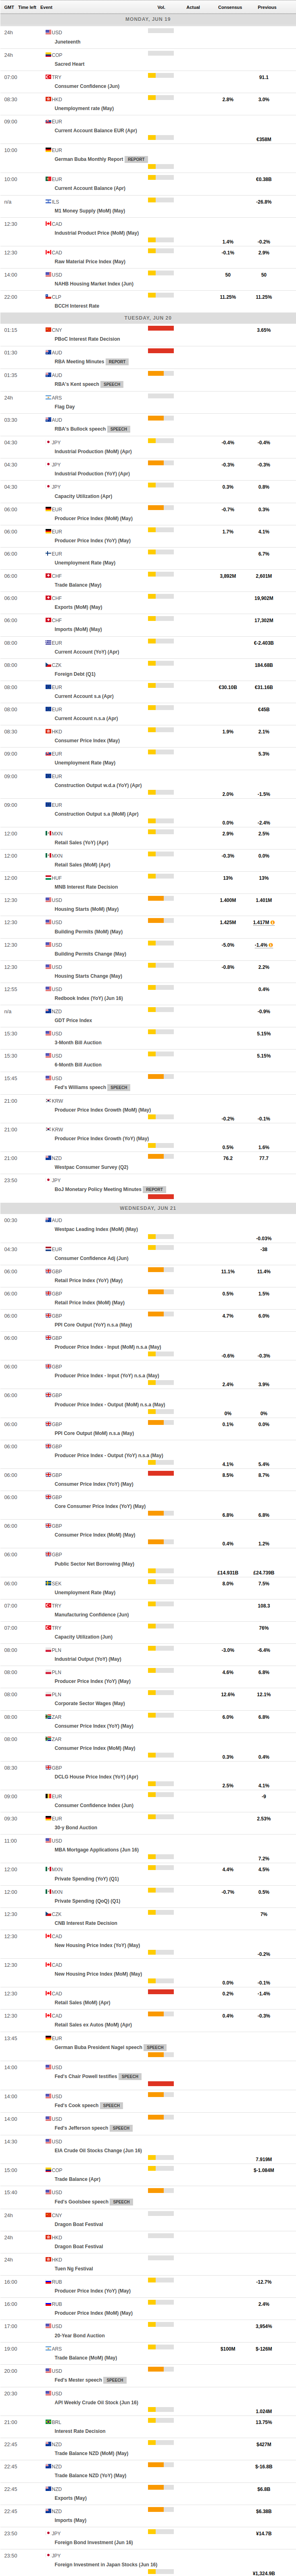
MACROECONOMIC EVENTS
All Information & Updates provided by:

All information relating to the financial markets available on this page has been prepared and issued by FXStreet (Forexstreet SL, Spain, Reg: B62498233) on the basis of publicly available information and all information believed to be reliable and does not conflict with Kuwaiti local laws, and all necessary care has been taken to before the company to ensure that the facts mentioned are correct from the source.
NCM Investment nor any of its directors or employees shall in any way be held responsible for the contents of this news, and the information contained on this page is intended only to provide clients with publicly available information and should not be construed as investment advice, report or analysis and/or constitute an offer or invitation to buy or sell financial instruments of any kind.
RISK WARNING: Forex and CFDs are highly risky leveraged products, as losses can exceed deposits. Please ensure you understand all the risks and take independent advice if necessary. NCM will segregate the clients based on the criteria of the regulator and its bylaws. NCM does not provide any advisory service; the material published does not constitute advice or a recommendation for a transaction in any financial instrument. NCM accepts no responsibility for any use of the content presented and any consequences of that use. Anyone acting on the information provided does so at their own risk.