
- Contact Us:
-

-

-

-


Daily Market Updates
21 Jun 2023
USDJPY
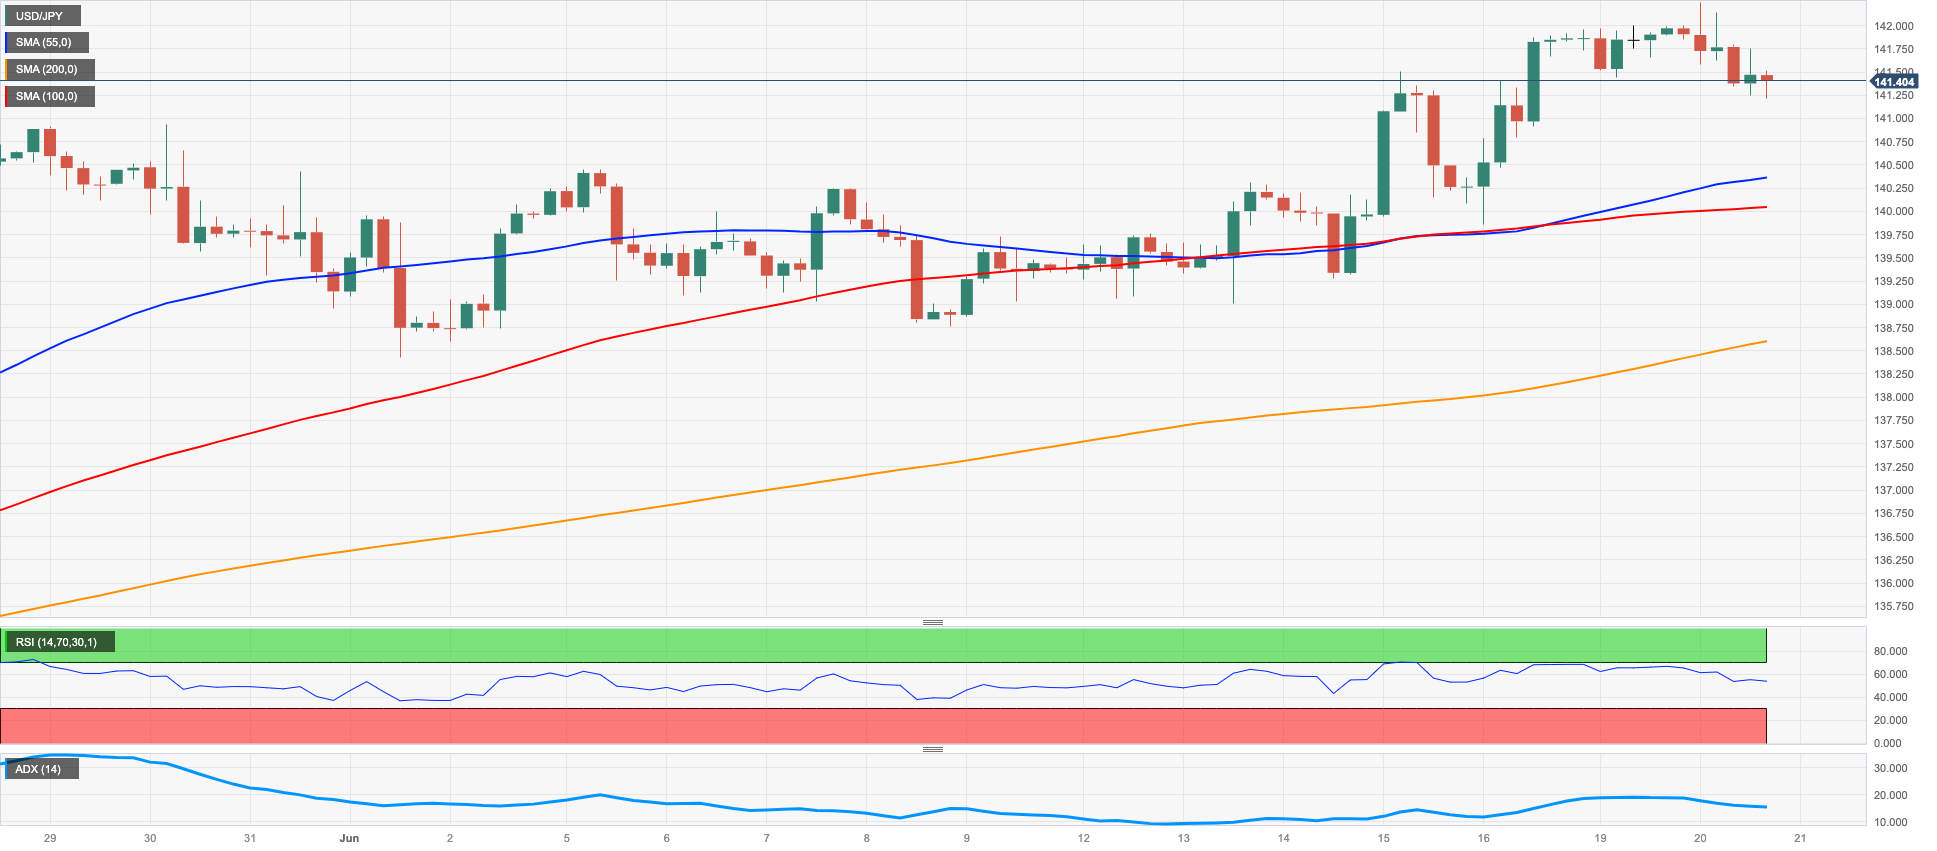
The Japanese yen gained support from increasing demand for safer assets, leading to the first decline in USD/JPY after three consecutive sessions of gains. However, before the decline, the pair hit a new 2023 high around 142.20 on Tuesday.
Market concerns over the slow recovery of the Chinese economy in the post-pandemic era, coupled with the marked retracement in US yields across the curve and the JGB 10-year yields trading below the 0.40% mark, contributed to the sentiment.
In Japanese economic news, Industrial Production contracted by 0.7% in the year to April and expanded by 0.7% monthly, while Capacity Utilization rose 3% MoM in the same month.
Despite the recent decline, the outlook for USD/JPY remains positive. The initial resistance lies at the 2023 peak of 142.25 (June 20), followed by the 2022 top at 151.94 (October 22) and the round level at 152.00. On the flip side, bearish movements face initial hurdles at the June low of 138.42 (June 1), before the important 200-day SMA at 137.20, along with the temporary 55-day and 100-day SMAs at 136.78 and 135.22, respectively. Further contention can be found at the weekly low of 133.01 (April 26), ahead of the minor support at 132.01 (April 13) and the April low at 130.62 (April 5). A break below the latter level could open the door to a decline towards the March low of 129.63 (March 24), prior to the February low of 128.08 (February 8). The daily RSI has ground lower to around the 63 level.
Resistance levels: 142.25 146.79 148.45 (4H chart)
Support levels: 141.24 139.85 139.01 (4H chart)
GBPUSD
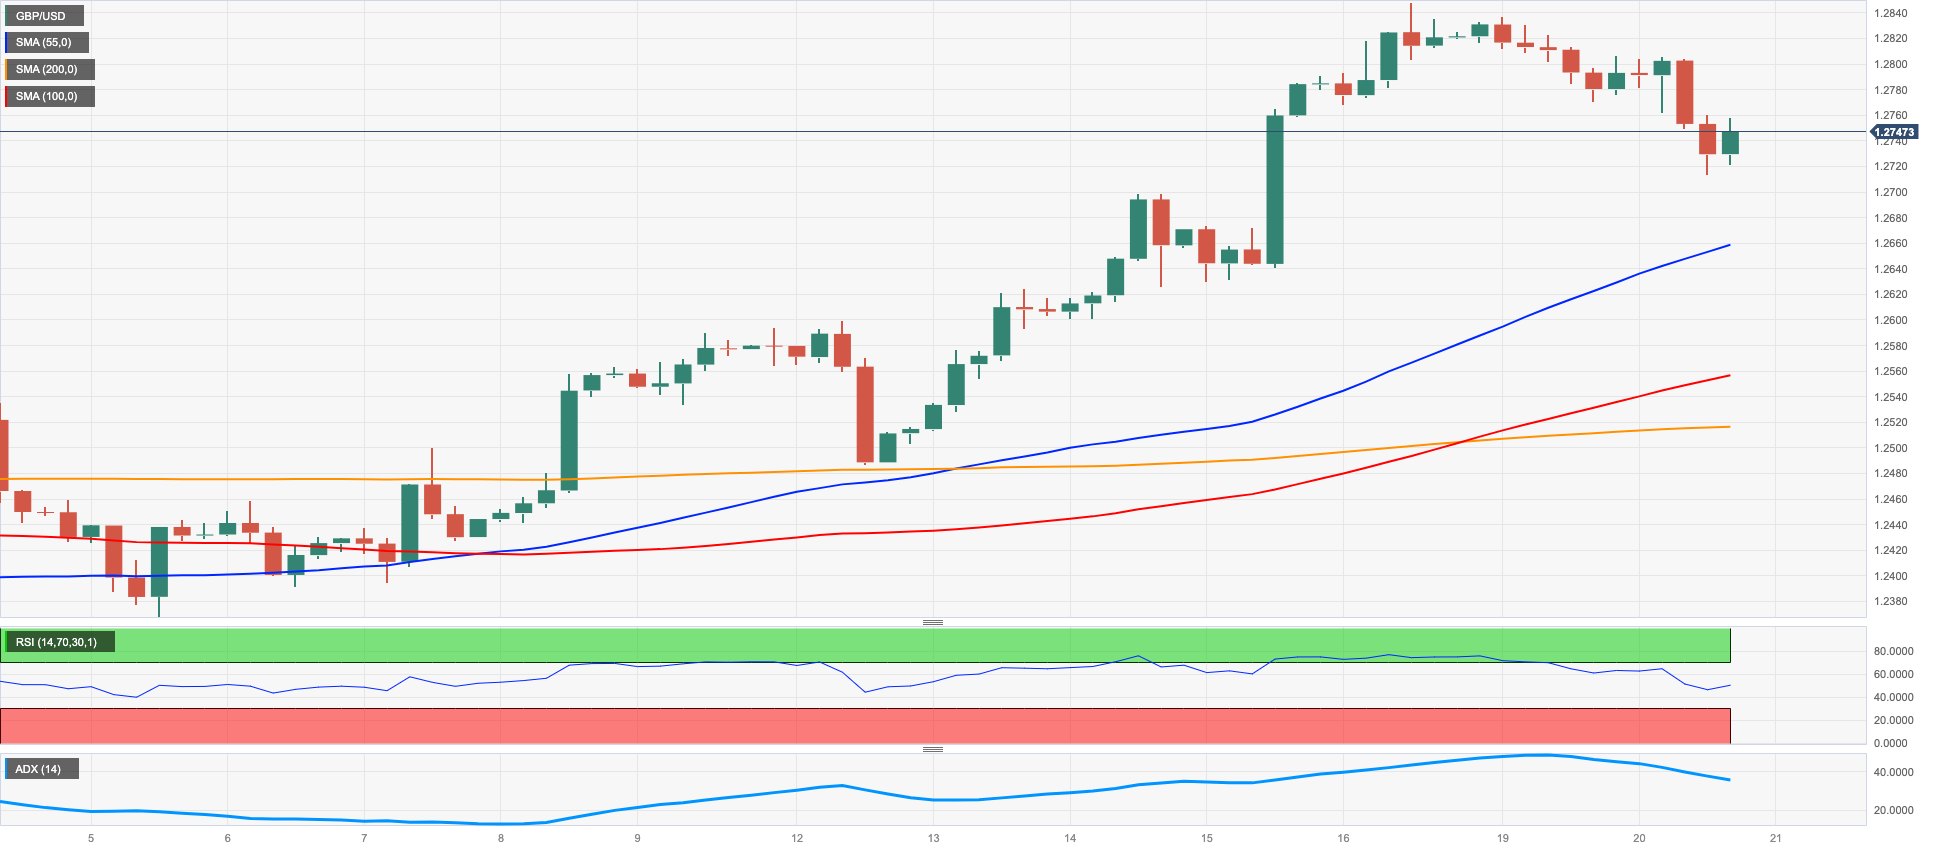
The US Dollar gained strength, causing GBP/USD to decline for the second consecutive session in what has been a discouraging start to the new trading week.
The global inflows into safe havens have intensified due to rising concerns about China's ability to recover from the pandemic.
Despite this setback, the British pound has a positive outlook ahead of the next BoE monetary policy meeting. Although the market expects a 25 bps rate hike from the central bank, the bets for rates to peak at 6% have lost some momentum in light of the current scenario of high inflation, tight labor market, and sticky core CPI.
Given the ongoing price action, there is a risk of further decline in GBP/USD in the short term, with temporary contention at the 55-day SMA at 1.2497, followed by the June low of 1.2368 (June 5). Further down lie the May low of 1.2308 (May 25), the April low of 1.2274 (April 3), and the key 200-day SMA at 1.2054, before reaching the 2023 low of 1.1802 (March 8). On the other hand, if GBP/USD surpasses the next hurdle at the 2023 top of 1.2848 (June 16), it could potentially test the 200-week SMA at 1.2872, followed by the psychological barrier of 1.3000. The daily RSI is currently at 64.
Resistance levels: 1.2848 1.3089 1.3146 (4H chart)
Support levels: 1.2713 1.2520 1.2486 (4H chart)
AUDUSD
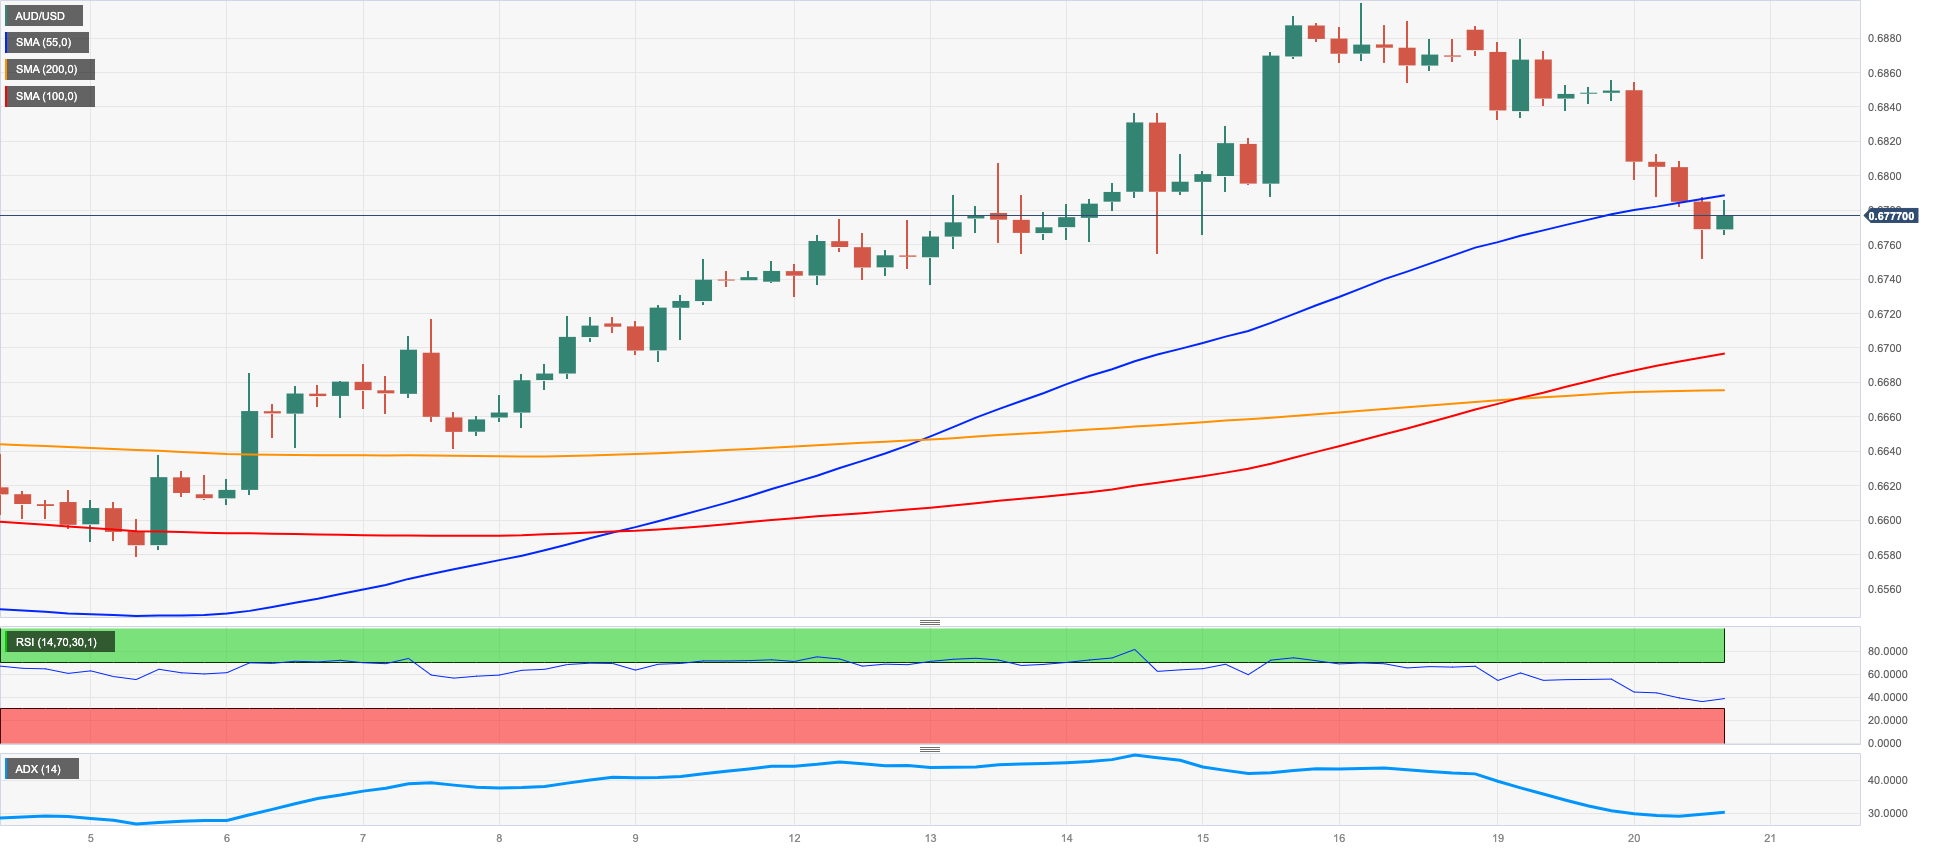
The AUD/USD continued its downward trend for the third consecutive session, displaying a strong conviction as it broke below the 0.6800 level and reached multi-day lows on Tuesday.
Growing worries regarding China's economic recovery, which is Australia's primary trading partner, along with the strengthening of the US dollar and the overall poor performance in commodity markets, all exerted downward pressure on the Australian dollar. These factors collectively contributed to the currency's daily decline.
The only release in Oz was the publication of the Minutes of the RBA's June Board meeting, which did not show a particularly hawkish message. The decision to raise rates was still portrayed as "finely balanced," and unlike earlier minutes, there was no discussion of the need for further increases. The Minutes contained elements that could support both bullish and bearish perspectives, citing potential inflation risks since May while also expressing optimism regarding productivity and unit labor costs going forward.
At her speech earlier in the session, RBA Deputy Governor M. Bullock argued that in order for inflation to reach the desired range, the labor market would need to become more flexible. She reportedly mentioned that "employment exceeds the level we deem appropriate for achieving our inflation target" and emphasized the RBA's objective of restoring the labor market and the market for goods and services to a level that aligns better with full employment, which is the projected endpoint in their forecasts. It was reported that this endpoint corresponds to an unemployment rate of 4.5%, in contrast to the current rate of 3.6%.
There is a risk of further correction for AUD/USD, with the first level of support being the provisional 100-day SMA at 0.6721, followed by the more significant 200-day SMA at 0.6690. If the pair continues to decline, it may retest the 2023 low of 0.6458 (May 31), followed by the weekly lows of 0.6386 (November 10, 2022) and the November 2022 low of 0.6272 (November 3). However, if the bulls take control, the next hurdle is the June peak of 0.6899 (June 16), followed by the critical level of 0.7000. The weekly high of 0.7029 (February 14) comes next, followed by the 2023 top of 0.7157 (February 2). The daily RSI has retreated to around 57.
Resistance levels: 0.6899 0.6920 0.7029 (4H chart)
Support levels: 0.6752 0.6677 0.6641 (4H chart)
GOLD
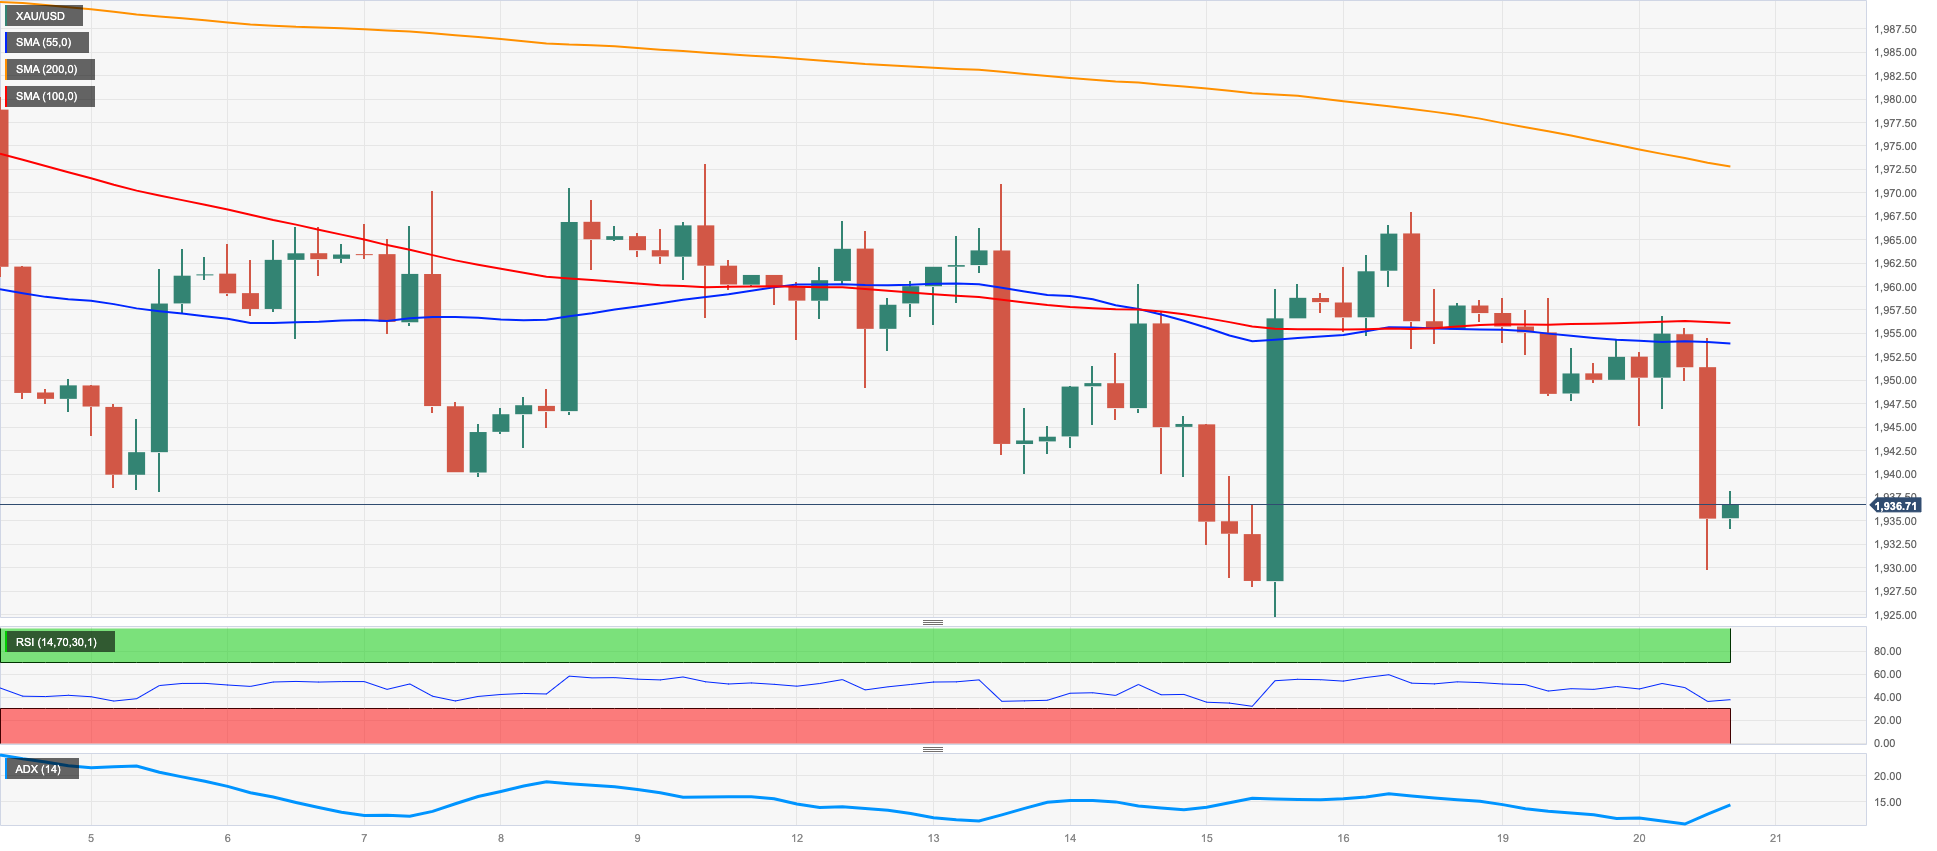
Gold prices experienced a third consecutive decline and revisited the $1930 range per troy ounce on Tuesday.
Despite this ongoing downward movement, the precious metal remained trapped within a multi-week consolidation phase that began in mid-May.
Gold prices fell due to the strength of the US dollar, which gained momentum in response to concerns over China's economic recovery and the perceived insufficiency of the rate cut of the 1-year medium-term lending facility (MLF) by the PBoC during early trade.
If gold manages to break out of its current consolidation range, it could potentially target the June high of $1983 (June 2) and even surpass the significant milestone of $2000. It is worth noting that there are no major resistance levels until it reaches the 2023 peak of $2067 (May 4), the 2022 high of $2070 (March 8), and ultimately the all-time record of $2075 (August 7, 2020). The other way around, immediate support levels for gold can be found at the June low of $1925 (June 15), followed by the 200-day SMA at $1848. The 2023 low of $1804 (February 28) comes next, which is followed by the critical level of $1800 per troy ounce.
Resistance levels: $1973 $1983 $2022 (4H chart)
Support levels: $1925 $1885 $1809 (4H chart)
CRUDE WTI
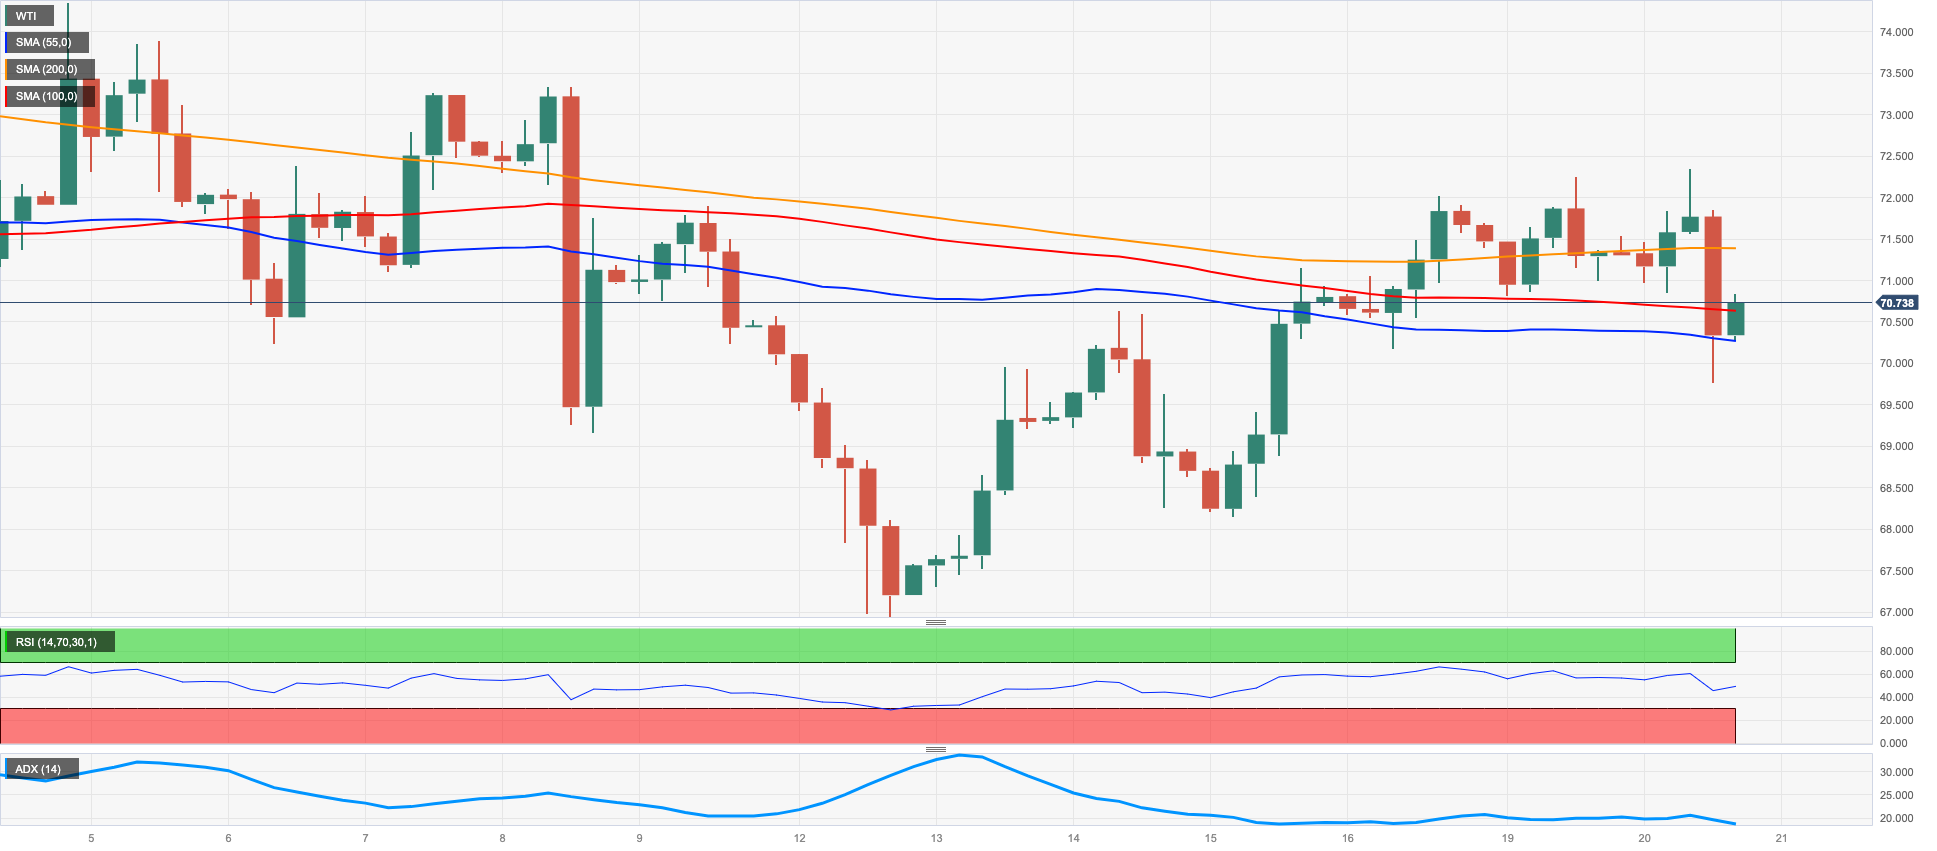
WTI crude oil prices extended their negative start to the week by falling below the crucial $70.00 level on Tuesday but managed to regain some traction later on.
Once again, concerns regarding China's economic recovery and its direct impact on crude oil demand weighed heavily on oil prices, keeping them depressed.
Furthermore, the strengthening US dollar contributed to the negative sentiment among traders, along with the widespread perception that the Federal Reserve is likely to resume tightening monetary policy as early as next month.
In the calendar, the American Petroleum Institute (API) and the Energy Information Administration (EIA) are scheduled to release reports on US crude oil inventories for the week ending June 16 on Wednesday and Thursday respectively, as per usual.
If bulls regain the upper hand, WTI could potentially challenge the June high of $74.92 (June 5). This level is supported by the temporary 100-day SMA ($74.51) and is situated just before the critical 200-day SMA at $78.21. Noteworthy resistance levels beyond that include the weekly peak of $79.14 (April 24), followed by the significant barrier of $80.00 per barrel, the 2023 top of $83.49 (April 12), and the November 2022 high of $93.73 (November 7). By contrast, the nearest support level is found at the June low of $66.86 (June 13). South from here, the next possible target would be the 2023 low at $63.61 (May 4), ahead of the December 2021 low at $62.46 (December 2), and the critical level of $60.00 per barrel.
Resistance levels: $72.33 $73.24 $74.92 (4H chart)
Support levels: $69.74 $68.03 $66.77 (4H chart)
GER40
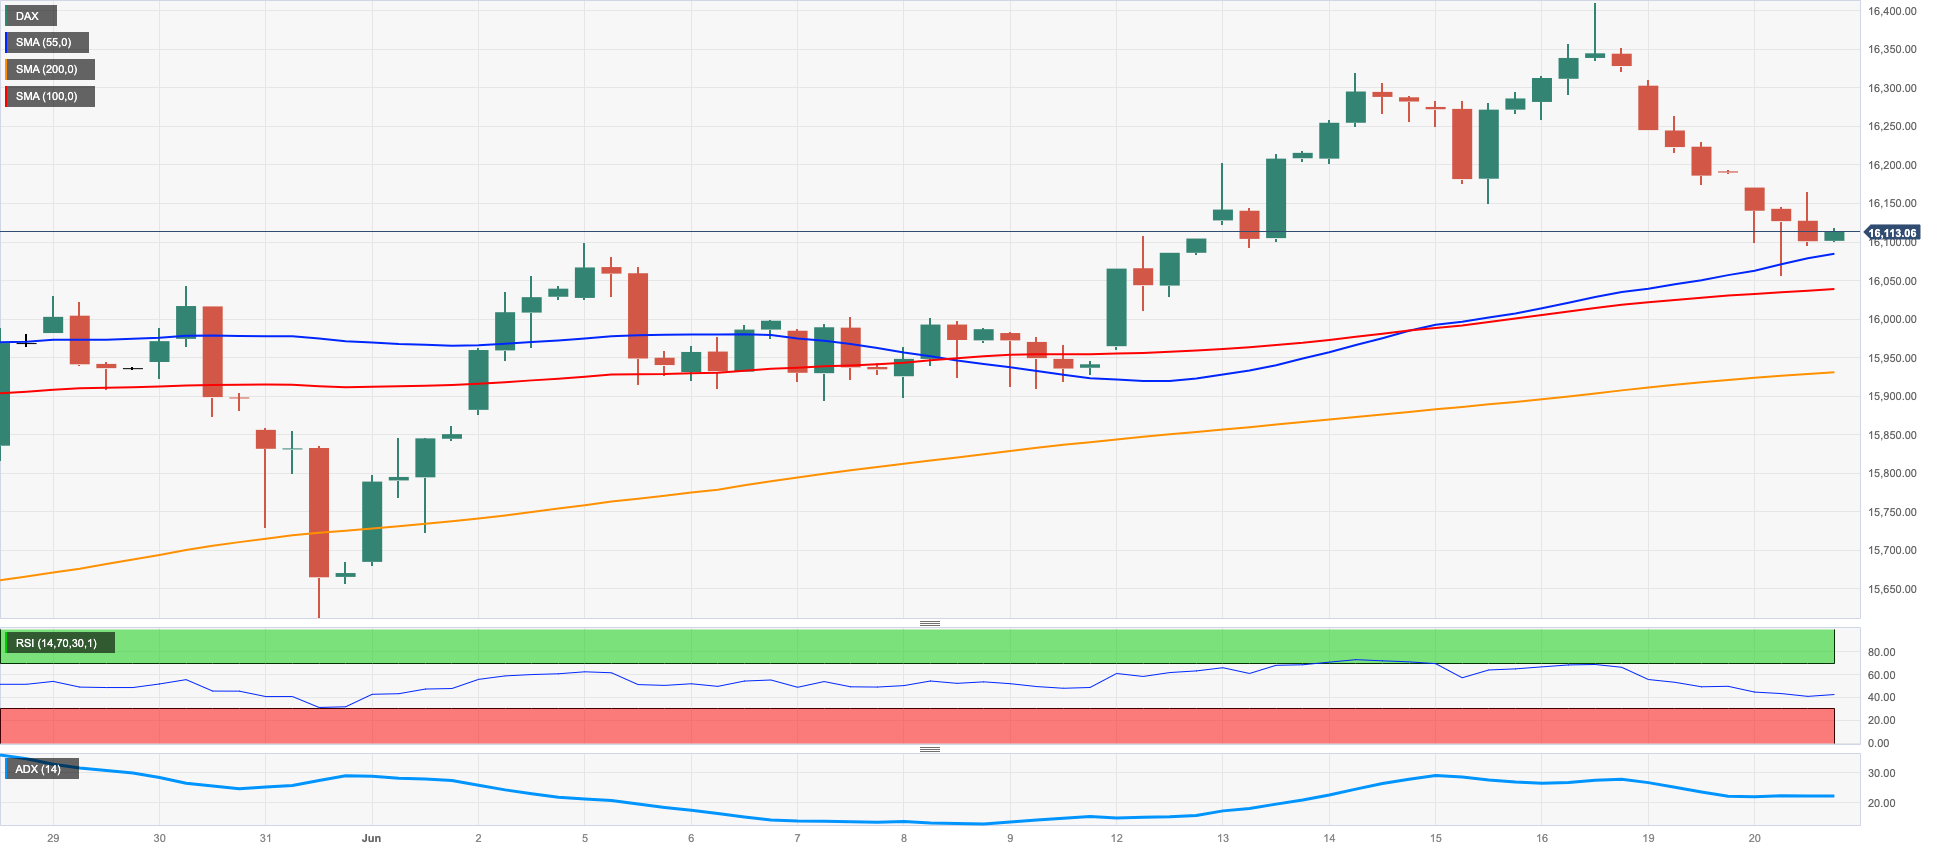
On Tuesday, Germany's reference DAX40 extended its negative start to the new trading week and modestly retreated to the boundaries of the key support level at the 16000 mark.
The downbeat tone in European stocks was due to disappointing news from China after the PBoC lowered the 1-year MLF less than what markets had expected, intensifying concerns around the uneven economic recovery.
Furthermore, Chinese lenders also lowered their reference lending rates in line with last week's central bank cut, which was a humble cut that came short of investors’ hopes.
Following their US and global peers, German 10-year bund yields dropped markedly to multi-day lows around 2.40%.
The DAX40 reached a new all-time high of 16427 on June 16. In the event of a bearish endeavour, the first objective would be the temporary 55-day SMA at 15912, ahead of the May low of 15629 (May 31), which would be supported by the interim 100-day SMA (15641). Extras losses could revisit the April low of 15482 (April 5) seconded by a minor support level at 14809 (March 24) and the significant 200-day SMA at 14673. Down from here comes the March low of 14458 (March 20). The daily RSI dropped further below the 53 zone.
Best Performers: Covestro, MTU Aero, Hannover Rueck SE
Worst Performers: Continental AG, BASF, Siemens Healthineers
Resistance levels: 16427 17000? (4H chart)
Support levels: 16069 15769 15629 (4H chart)
NASDAQ
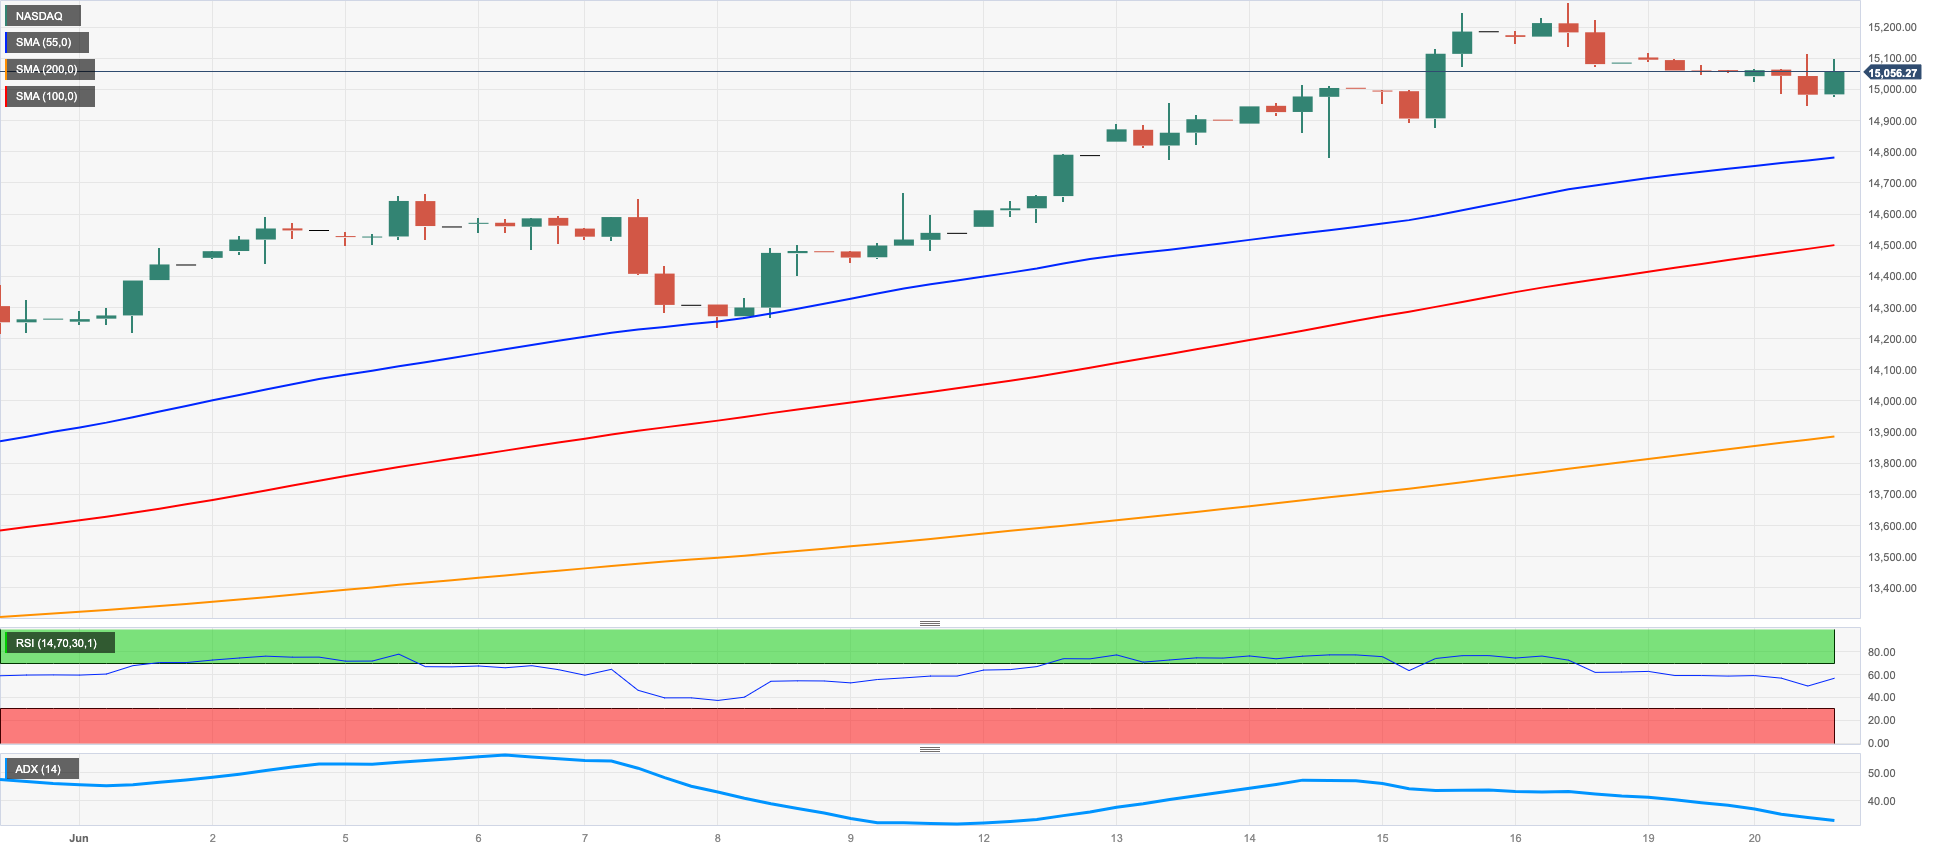
On Tuesday, US tech stocks experienced a back-and-forth movement, hovering just above the important 15000 level.
The Nasdaq 100, which serves as a tech benchmark, showed indecisive price action. This was influenced by the strong performance of electric vehicle manufacturers Tesla and Rivian Automotive and the general investor preference for AI-related stocks. Additionally, the decline in US yields contributed to the positive momentum.
However, there were some negative factors to consider. These included the strength of the US dollar and investor caution ahead of Chair Powell's testimonies scheduled for Wednesday and Thursday. Furthermore, market expectations of a quarter-point interest rate hike by the Fed in July added to the sense of prudence.
If the Nasdaq 100 index surpasses its 2023 high of 15284 (June 16), it could continue its upward trend and potentially reach the 16000 level. On the other hand, there are immediate support levels to monitor. These include the interim 55-day SMA at 13643, followed closely by the weekly low of 13520 (May 24) and the May low of 12938 (May 4). A break below the latter level could expose the index to a potential decline towards the April low of 12724 (April 25), followed by the 200-day SMA at 12257 and the March low of 11695 (March 13). The daily RSI remained well in the overbought region north of the 74 level.
Top Gainers: Rivian Automotive, Tesla, PayPal Holdings Inc
Top Losers: PDD Holdings DRC, JD.com Inc Adr, Enphase
Resistance levels: 15284 16017 16607 (4H chart)
Support levels: 14283 13520 13059 (4H chart)
DOW JONES
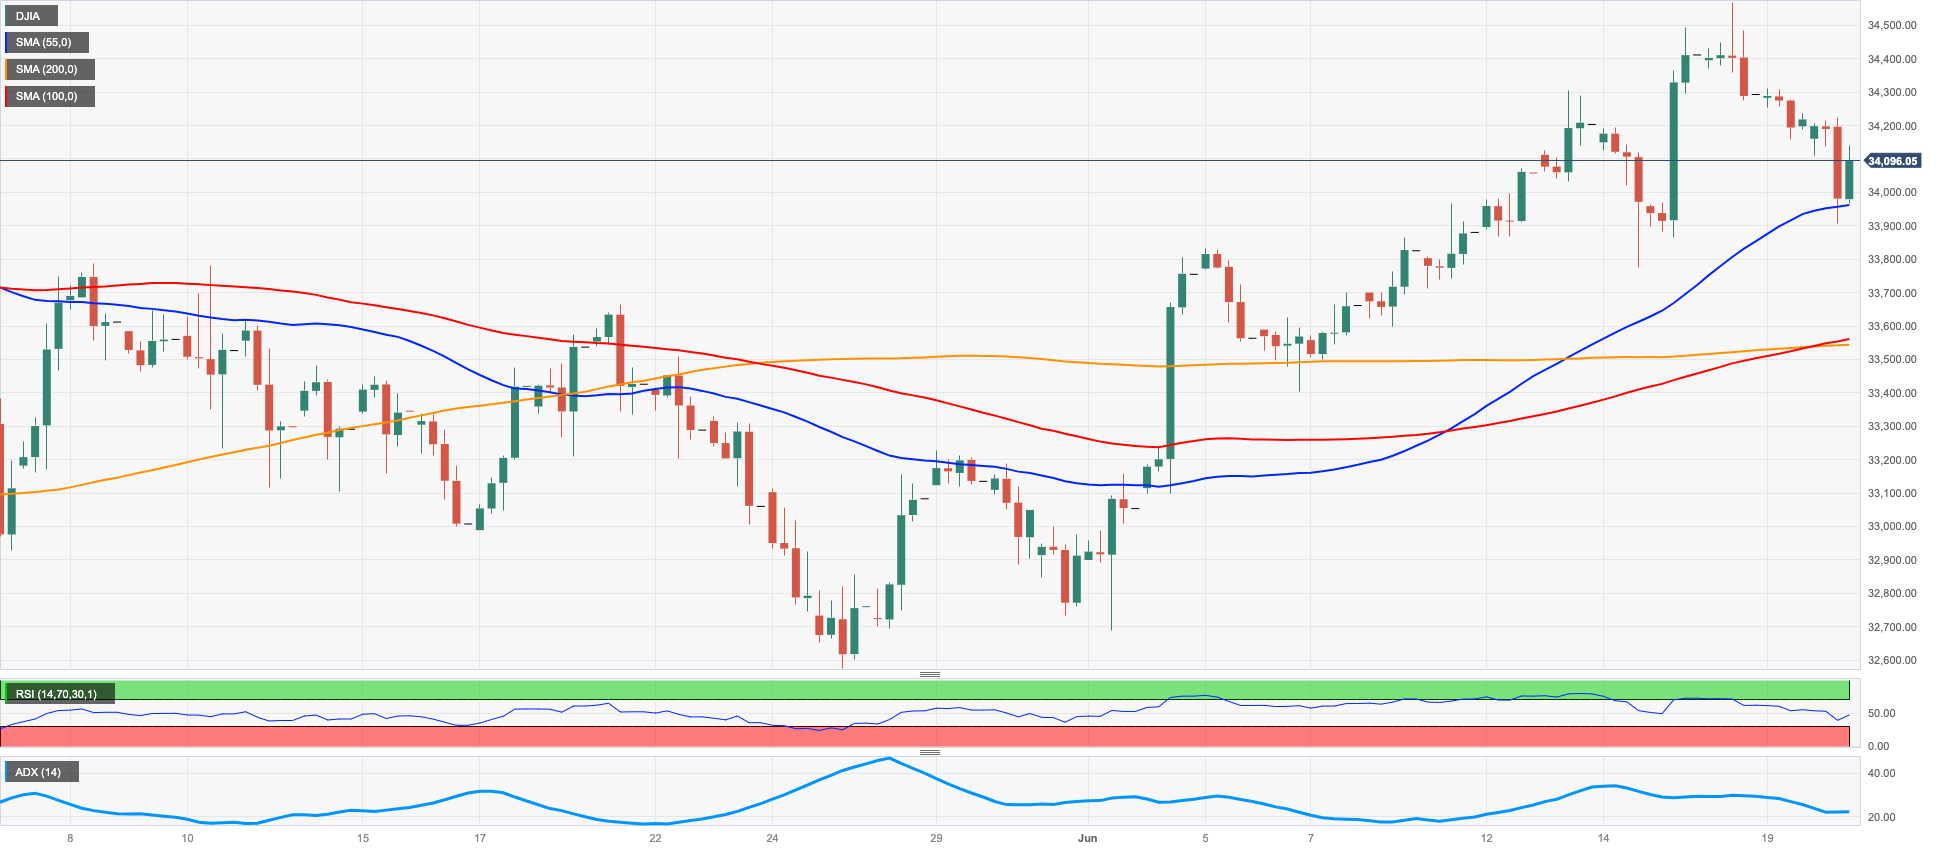
On Tuesday, as US traders returned to their desks following Monday's Juneteenth holiday, US equities tracked by the Dow Jones retreated further and briefly fell below the key support level of 34000 due to the sour sentiment surrounding the risk-linked galaxy.
Disheartening headlines from China, as well as the smaller-than-expected rate cut by the PBoC, hurt risk appetite and prompted sellers to remain in control. Additionally, cautiousness ahead of Chief Powell's semiannual testimonies and speculation over an extra hike in July also contributed to keeping buyers at bay.
Overall, the Dow Jones retreated 0.52% to 34120, the S&P500 dropped 0.29% to 4396, and the tech-reference Nasdaq Composite lost 0.04% to 13683.
The Dow Jones Industrial Average is expected to continue its upward trend. That said, the next significant resistance level is at the 2023 peak of 34588 (June 16), followed by the December 2022 high of 34712 (December 13) and the April 2022 top of 35492 (April 21). Instead, transitory support can be found at the 55-day and 100-day SMAs at 33592 and 33364, respectively, prior to the critical 200-day SMA at 32821. Further support levels include the May low of 32586 (May 25) and the March 2023 low of 31429 (March 15). If the index drops further, the crucial support level to watch is the 2022 low of 28660 (October 13). The RSI for the day breached the 59 level.
Top Performers: UnitedHealth, Salesforce Inc, Merck&Co
Worst Performers: Intel, Boeing, Nike
Resistance levels: 34588 34712 35492 (4H chart)
Support levels: 33783 33399 32586 (4H chart)
MACROECONOMIC EVENTS

All Information & Updates provided by:

All information relating to the financial markets available on this page has been prepared and issued by FXStreet (Forexstreet SL, Spain, Reg: B62498233) on the basis of publicly available information and all information believed to be reliable and does not conflict with Kuwaiti local laws, and all necessary care has been taken to before the company to ensure that the facts mentioned are correct from the source.
NCM Investment nor any of its directors or employees shall in any way be held responsible for the contents of this news, and the information contained on this page is intended only to provide clients with publicly available information and should not be construed as investment advice, report or analysis and/or constitute an offer or invitation to buy or sell financial instruments of any kind.
RISK WARNING: Forex and CFDs are highly risky leveraged products, as losses can exceed deposits. Please ensure you understand all the risks and take independent advice if necessary. NCM will segregate the clients based on the criteria of the regulator and its bylaws. NCM does not provide any advisory service; the material published does not constitute advice or a recommendation for a transaction in any financial instrument. NCM accepts no responsibility for any use of the content presented and any consequences of that use. Anyone acting on the information provided does so at their own risk.