
- Contact Us:
-

-

-

-


Daily Market Updates
22 Jun 2023
USDJPY
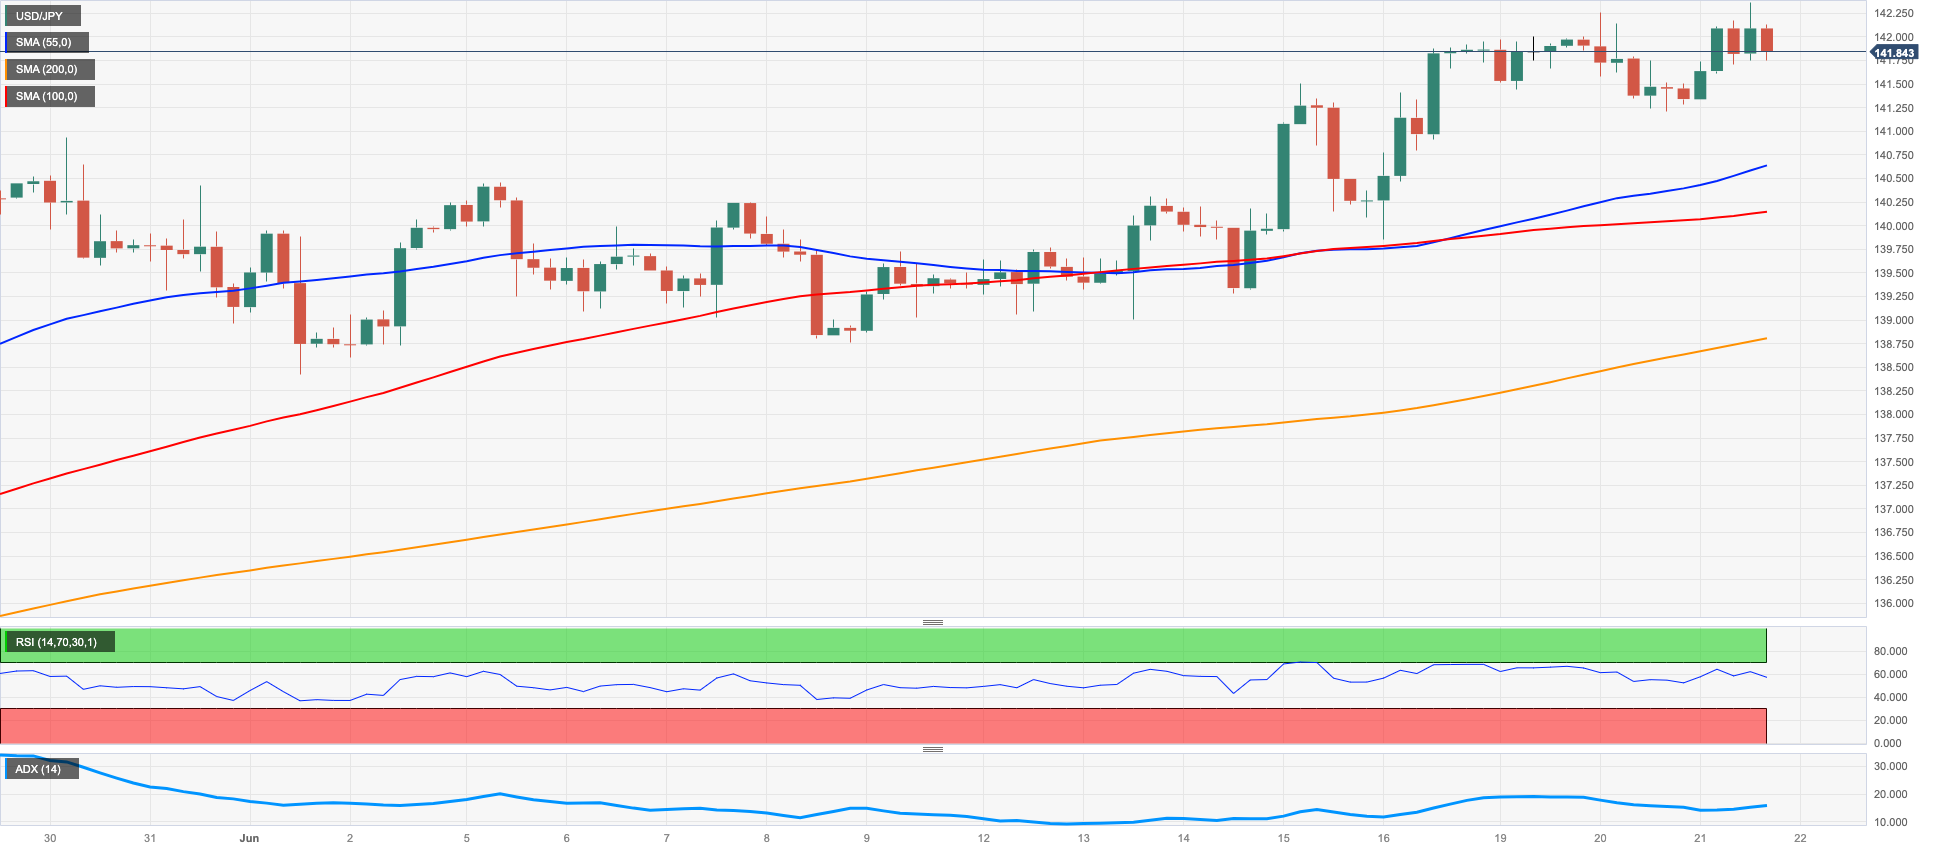
After reaching new highs for 2023 around 142.40, USD/JPY faced downward pressure and retreated to levels below 142.00 in line with the reversal of the US dollar's earlier gains.
The decline in the greenback followed Chief Powell's testimony before Congress on Wednesday, while US yields managed to stabilize and reverse the previous day's decline across the curve.
In terms of data from Japan, the Reuters Tankan Index improved to 8 in June (from 6). The Bank of Japan's meeting minutes for June revealed a consensus among policymakers to maintain ultra-low interest rates, although some expressed the need to avoid delaying interest rate hikes.
Still around the BoJ, board member S. Adachi stated that the likelihood of adjusting the bank's yield curve control policy at the upcoming rate review in the following month was low. Adachi reportedly cited the decreasing market distortions and lack of price trend data as reasons behind this stance.
The current outlook for USD/JPY remains positive. Against that, initial resistance levels are observed at the 2023 peak of 142.37 (June 21) ahead of the 2022 high at 151.94 (October 22) and the round level of 152.00. On the other hand, bearish movements may encounter initial hurdles at the June low of 138.42 (June 1), seconded by the significant 200-day SMA at 137.19. Additional contention levels include the temporary 55-day and 100-day SMAs at 136.97 and 135.35 respectively. Down from here comes the weekly low of 133.01 (April 26), the minor support at 132.01 (April 13), and the April low at 130.62 (April 5), all prior to the key 130.00 mark and ahead of the March low of 129.63 (March 24) and the February low of 128.08 (February 8). The daily RSI ticked higher past 67.
Resistance levels: 142.37 146.79 148.45 (4H chart)
Support levels: 141.24 139.85 139.01 (4H chart)
GBPUSD
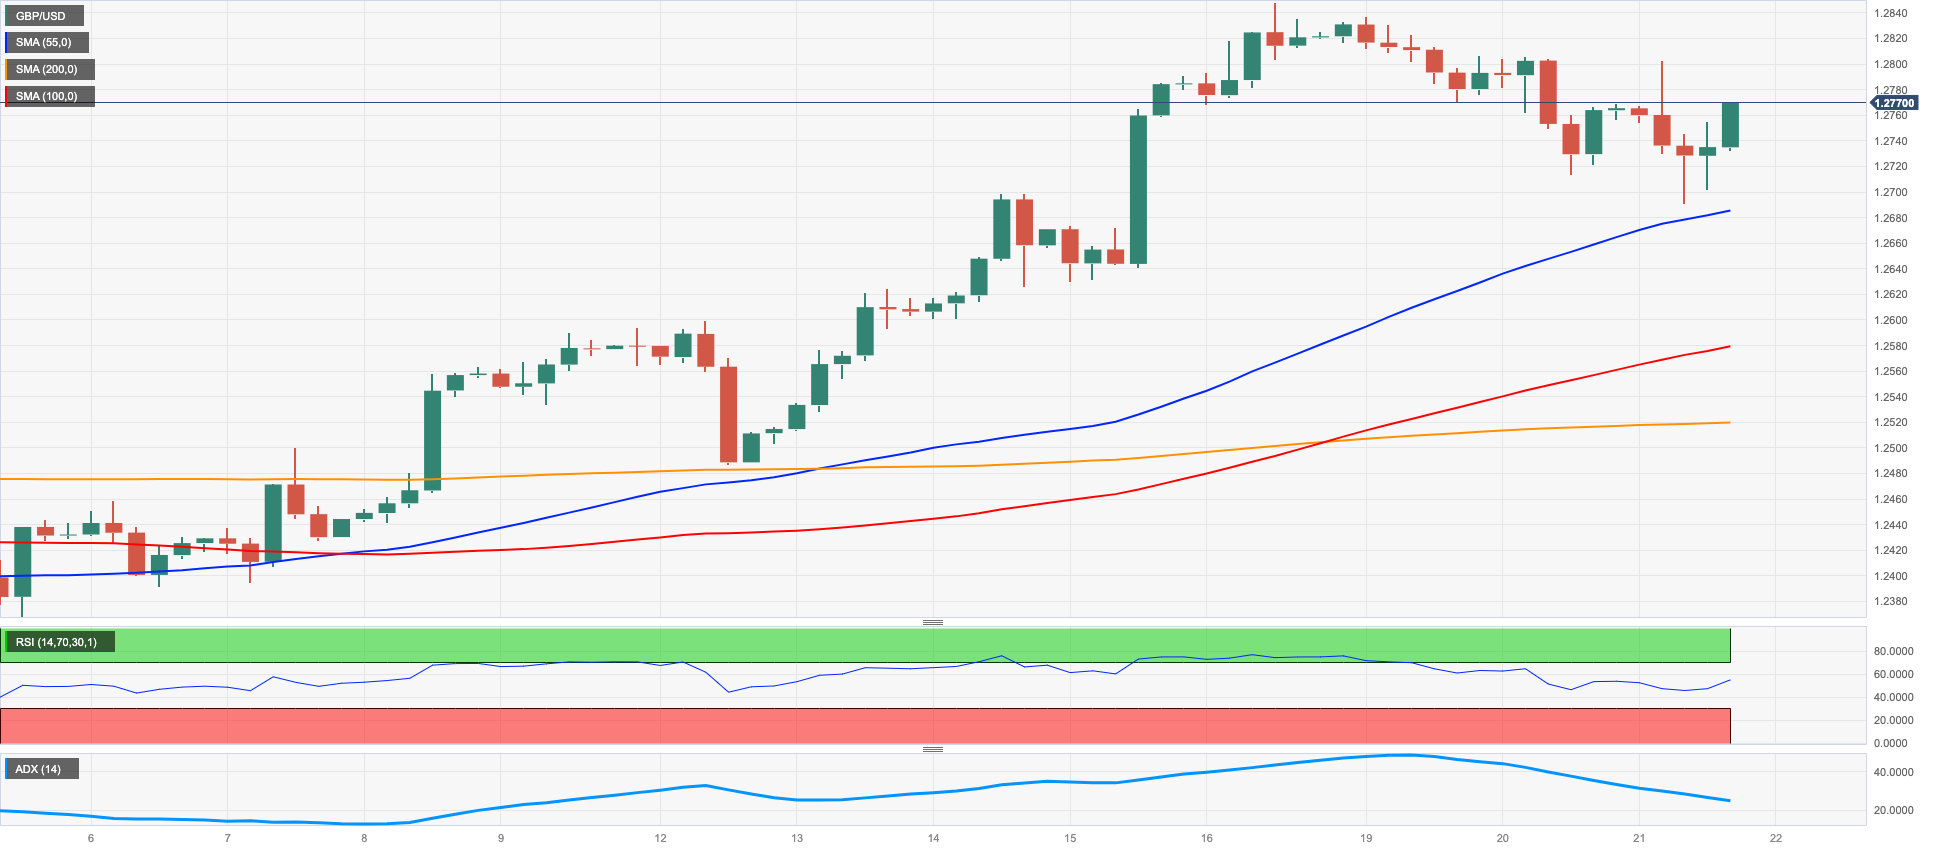
On Wednesday, the British pound initially weakened and briefly pushed GBP/USD below the 1.2700 support level, due to the persistent strengthening of the US dollar.
However, the late strong drop in the dollar reignited some buying interest and lifted Cable back to the positive territory, although still below the 1.2800 hurdle.
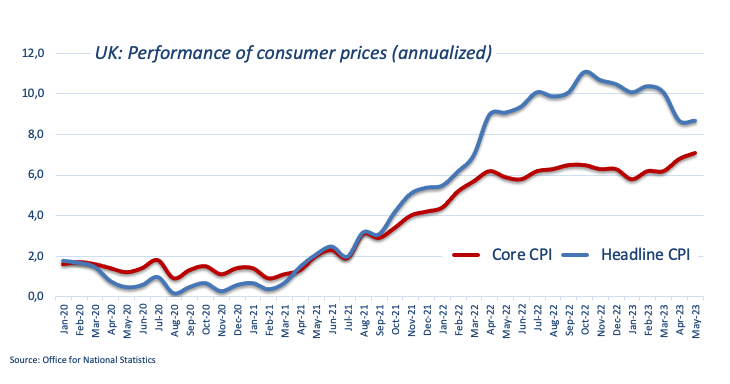
Despite UK inflation figures remaining high in May, with headline CPI rising 8.7% over the last twelve months and 7.1% YoY in Core CPI, the sterling failed to gain lasting momentum.
These inflation figures are expected to keep the tightening prospects around the BoE unchanged for the next few months, with market participants now leaning to a potential half-point rate raise at the June 22 event in the current scenario of persistently high inflation and a tight labor market.
Other data from Wednesday showed a decrease in Public Sector Net Borrowing to £19.22B and a slight improvement in CBI Industrial Trends Orders to -15 in June.
Considering the ongoing price action, there is a risk of further decline in GBP/USD in the short term, with the immediate contention at the 2021-2023 support line, today around 1.2585 seconded by the interim 55-day SMA at 1.2502 and the June low of 1.2368. Further pullbacks could take the pair to the May low of 1.2308, the April low of 1.2274, and the key 200-day SMA at 1.2060, before reaching the 2023 low of 1.1802. Just the opposite, the breakout of the 2023 top of 1.2848 could potentially test the 200-week SMA at 1.2872 ahead of the psychological barrier of 1.3000. The everyday RSI slipped further south and revisited 60.
Resistance levels: 1.2848 1.3089 1.3146 (4H chart)
Support levels: 1.2699 1.2523 1.2486 (4H chart)
AUDUSD
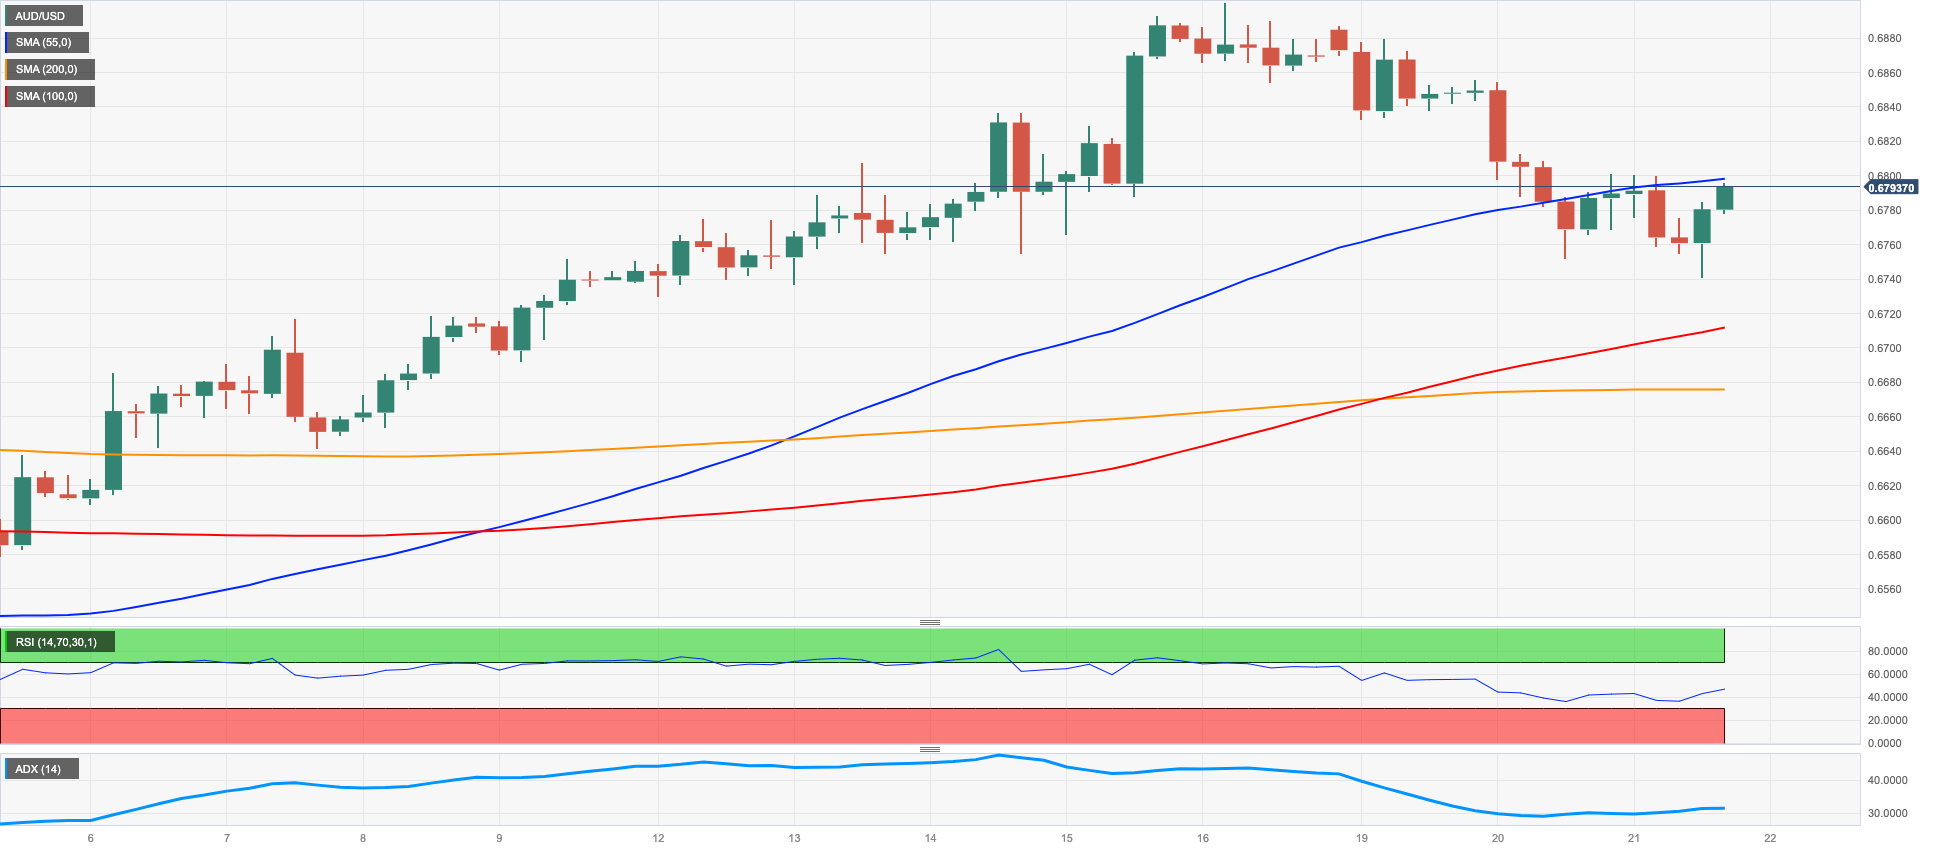
On Wednesday, AUD/USD rebounded after three consecutive daily declines and closed the session with slight gains near the 0.6800 region, primarily due to the late decline in the US dollar.
The greenback's rapid drop was due to Fed Chairman Powell's semiannual testimony before Congress, which failed to surprise markets. His remarks were consistent with the hawkish tone already observed at the June 14 FOMC event.
Additionally, the Aussie dollar received support from the recovery in the commodity complex, with copper prices and iron ore posting decent gains.
In Australia, the Westpac Leading Index remained unchanged in May, matching the previous reading.
There is still a possibility of further correction for AUD/USD, with the first level of support being the 100-day SMA at 0.6718, seconded by the more significant 200-day SMA at 0.6690. South from here, the pair may retest the 2023 low of 0.6458, ahead of the weekly lows of 0.6386 (November 10 2022) and the November 2022 low of 0.6272 (November 3). However, if the bulls take control, the next hurdle is the June peak of 0.6899 (June 16), prior to the critical level of 0.7000, the weekly high of 0.7029 (February 14), and the 2023 top of 0.7157 (February 2). The daily RSI improved marginally north of 58.
Resistance levels: 0.6899 0.6920 0.7029 (4H chart)
Support levels: 0.6740 0.6679 0.6641 (4H chart)
GOLD
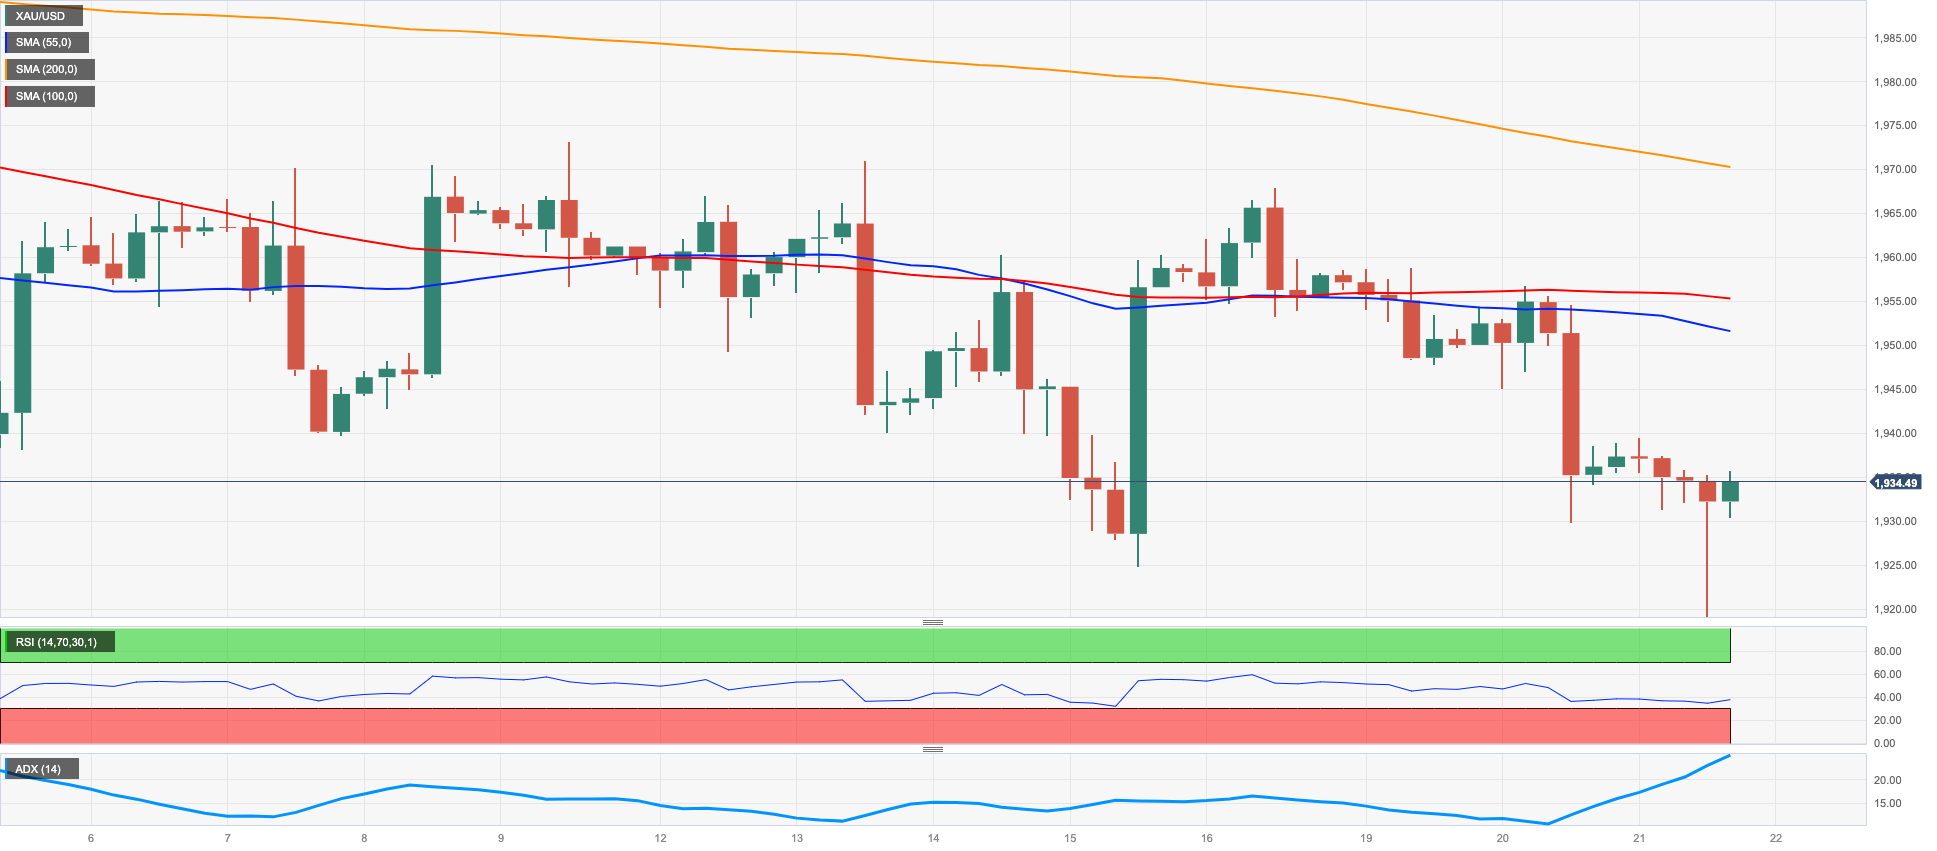
The price of gold, measured in troy ounces, initially declined to reach new three-month lows around $1920. However, it later regained upward momentum and surpassed the $1930 mark. This recovery coincided with a notable loss of momentum in the US dollar during the closing of the Wall Street session on Wednesday.
The rise in US yields across the yield curve also exerted downward pressure on the precious metal. Nonetheless, the lack of fresh news from Powell's testimony seemed to provide some support to gold.
If gold manages to break out of its current consolidation range, it has the potential to target the June high of $1983 (June 2) and even surpass the significant milestone of $2000. It is important to note that there are no major resistance levels until reaching the 2023 peak of $2067 (May 4) ahead of the 2022 high of $2070 (March 8) and the all-time record of $2075 (August 7, 2020). On the flip side, immediate support levels for gold can be identified at the June low of $1919 (June 21), followed by the 200-day SMA at $1850. The 2023 low of $1804 (February 28) comes next, with the critical level of $1800 per troy ounce following thereafter.
Resistance levels: $1972 $1983 $2022 (4H chart)
Support levels: $1919 $1885 $1809 (4H chart)
CRUDE WTI
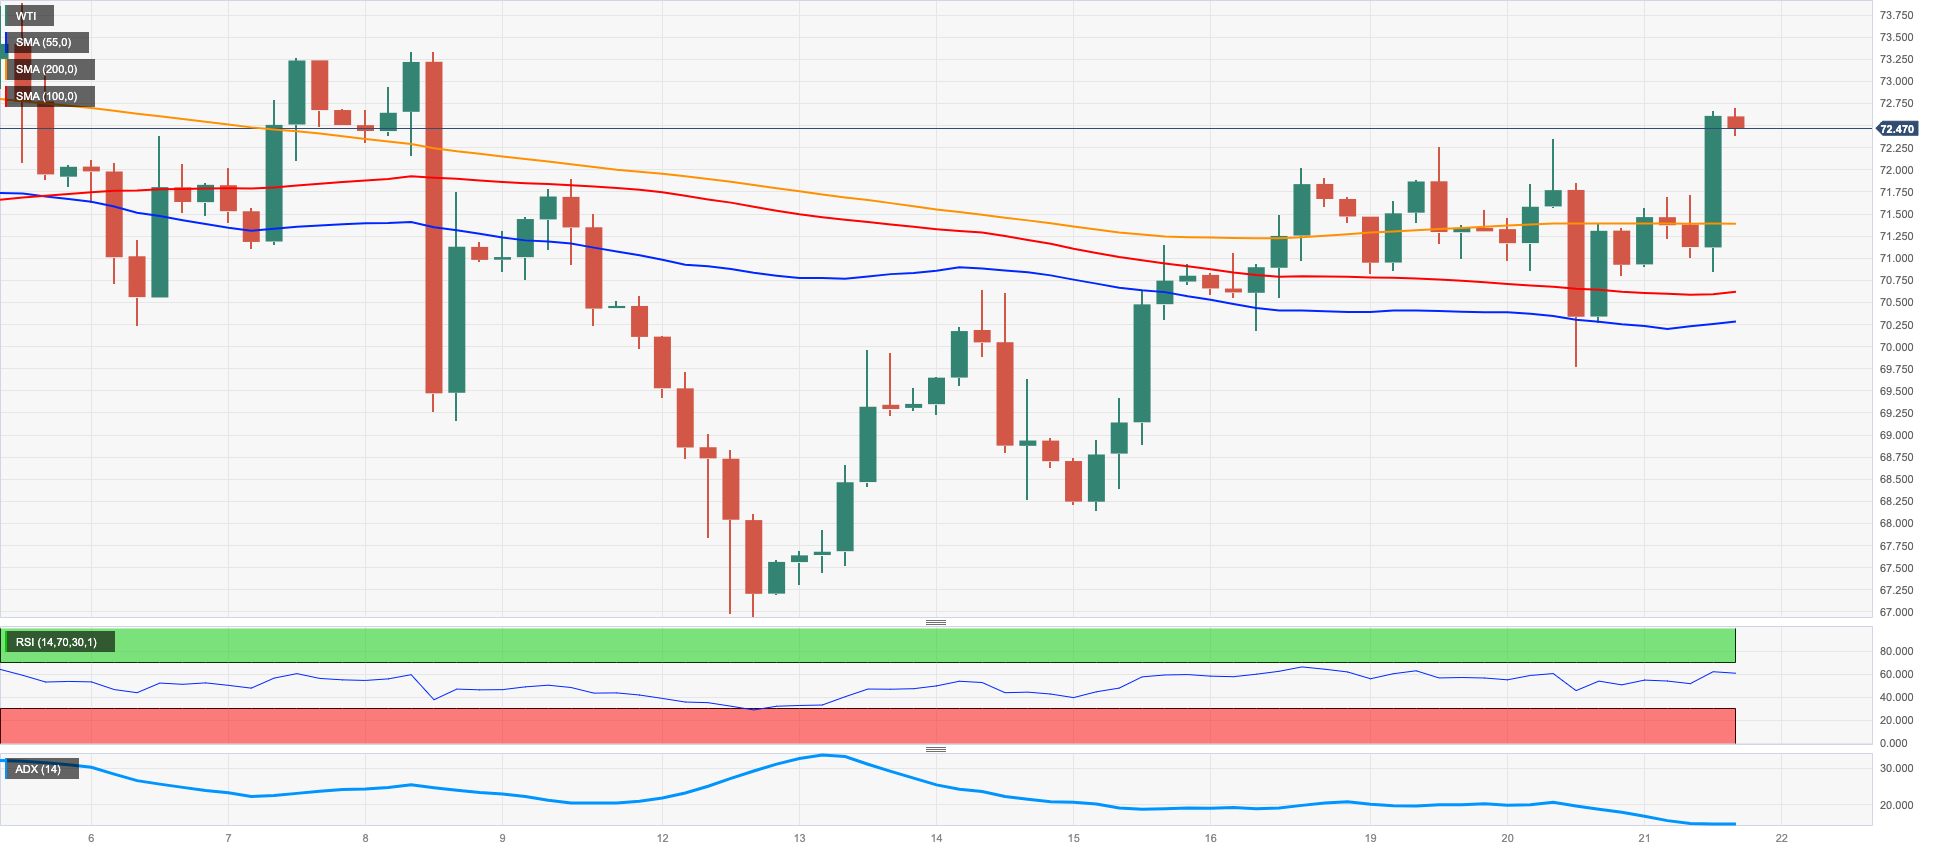
After experiencing two consecutive daily declines, WTI prices bounced back and surpassed the $72.00 mark per barrel on Wednesday.
The recovery in commodity prices was driven by a weaker dollar and the absence of surprises in Chair Powell's testimony before Congress, where he reiterated the commitment to combat inflation until it reaches the Fed’s 2% target.
However, persistent inflation in the UK could lead the BoE to extend its tightening cycle, aligning with speculation surrounding the ECB. Meanwhile, the Fed is already expected to raise rates by 50 basis points in the coming months, which could potentially raise concerns about a recession and dampen the demand for crude oil.
Later in the session, the American Petroleum Institute (API) will release its weekly report on US crude oil inventories for the week ending June 16.
If bullish sentiment prevails, WTI could potentially challenge the June high of $74.92 (June 5). This level finds support from the interim 100-day SMA at $74.46 and is situated just before the critical 200-day SMA at $78.16. Noteworthy resistance levels beyond that include the weekly peak of $79.14 (April 24), followed by the significant barrier of $80.00 per barrel, the 2023 peak of $83.49 (April 12), and the November 2022 high of $93.73 (November 7). On the contrary, the nearest support level is located at the June low of $66.86 (June 13) ahead of the 2023 low at $63.61 (May 4), followed by the December 2021 low at $62.46 (December 2), and the critical level of $60.00 per barrel.
Resistance levels: $72.68 $73.24 $74.92 (4H chart)
Support levels: $69.74 $68.03 $66.77 (4H chart)
GER40
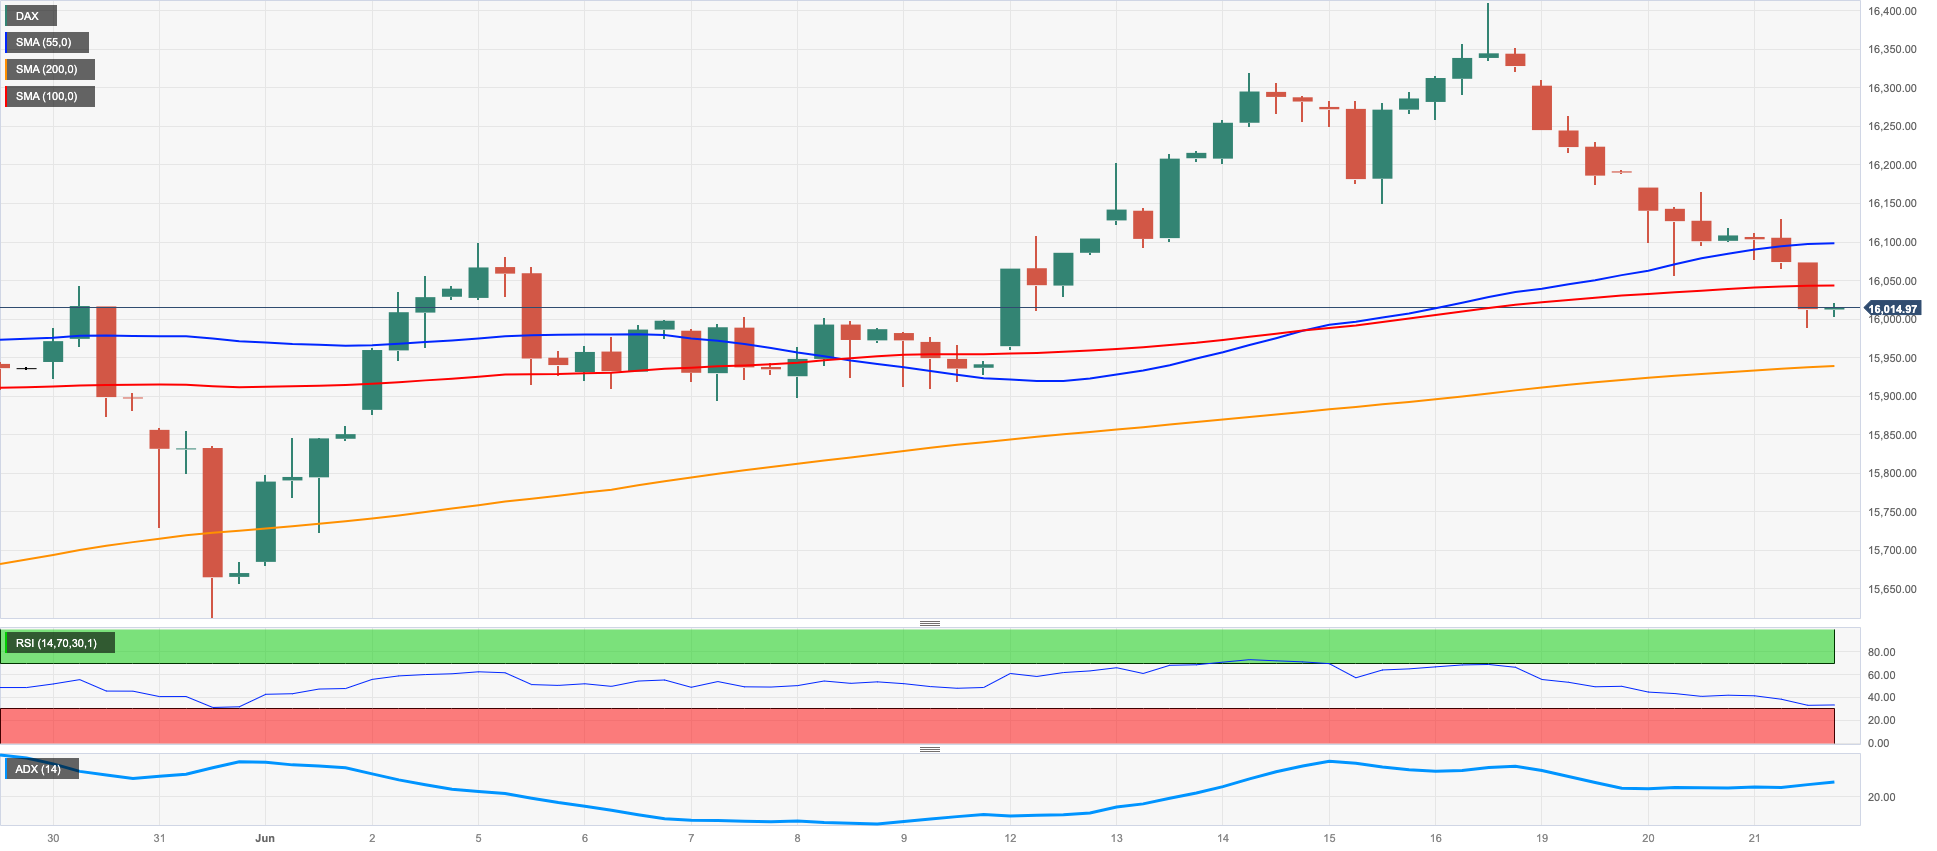
European markets continued their weekly losses, with Germany's DAX40 slipping back to the multi-session lows around the 16000 region midweek.
Investors were concerned about the slow recovery in China, coupled with the prospects of additional tightening by major central banks, which reinforced the idea of a global economic slowdown, leading to a sour mood among market participants.
Meanwhile, officials from Germany's IFO institute stated that the country's economy is expected to shrink by 0.4% this year and expand by 1.5% in 2024, down from previous forecasts of expansions of 0.1% and 1.7%, respectively.
In the German money market, the 10-year bund yields ended with marginal gains just past the 2.40% level.
If the current bearish trend gathers impulse, the first objective would be the transitory 55-day SMA at 15920, seconded by the May low of 15629 (May 31), which would be supported by the temporary 100-day SMA at 15649. Further losses could revisit the April low of 15482 (April 5), followed by a minor support level at 14809 (March 24) and the significant 200-day SMA at 14688. The March low of 14458 (March 20) would come next. On the upside, the immediate target emerges at the all-time high of 16427 (June 16). The everyday RSI deflated to the vicinity of 49.
Best Performers: Adidas, Covestro, Commerzbank
Worst Performers: Merck, Deutsche Post, Vonovia
Resistance levels: 16427 17000? (4H chart)
Support levels: 16002 15788 15629 (4H chart)
NASDAQ
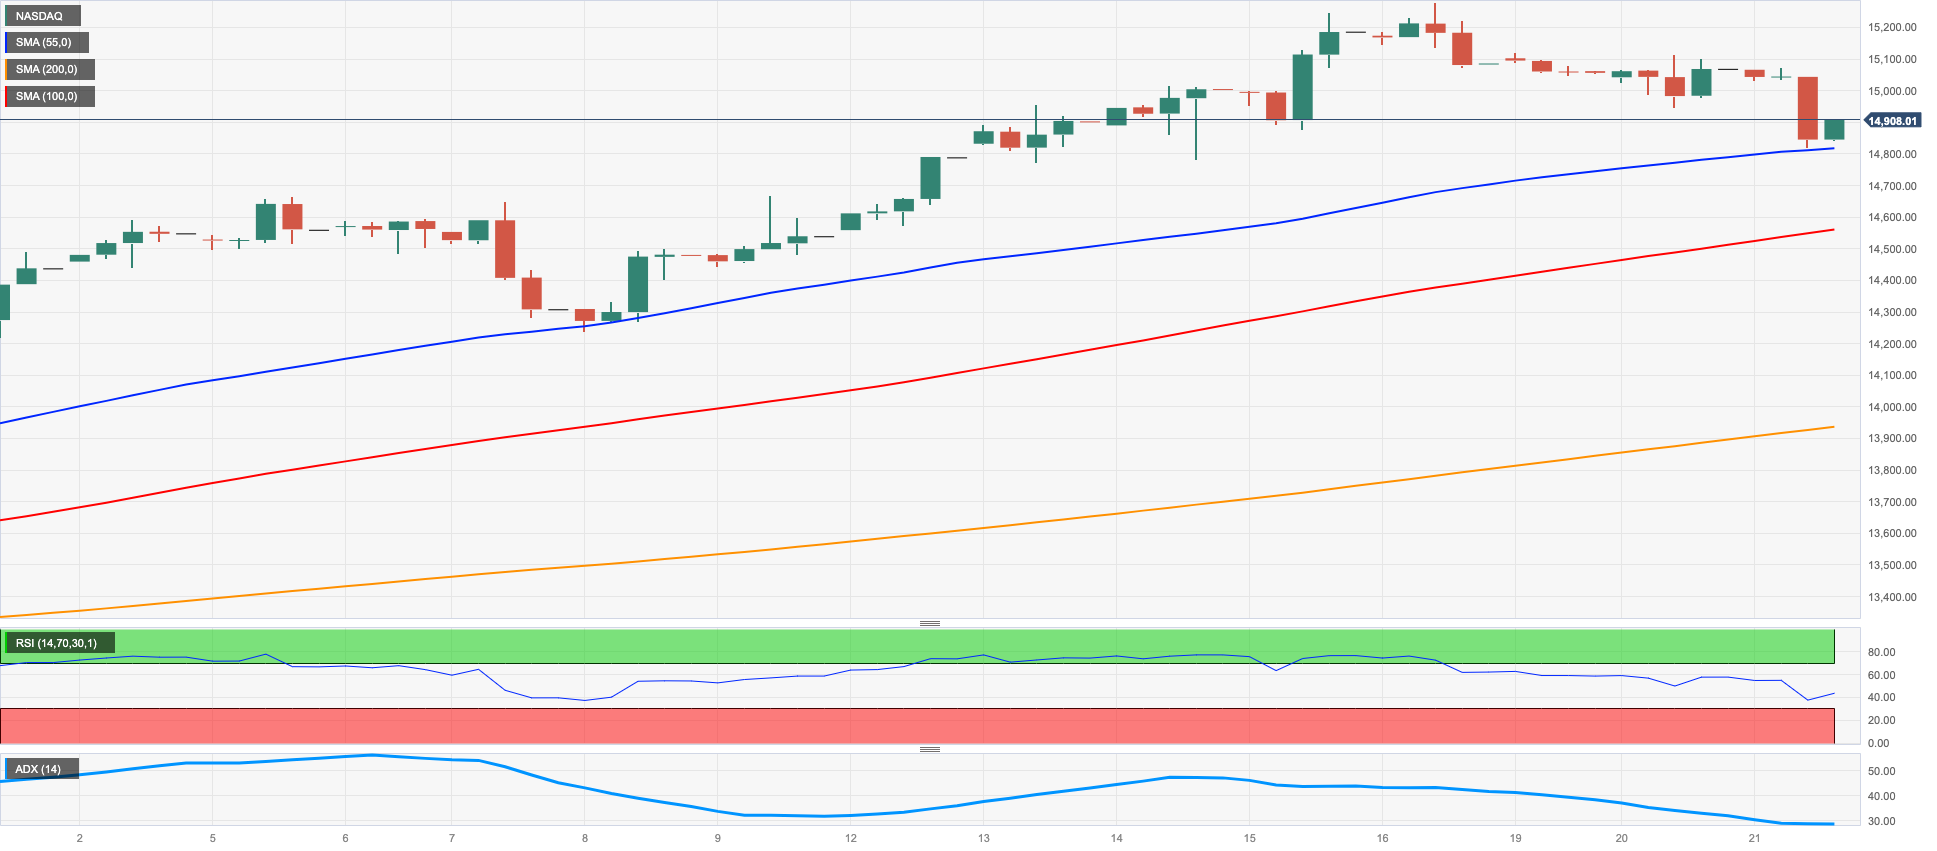
Tech stocks, as represented by the Nasdaq 100 index in the US, extended their bearish performance for the week and fell to multi-day lows around the 14800 level.
The marked decline in the shares of electric-vehicle manufacturer Tesla, coupled with a moderated rebound in US yields, particularly in the short end and the belly of the yield curve, exerted pressure on the technology sector. This occurred after Chair Powell reiterated that the Federal Reserve's task of achieving its inflation target is not yet complete.
The resumption of the upside momentum in the Nasdaq 100 is expected to refocus on the 2023 high of 15284 (June 16) prior to the round level of 16000. Having said that, there are immediate support levels to monitor. These include the interim 55-day SMA at 13673, closely followed by the weekly low of 13520 (May 24) and the May low of 12938 (May 4). A breach below the latter level could expose the index to a potential decline towards the April low of 12724 (April 25) before the 200-day SMA at 12270 and the March low of 11695 (March 13). The daily RSI deflated to the sub-66 area.
Top Gainers: Dollar Tree, Baker Hughes, CoStar
Top Losers: AMD, Intel, Crowdstrike Holdings
Resistance levels: 15284 16017 16607 (4H chart)
Support levels: 14283 13520 13074 (4H chart)
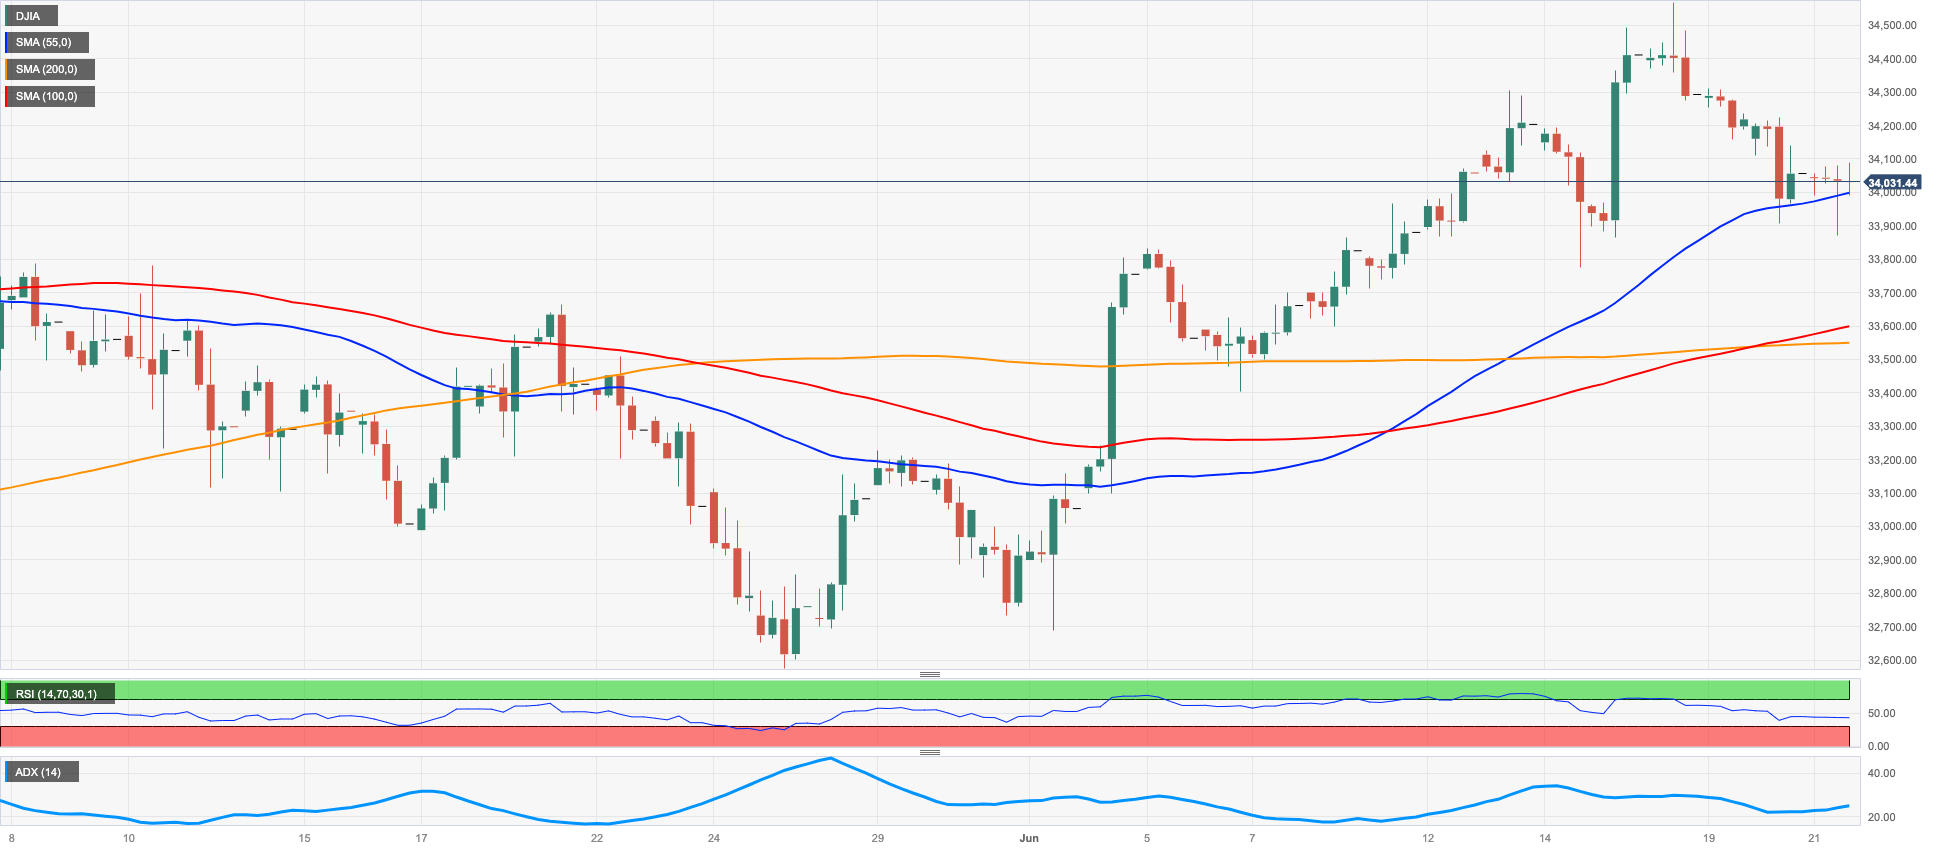
DOW JONES
On Wednesday, the Dow Jones index declined for the third consecutive session, with the hawkish tone of Fed Chairman Powell's testimony in line with market expectations but still spooking buyers due to his pledge to do more to tackle inflation.
Investor sentiment was also weighed down by concerns about a potential US recession and the slow recovery in post-pandemic China.
Overall, the Dow Jones lost 0.05% to 34037, the S&P500 retreated 0.31% to 4374, and the tech-heavy Nasdaq Composite dropped 0.92% to 13542.
Despite the ongoing knee-jerk, the Dow Jones is expected to resume its upward trend. Against that, the next significant resistance level is at the 2023 peak of 34588 (June 16), followed by the December 2022 high of 34712 (December 13) and the April 2022 top of 35492 (April 21). In terms of support, the interim levels are the 55-day and 100-day SMAs at 33604 and 33364, respectively, before reaching the critical 200-day SMA at 32833. Further down comes the May low of 32586 (May 25) and the March 2023 low of 31429 (March 15). If the index continues to drop, the crucial support level to watch is the 2022 low of 28660 (October 13). The RSI for the day dropped to the boundaries of the 56 region.
Top Performers: UnitedHealth, Chevron, Merck&Co
Worst Performers: Intel, Salesforce Inc, Walt Disney
Resistance levels: 34588 34712 35492 (4H chart)
Support levels: 33783 33399 32586 (4H chart)
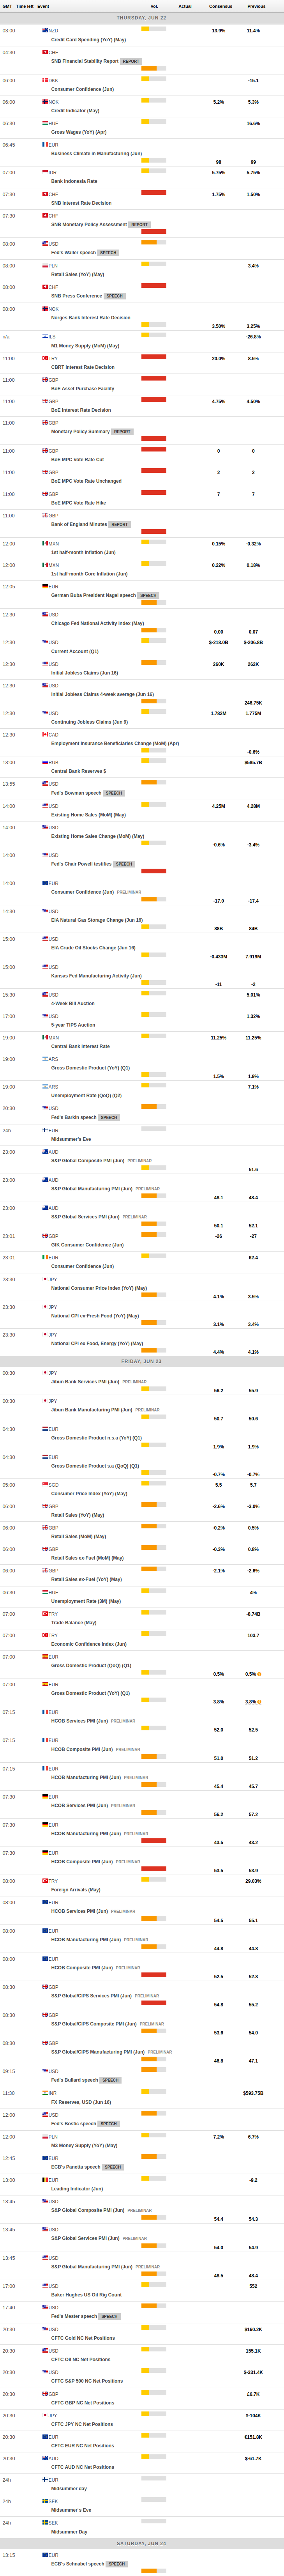
MACROECONOMIC EVENTS
All Information & Updates provided by:

All information relating to the financial markets available on this page has been prepared and issued by FXStreet (Forexstreet SL, Spain, Reg: B62498233) on the basis of publicly available information and all information believed to be reliable and does not conflict with Kuwaiti local laws, and all necessary care has been taken to before the company to ensure that the facts mentioned are correct from the source.
NCM Investment nor any of its directors or employees shall in any way be held responsible for the contents of this news, and the information contained on this page is intended only to provide clients with publicly available information and should not be construed as investment advice, report or analysis and/or constitute an offer or invitation to buy or sell financial instruments of any kind.
RISK WARNING: Forex and CFDs are highly risky leveraged products, as losses can exceed deposits. Please ensure you understand all the risks and take independent advice if necessary. NCM will segregate the clients based on the criteria of the regulator and its bylaws. NCM does not provide any advisory service; the material published does not constitute advice or a recommendation for a transaction in any financial instrument. NCM accepts no responsibility for any use of the content presented and any consequences of that use. Anyone acting on the information provided does so at their own risk.