
- Contact Us:
-

-

-

-


Daily Market Updates
23 Jun 2023
USDJPY
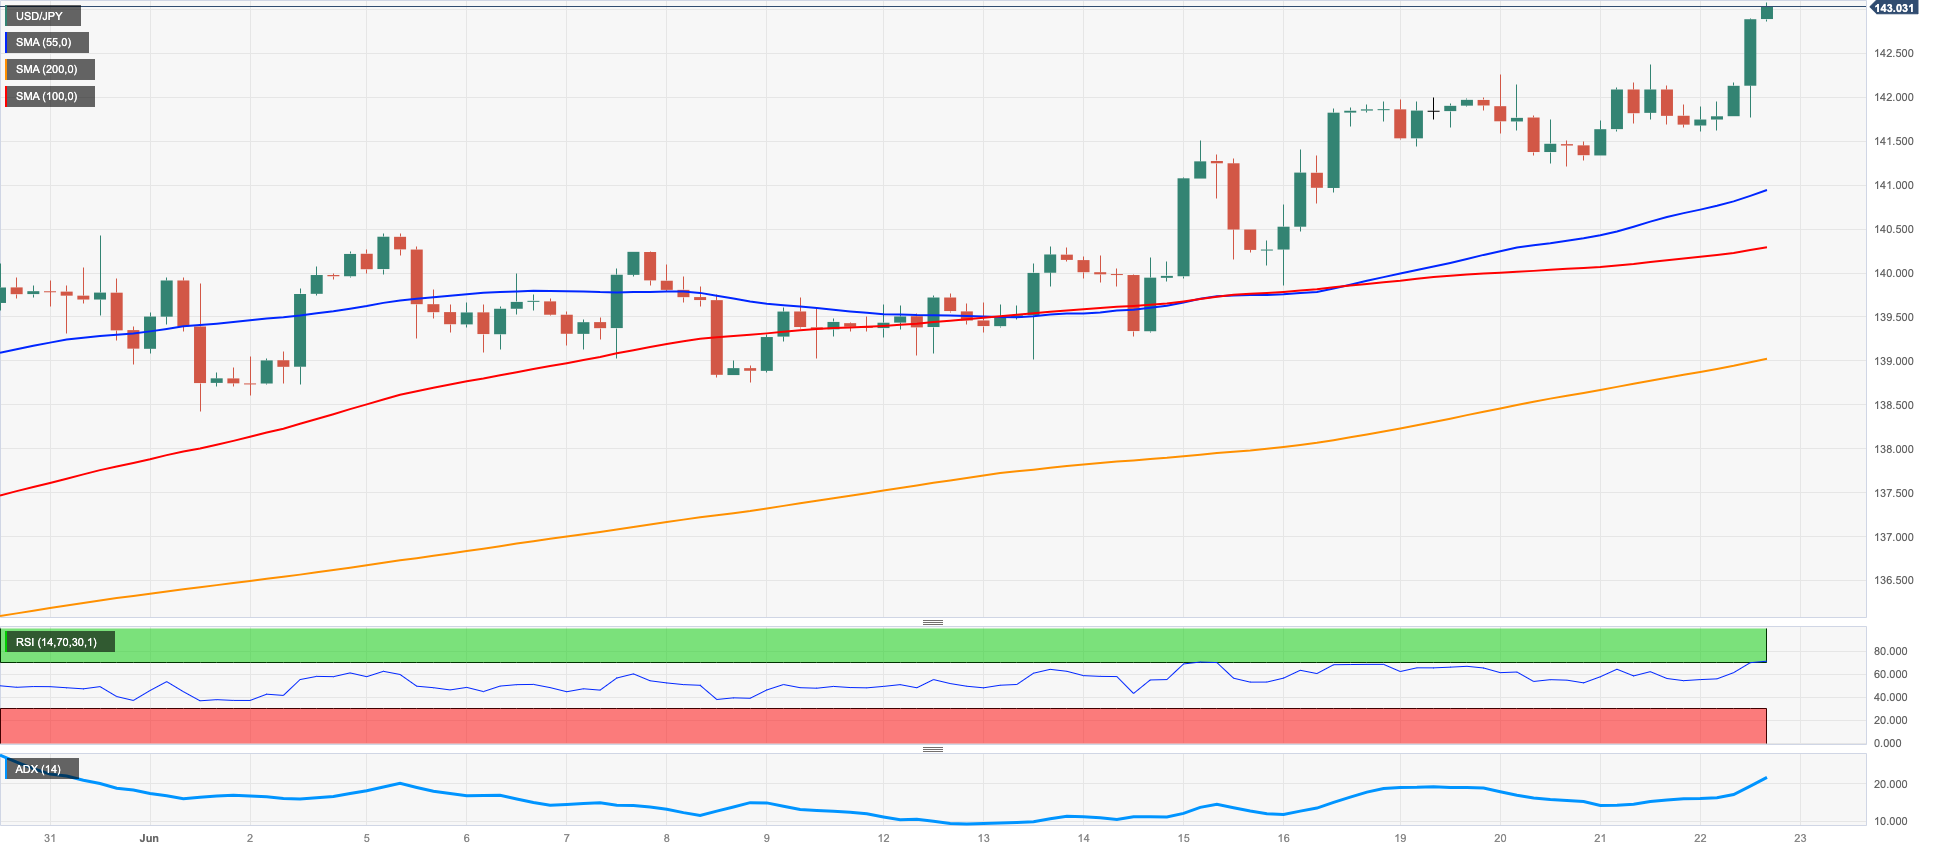
The upward momentum in USD/JPY shows no signs of weakening.
In fact, on Thursday, the pair continued to climb and tested the area beyond the significant barrier at 143.00. This was driven by a late rebound in the US dollar and the recovery of US yields across the yield curve.
Furthermore, the exchange rate reached levels not seen since November 2022 as market participants assessed the BoJ’s ongoing ultra-accommodative stance, which was reaffirmed at the recent monetary policy meeting.
This perspective was reinforced by BoJ member A. Noguchi, who commented during Asian trading hours that the yen's depreciation last year had been too rapid. Noguchi pointed out that a weak yen adversely affects households through rising prices but benefits companies through increased overseas profits and tourism. He also emphasized that the central bank's monetary policy does not directly target the exchange rate and that there is currently no need to make operational adjustments to yield curve control (YCC).
Regarding economic data from Japan, the only release on Thursday was an increase in Foreign Bond Investment to ¥1056.2 billion for the week ending June 17.
The current outlook for USD/JPY remains optimistic. Resistance levels to watch include the 2023 peak at 142.95 (June 22), followed by the 2022 high at 151.94 (October 22) and the round level of 152.00. Conversely, if bearish movements occur, initial obstacles can be found at the June low of 138.42 (June 1), followed by the significant 200-day SMA at 137.19. Additional support levels include the interim 55-day and 100-day SMAs at 137.17 and 135.49, respectively. Below these levels, there is the weekly low of 133.01 (April 26), minor support at 132.01 (April 13), and the April low at 130.62 (April 5), prior to the key level of 130.00. Further down, we have the March low of 129.63 (March 24) and the February low of 128.08 (February 8). The daily RSI entered the overbought territory past 71.
Resistance levels: 142.95 146.79 148.45 (4H chart)
Support levels: 141.24 139.85 139.01 (4H chart)
GBPUSD
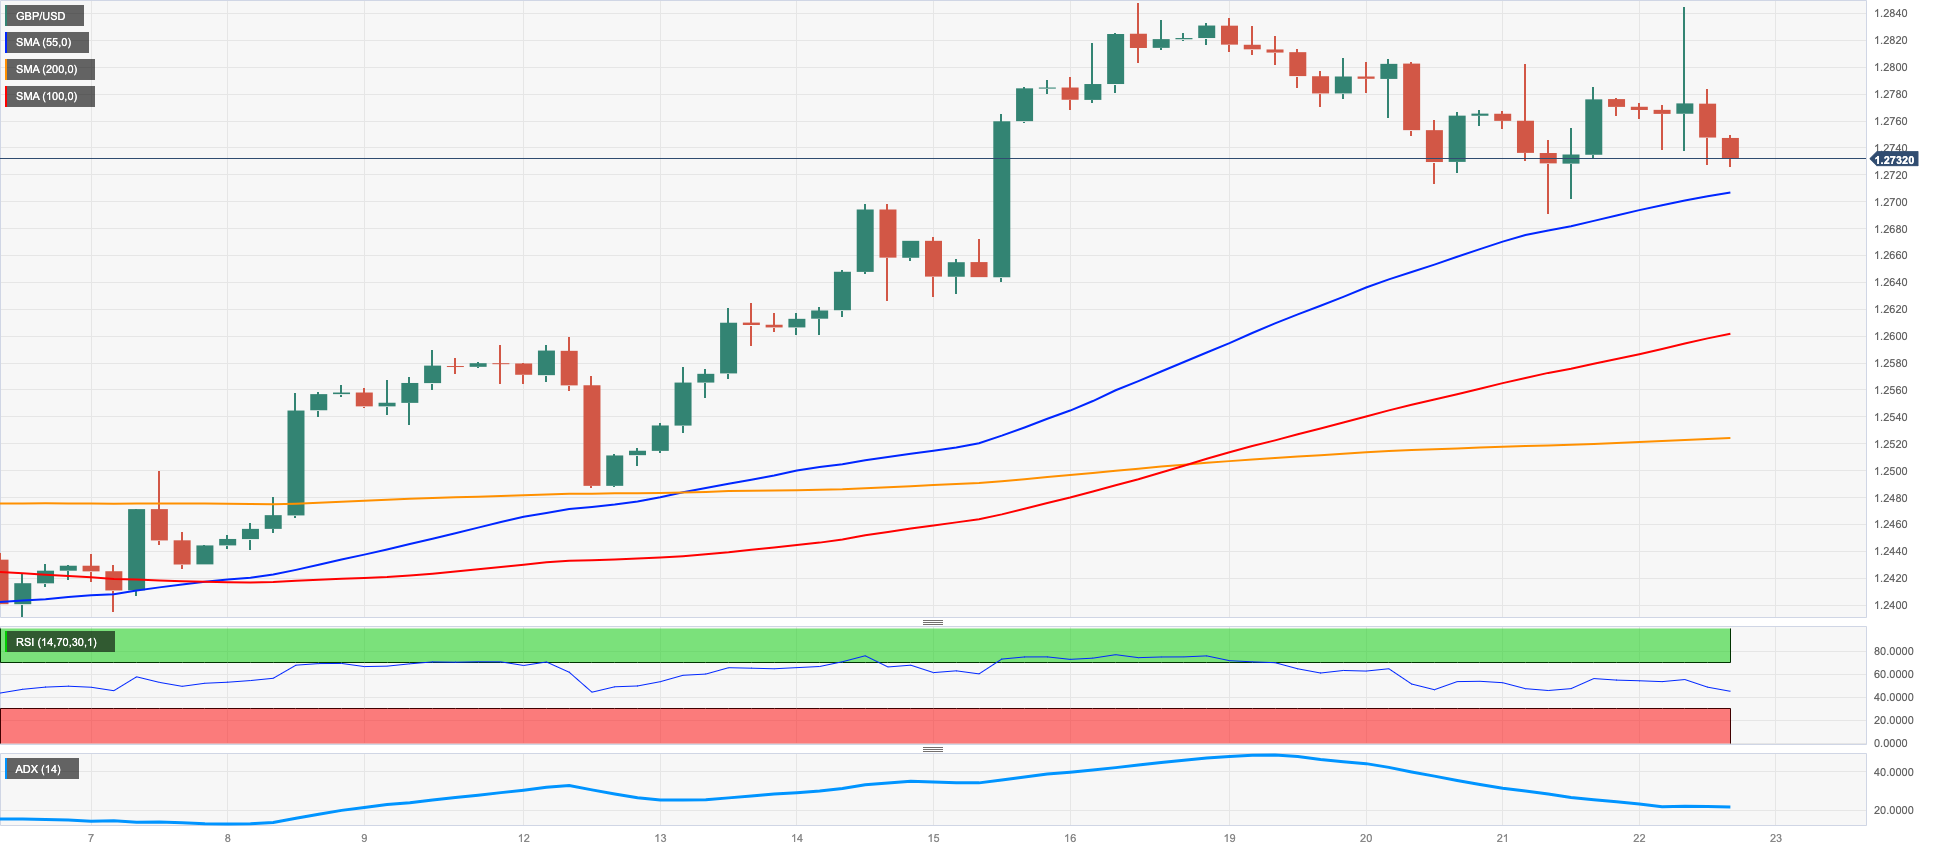
The GBP/USD has continued its downward trend for the week and has quickly moved away from Wednesday's uncertain price movement to drop to the 1.2730 region, which is over a cent lower than its post-BoE high of 1.2840 on Thursday.
Initially, the British pound had increased to the mid-1.2800s against the dollar following the BoE's unexpected decision to raise rates by 50 bps during its meeting on Thursday, as the market had only expected a 25 bps increase.
This was the first time in the current hiking cycle that the BoE had exceeded market expectations, with a 7-2 majority vote to raise the policy rate to 5.00%, likely due to the shock inflation figure released the day before.
The GBP/USD is at risk of further short-term decline, with immediate support at the 2021-2023 support line at around 1.2585, followed by the transitory 55-day SMA at 1.2509 and the June low of 1.2368. Additional pullbacks could lead to the May low of 1.2308, ahead of the April low of 1.2274, and the key 200-day SMA at 1.2067 before reaching the 2023 low of 1.1802. On the flip side, if Cable breaks out of the 2023 top of 1.2848, it could potentially test the 200-week SMA at 1.2872 before reaching the psychological barrier of 1.3000. The everyday RSI grinded lower to the sub-64 region.
Resistance levels: 1.2848 1.3089 1.3146 (4H chart)
Support levels: 1.2691 1.2528 1.2486 (4H chart)
AUDUSD
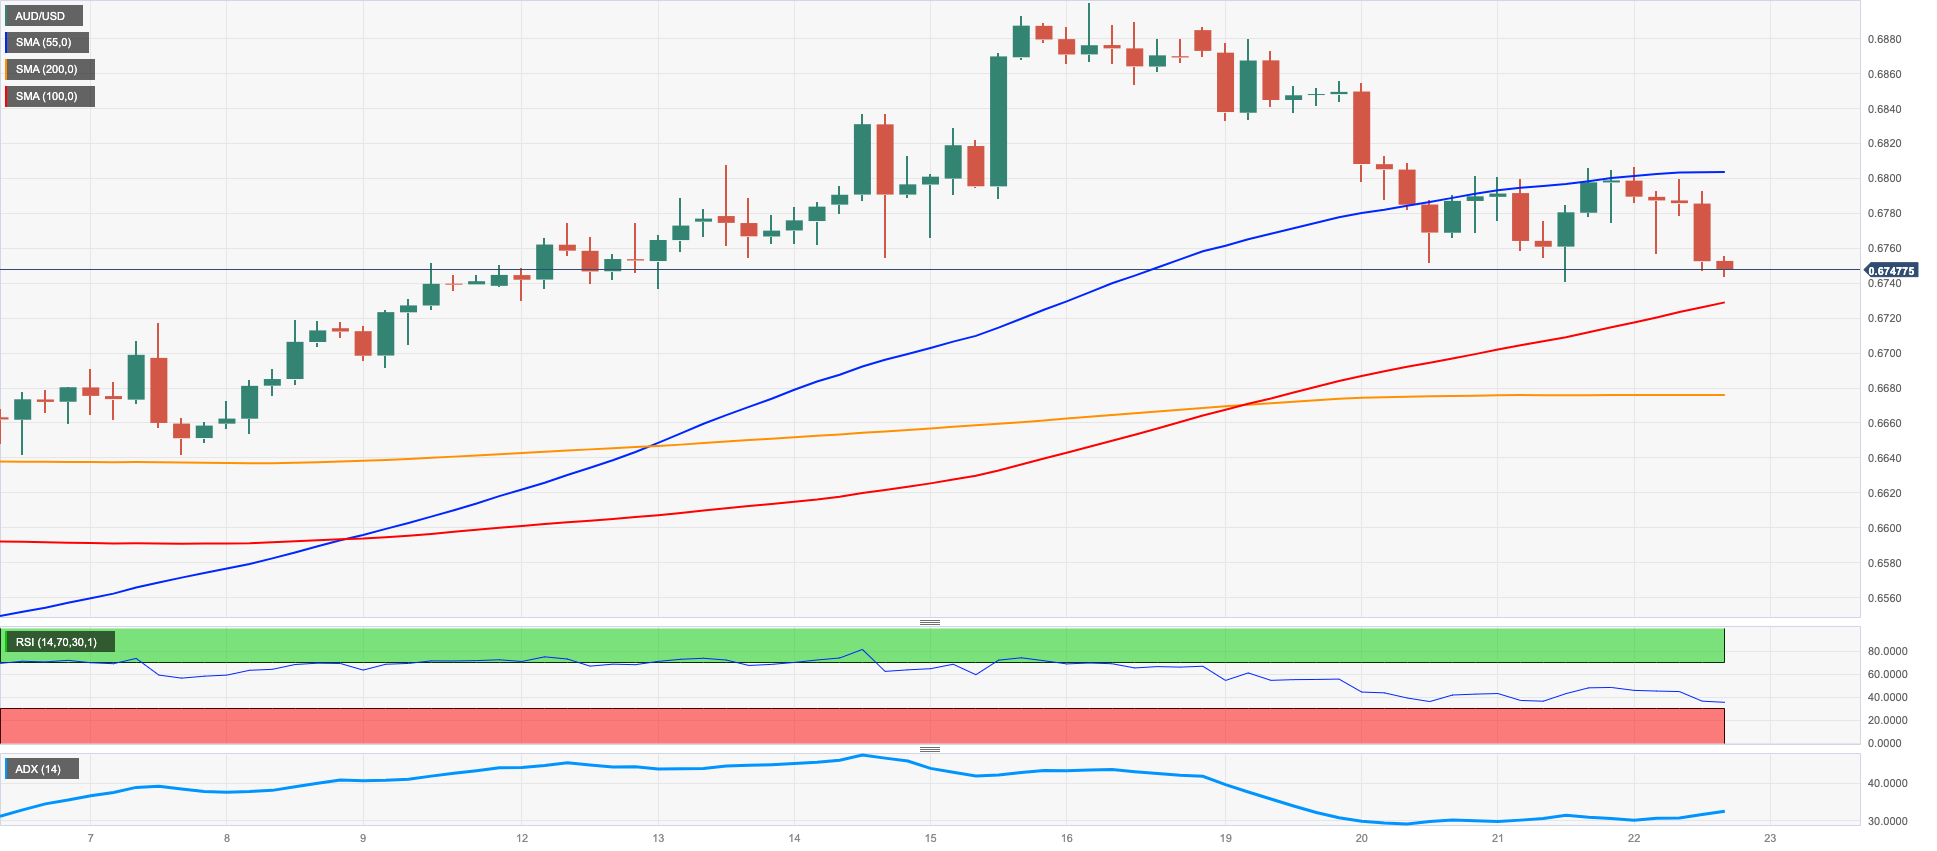
AUD/USD resumed its downward trend and approached weekly lows within the 0.6750/40 range on Thursday.
Extra weakness around the Aussie dollar were prompted by a late bounce in the US dollar, which caused the risk complex to diminish daily gains and led to negative performance in the commodity market.
The economic calendar in Australia was empty on Thursday, with the release of preliminary Manufacturing and Services PMIs scheduled for Friday.
There remains a possibility of further correction for the AUD/USD, with the provisional 100-day SMA at 0.6715 providing the first level of support, followed by the more relevant 200-day SMA at 0.6691. If the pair continues to drop, it may retest the 2023 low of 0.6458 (May 31), followed by the weekly lows of 0.6386 (November 10, 2022) and the November 2022 low of 0.6272 (November 3). Having said that, the resumption of the bullish bias could see spot will face the next hurdle at the June peak of 0.6899 (June 16), followed by the critical level of 0.7000, the weekly high of 0.7029 (February 14), and the 2023 top of 0.7157 (February 2). The daily RSI deflated below the 54 yardstick.
Resistance levels: 0.6899 0.6920 0.7029 (4H chart)
Support levels: 0.6740 0.6680 0.6641 (4H chart)
GOLD
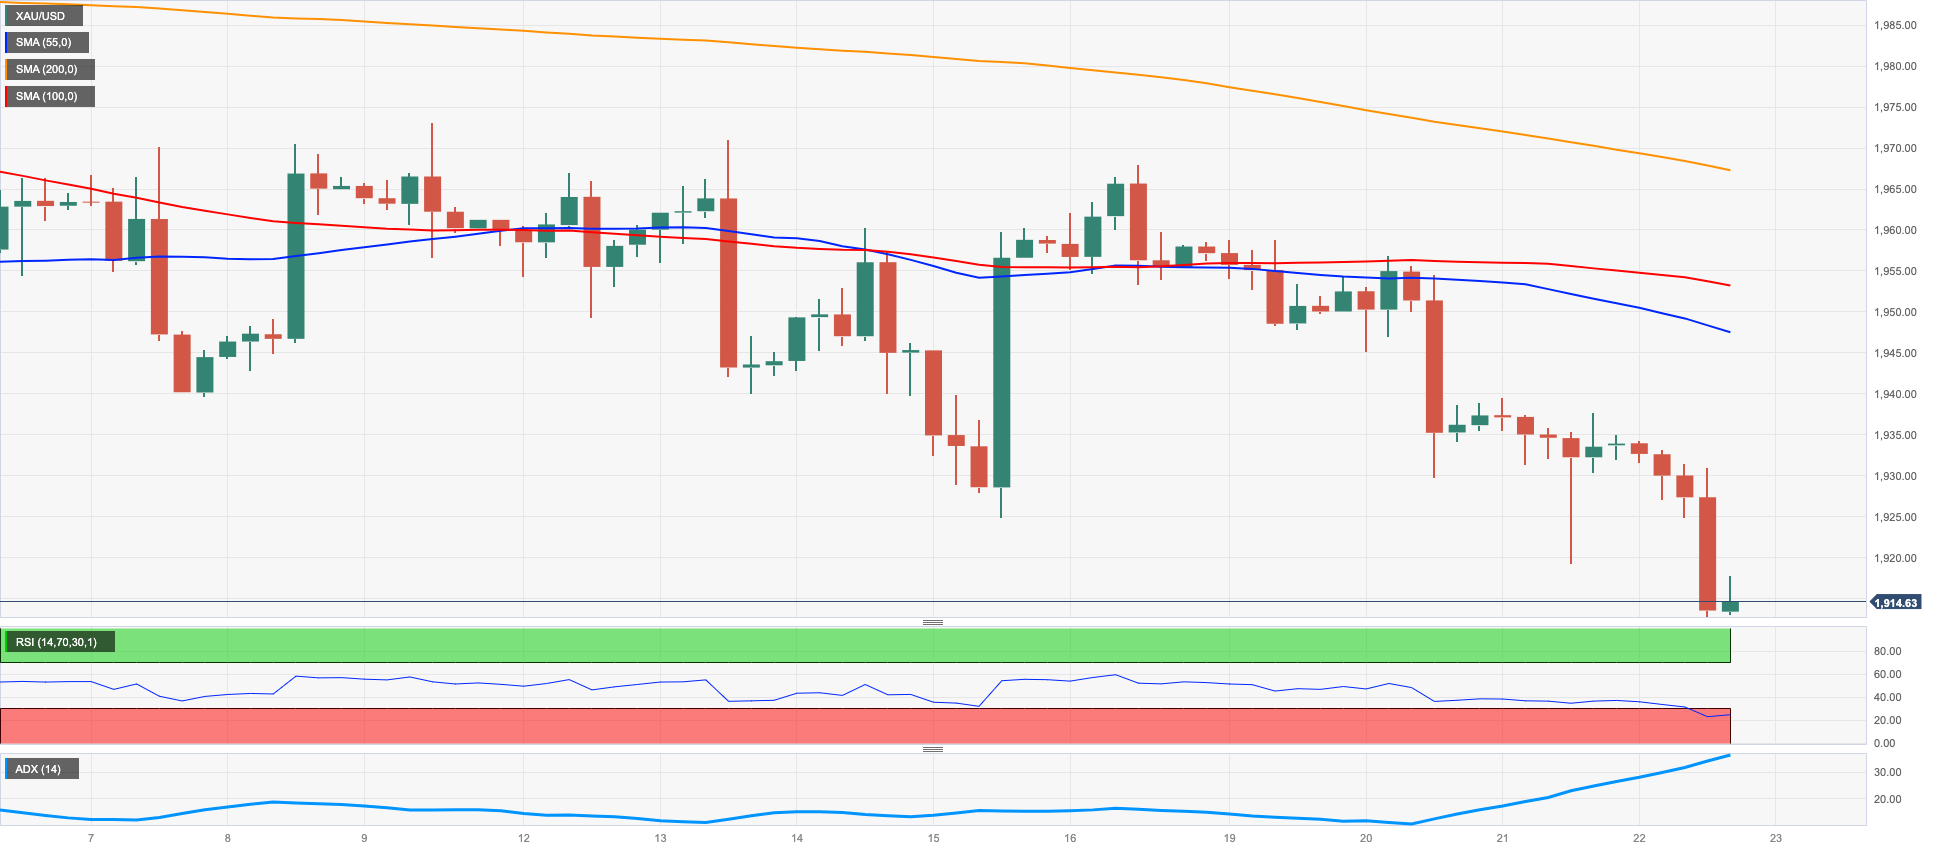
On Thursday, the decline in gold prices intensified, reaching levels not seen since early March, hovering around $1910 per troy ounce.
The notable resurgence of the US dollar and the rise in US yields across the yield curve deterred buyers from entering the market for the yellow metal.
Additionally, the anticipation of further tightening by major central banks (as per latest meetings of the Fed, ECB, SNB and BoE) contributed to the prevailing selling sentiment surrounding precious metals.
It appears that gold has broken below its recent consolidation range. Consequently, immediate support levels for gold can be identified at the June low of $1912 (June 22), followed by the 200-day SMA at $1851. The next support level is the 2023 low of $1804 (February 28), followed by the critical threshold of $1800 per troy ounce. On the other hand, there is an initial obstacle at the June high of $1983 (June 2) before reaching the significant milestone of $2000. It is worth noting that there are no major resistance levels until the 2023 peak of $2067 (May 4), followed by the 2022 high of $2070 (March 8), and ultimately the all-time record of $2075 (August 7, 2020).
Resistance levels: $1967 $1983 $2022 (4H chart)
Support levels: $1912 $1885 $1809 (4H chart)
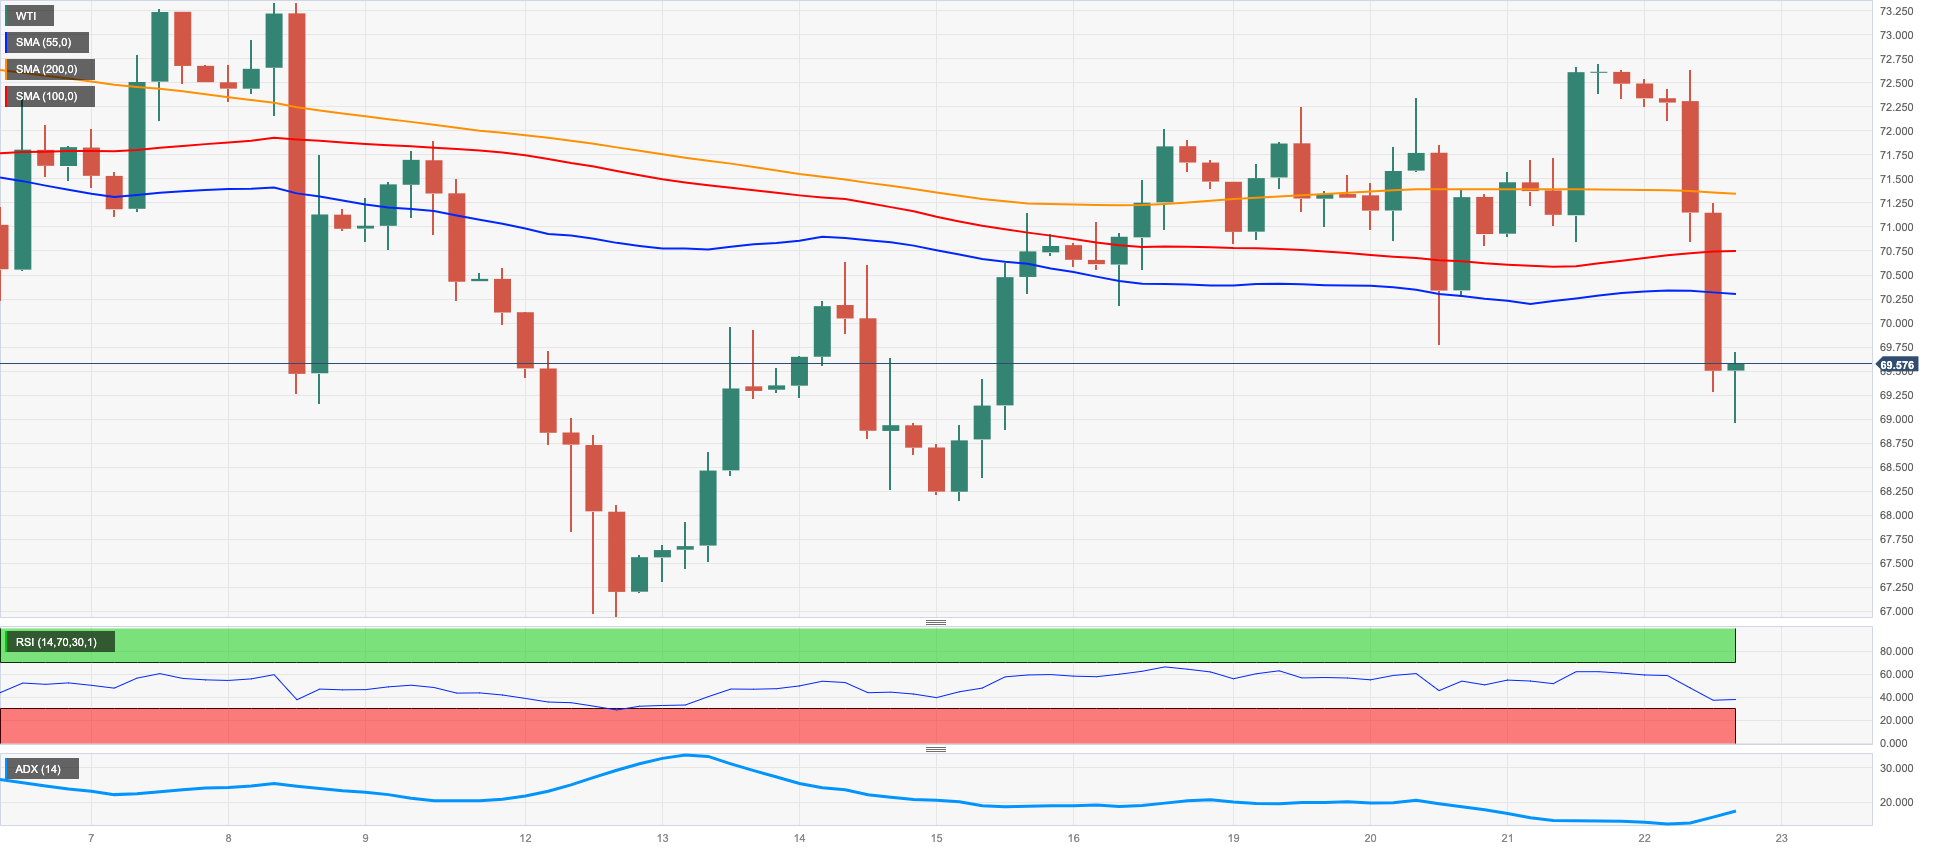
CRUDE WTI
On Thursday, WTI prices experienced a decline, reaching weekly lows below the $70.00 per barrel mark.
The significant drop in commodity prices was driven by persistent concerns about a potential economic downturn. These concerns were further reinforced by the unexpected 50 basis points rate hike by the Bank of England (BoE), adding to the hawkish stance of the Fed and the ECB.
Demand concerns seem to have been enough to offset the positive weekly report from the EIA, after the agency reported that US crude oil inventories unexpectedly shrank by 3.831M barrels in the week to June 16, while supplies at Cushing dropped by 0.098M barrels, Weekly Distillate Stocks increased by 0.433M barrels and gasoline stockpiles went up by less than expected by 0.479M barrels.
Immediately to the downside in WTI comes the June low of $66.86 (June 13), followed by the 2023 low at $63.61 (May 4), the December 2021 low at $62.46 (December 2), and the critical level of $60.00 per barrel. On the contrary, prices could potentially challenge the June high of $74.92 (June 5). This level finds support from the transitory 100-day SMA at $74.35 and is positioned just before the critical 200-day SMA at $78.07. Notable resistance levels beyond that include the weekly peak of $79.14 (April 24), followed by the significant barrier of $80.00 per barrel, the 2023 peak of $83.49 (April 12), and the November 2022 high of $93.73 (November 7).
Resistance levels: $72.68 $73.24 $74.92 (4H chart)
Support levels: $68.99 $68.03 $66.77 (4H chart)
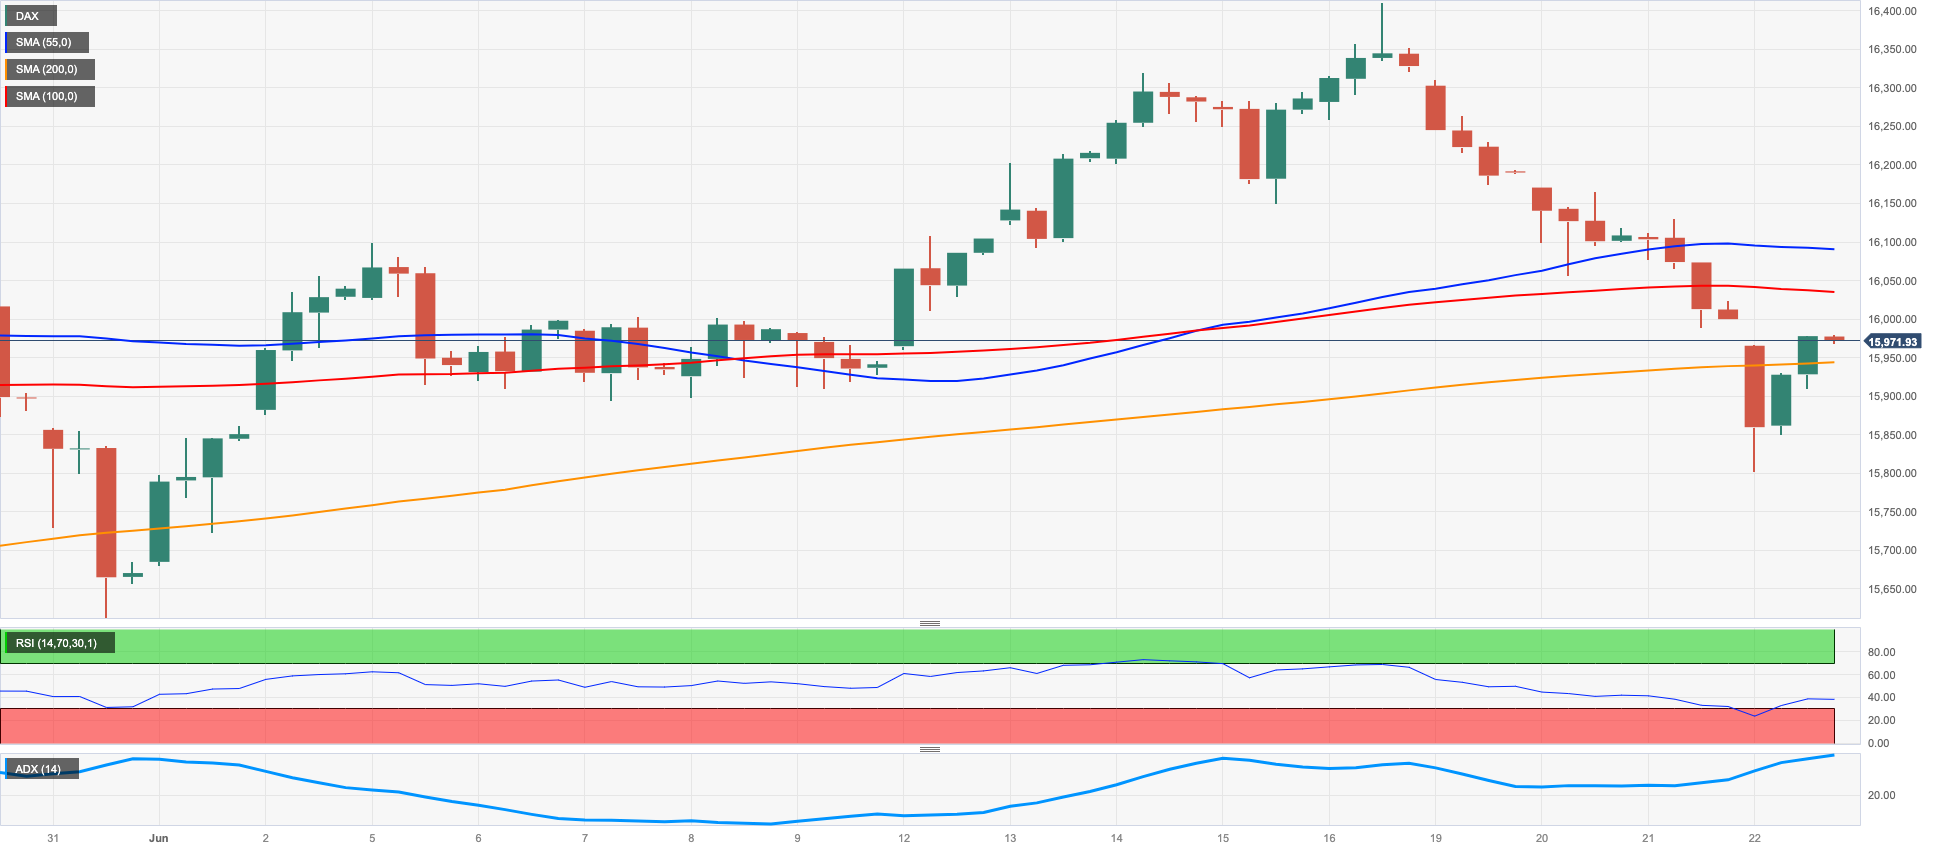
GER40
On Thursday, European markets closed in the red for the fourth consecutive session, and the German DAX40 was no exception as it dropped to 3-week lows in the 15800 region.
While concerns regarding the Chinese economic recovery continued to undermine sentiment, the larger-than-expected rate hike by the BoE reminded markets that major economies still have further legs to go in their hiking cycle, which also reignited fears of an economic slowdown.
The daily decline in the reference index was accompanied by a rebound in 10-year bund yields to the 2.50% zone after two consecutive sessions with losses.
If the current bearish trend continues, the first objective would be the interim 100-day SMA at 15658, which somewhat underpins the May low of 15629 (May 31). Further losses could result in revisiting the April low of 15482 (April 5), followed by minor support at 14809 (March 24), and the significant 200-day SMA at 14703. The March low of 14458 (March 20) would be the next level. On the upside, the immediate target is the all-time high of 16427 (June 16). The daily RSI broke below the 48 level.
Best Performers: Sartorius AG VZO, Zalando SE, Adidas
Worst Performers: Daimler Truck Holding, Mercedes Benz Group, Henkel VZO
Resistance levels: 16053 16427 17000? (4H chart)
Support levels: 15810 15629 15482 (4H chart)
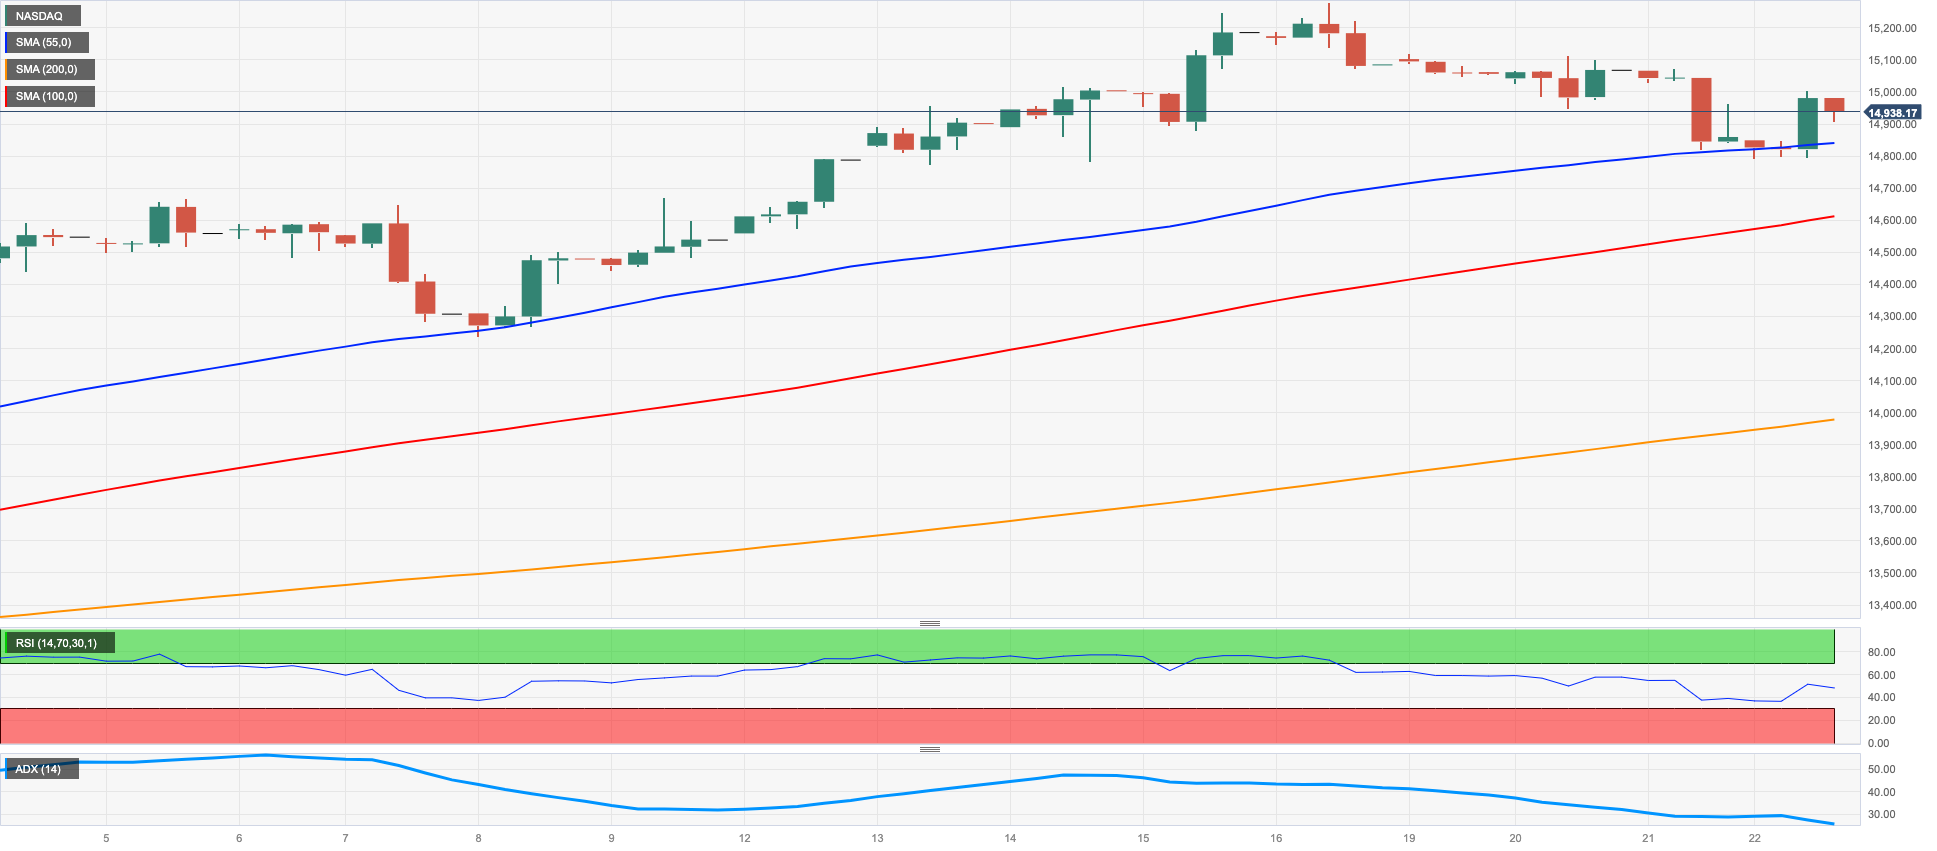
NASDAQ
On Thursday, the Nasdaq 100, the leading US tech benchmark, rebounded strongly and approached the 15,000 level. This marked a departure from three consecutive daily sessions of losses.
Despite the recovery of the US dollar and an increase in US yields across the yield curve, the tech sector exhibited a positive sentiment amidst the broad-based perception that the Federal Reserve, along with other major central banks, still has work to do in addressing inflation concerns.
The continuation of the uptrend in the Nasdaq 100 is expected to target the 2023 high of 15284 (June 16), followed by the round level of 16000. On the flip side, it is important to monitor immediate support levels. These include the interim 55-day SMA at 13,13706, closely trailed by the weekly low of 13520 (May 24) and the May low of 12938 (May 4). If the index falls below the latter level, it may face a potential decline towards the April low of 12724 (April 25), followed by the 200-day SMA at 12284 and the March low of 11695 (March 13). The daily RSI rebounded to the boundaries of 67.
Top Gainers: Datadog, Amazon.com, Palo Alto Networks
Top Losers: Lucid Group, Enphase, Warner Bros Discovery
Resistance levels: 15284 16017 16607 (4H chart)
Support levels: 14794 14283 13520 (4H chart)
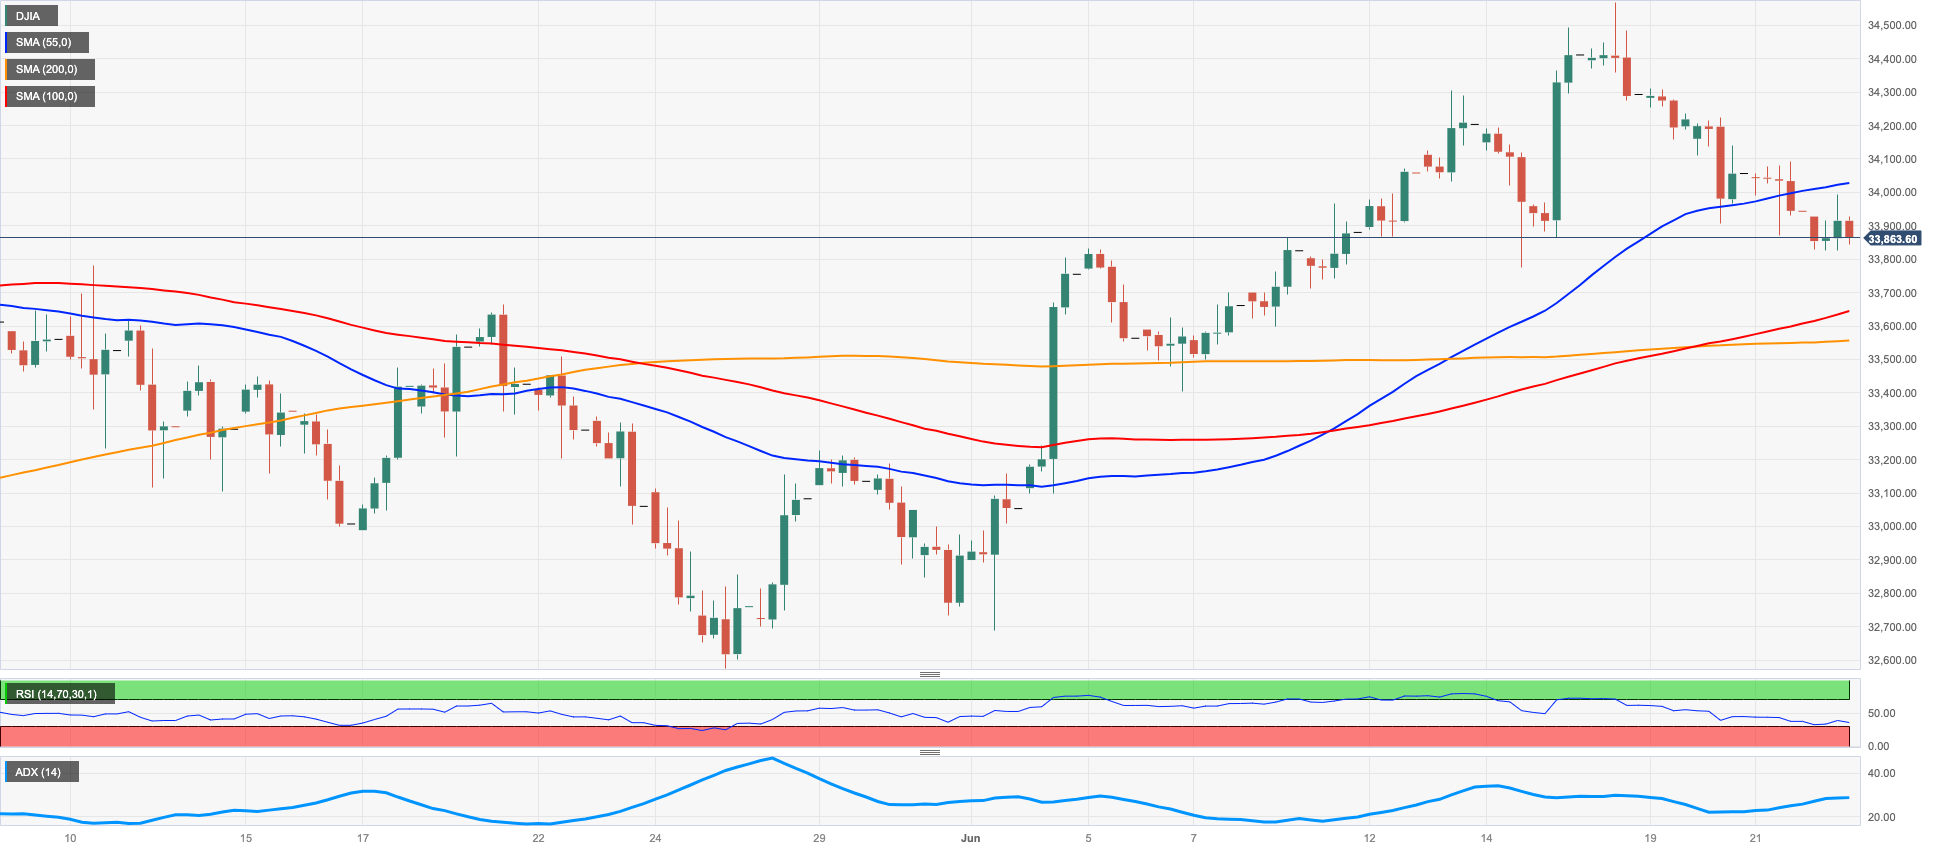
DOW JONES
Equities represented by the Dow Jones saw a modest retreat due to persistent concerns regarding additional tightening by major central banks overseas and the Federal Reserve.
At his second congressional testimony on Thursday, Chair Powell reiterated his stance that it would be appropriate to raise rates a couple of more times this year to control price pressures and reduce economic growth.
His FOMC colleague, M. Bowman, also expressed her support for resuming the hiking cycle after last week's skip.
The Dow Jones dropped 0.21% to 33880, the S&P500 gained 0.02% to 4366, and the tech-reference Nasdaq Composite rose 0.42% to 13559.
Despite the ongoing leg lower, the Dow Jones is expected to resume its upward trend in the short term. On this, the next significant resistance level is at the 2023 peak of 34588 (June 16), followed by the December 2022 high of 34712 (December 13) and the April 2022 top of 35492 (April 21). In terms of support, the 55-day and 100-day SMAs at 33608 and 33362, respectively, provide interim levels before reaching the crucial 200-day SMA at 32845. Further down the line come the May low of 32586 (May 25) and the March 2023 low of 31429 (March 15). South from here, the crucial support level to watch is the 2022 low of 28660 (October 13). The everyday RSI grinded lower to the vicinity of 53.
Top Performers: Merck&Co, Salesforce Inc, Apple
Worst Performers: Boeing, IMB, Caterpillar
Resistance levels: 34588 34712 35492 (4H chart)
Support levels: 33783 33399 32586 (4H chart)
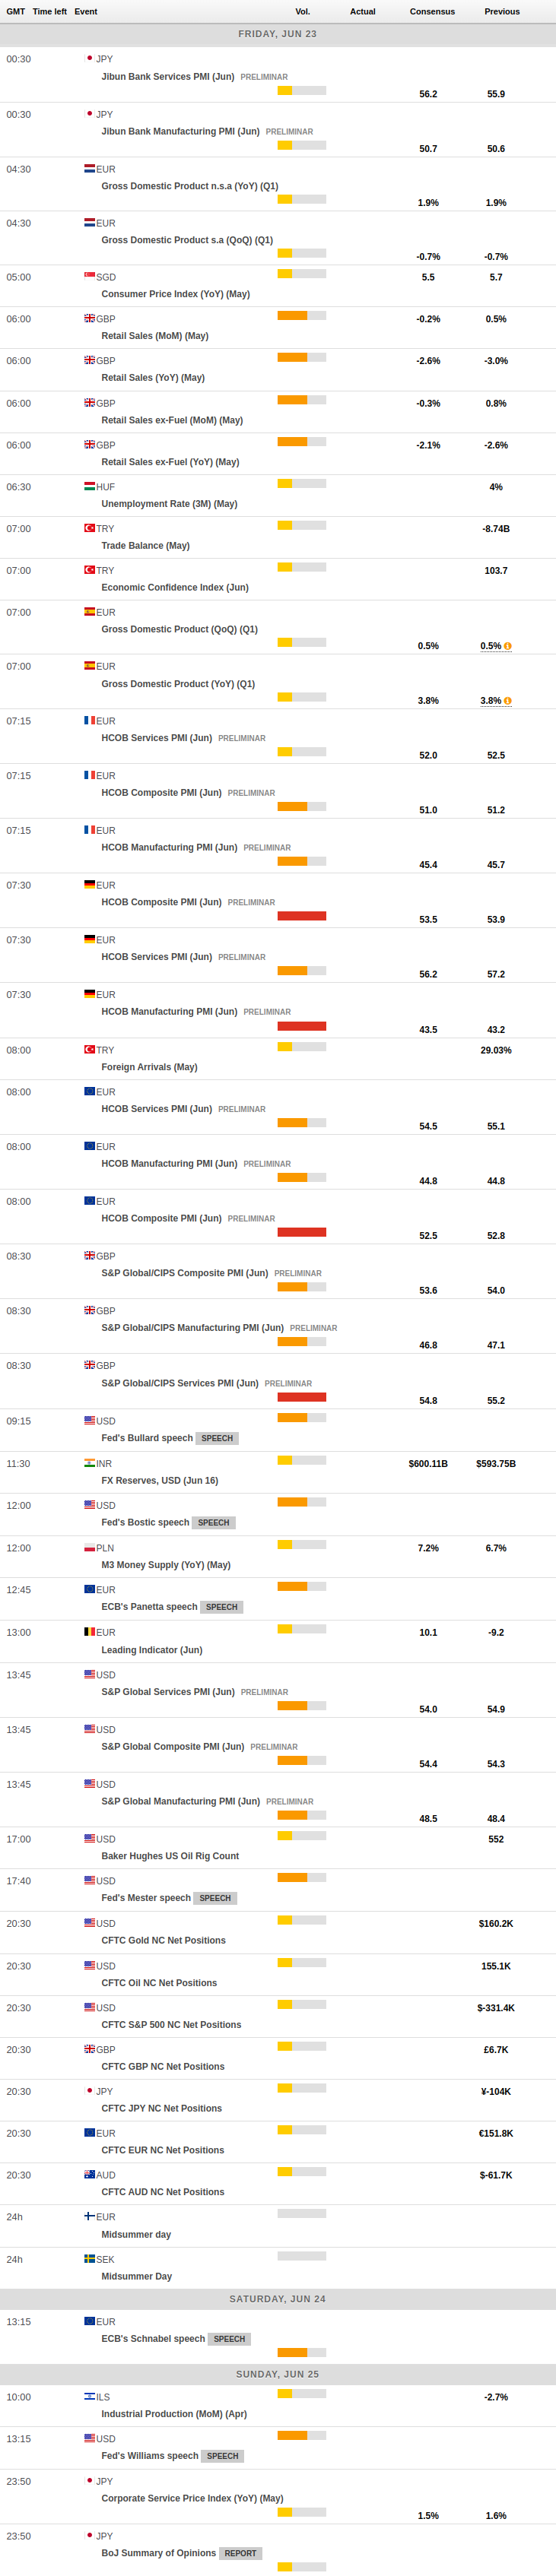
MACROECONOMIC EVENTS
All Information & Updates provided by:

All information relating to the financial markets available on this page has been prepared and issued by FXStreet (Forexstreet SL, Spain, Reg: B62498233) on the basis of publicly available information and all information believed to be reliable and does not conflict with Kuwaiti local laws, and all necessary care has been taken to before the company to ensure that the facts mentioned are correct from the source.
NCM Investment nor any of its directors or employees shall in any way be held responsible for the contents of this news, and the information contained on this page is intended only to provide clients with publicly available information and should not be construed as investment advice, report or analysis and/or constitute an offer or invitation to buy or sell financial instruments of any kind.
RISK WARNING: Forex and CFDs are highly risky leveraged products, as losses can exceed deposits. Please ensure you understand all the risks and take independent advice if necessary. NCM will segregate the clients based on the criteria of the regulator and its bylaws. NCM does not provide any advisory service; the material published does not constitute advice or a recommendation for a transaction in any financial instrument. NCM accepts no responsibility for any use of the content presented and any consequences of that use. Anyone acting on the information provided does so at their own risk.