
- Contact Us:
-

-

-

-


Daily Market Updates
26 Jun 2023
USDJPY
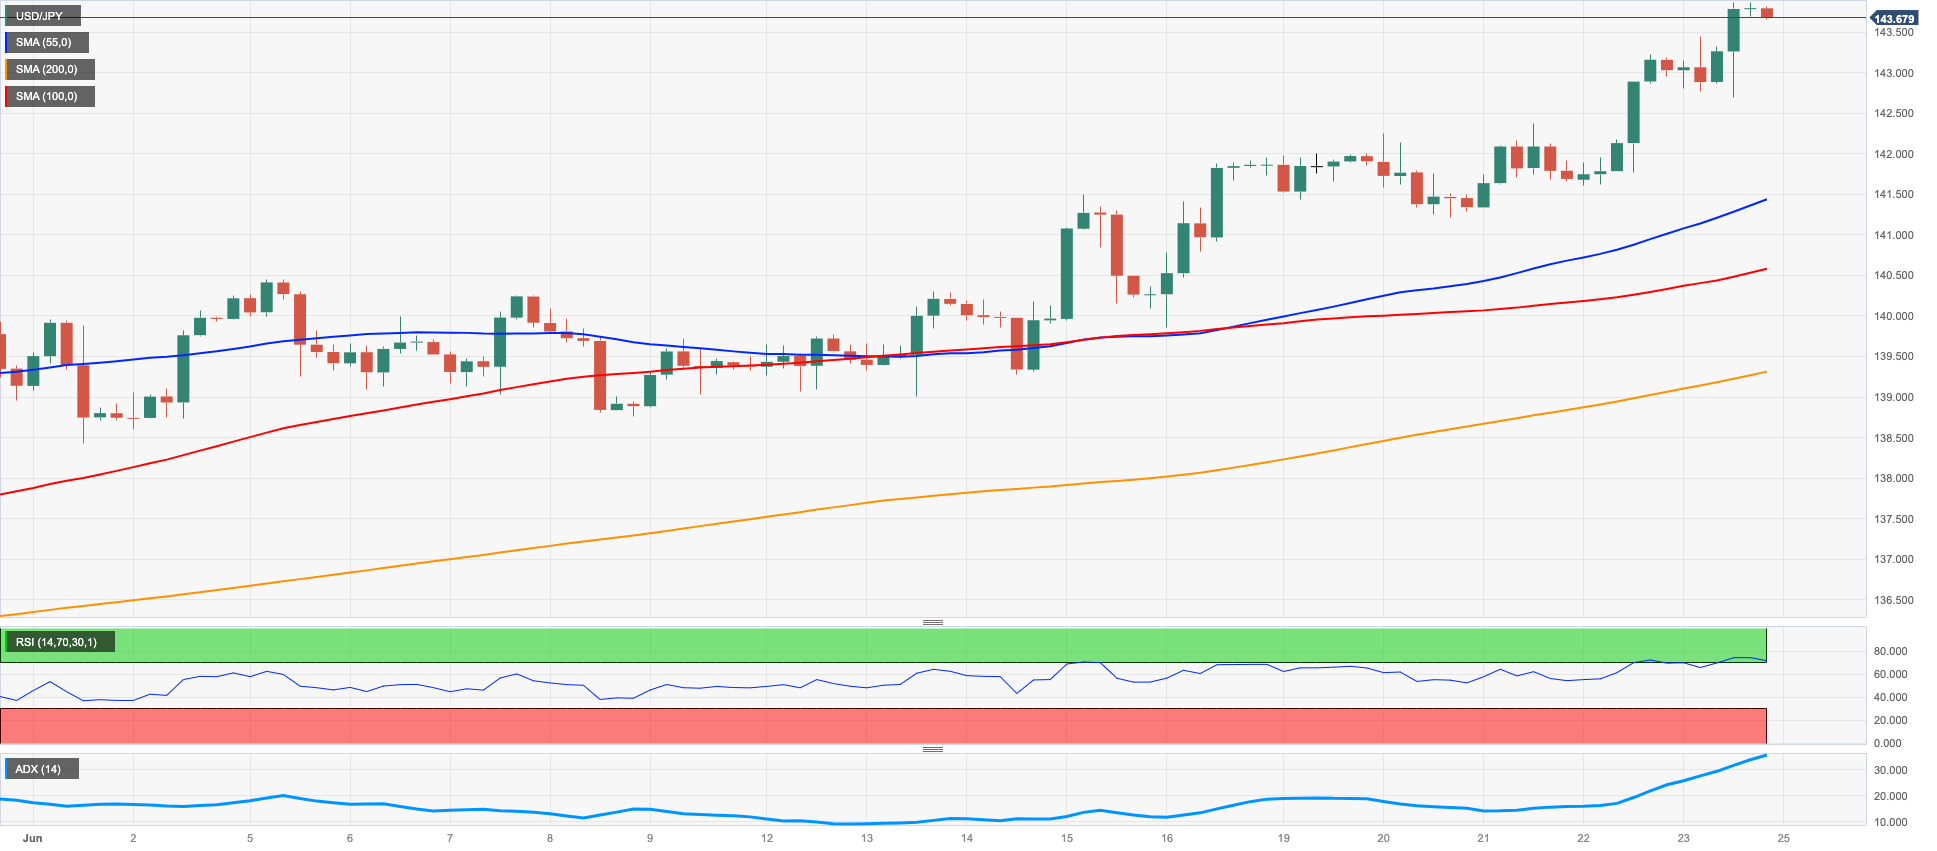
USD/JPY showed persistent upward momentum on Friday, advancing for the third consecutive session and reaching levels just below the 144.00 barrier for the first time since early November 2022.
Despite a corrective decline in US yields across the board, the ongoing positive bias in the US dollar propelled the pair to new highs. The rally was supported by expectations of further tightening by the Federal Reserve, in contrast to the unchanged accommodative stance of the BoJ), which was reaffirmed during the latest BoJ event.
In terms of domestic indicators, the Inflation Rate increased by 3.2% in the year up to May, while the Core Inflation Rate rose by 3.2% over the past twelve months. Additionally, the Inflation Rate Ex-Food and Energy experienced a 4.3% year-on-year growth. Furthermore, the flash Jibun Bank Manufacturing and Services PMIs are anticipated to be 49.8 and 54.2, respectively, in June.
The current outlook for USD/JPY remains positive. Key resistance levels to monitor include the 2023 peak of 143.87 (June 23), followed by the October 2022 high of 151.94 (October 22) and the round level of 152.00. Having said that, if bearish movements occur, initial obstacles can be observed at the June low of 138.42 (June 1), ahead of the key 200-day SMA at 137.20. Additional support levels emerges at the temporary 100-day SMA 135.62 seconded by the weekly low of 133.01 (April 26) and the minor support at 132.01 (April 13). South from here aligns the April low of 130.62 (April 5), before the key level of 130.00 and the March low of 129.63 (March 24), which precedes the February low of 128.08 (February 8). The daily RSI remained well in the overbought territory near 74.
Resistance levels: 143.87 146.79 148.45 (4H chart)
Support levels: 141.33 139.85 139.01 (4H chart)
GBPUSD
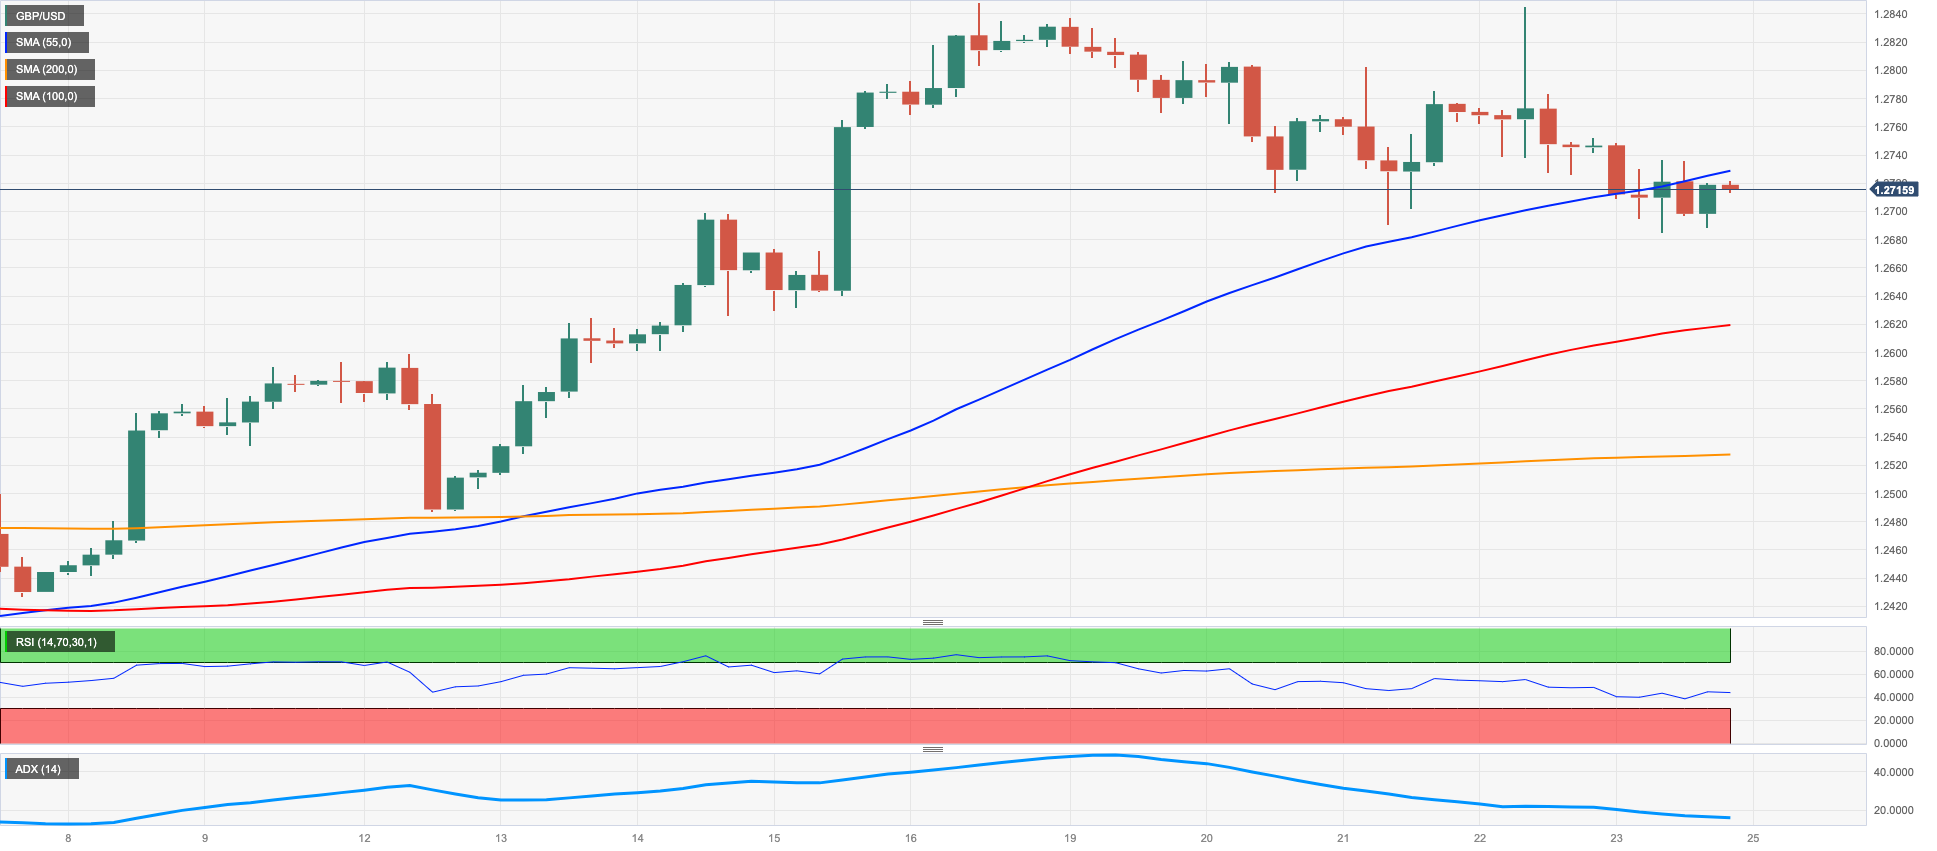
GBP/USD lost further ground and fell to its lowest level of the week, briefly revisiting the sub-1.2700 region on Friday.
The continued strength of the US dollar negatively affected riskier assets, including the Pound, resulting in subdued trading for the second consecutive session at the end of the week.
Despite the Bank of England's unexpected 50 bps rate hike and growing speculation that rates could reach 6.25% by the end of the year, the quid failed to spark some lasting rebound.
In the UK, preliminary PMIs for June showed a decline in both the Manufacturing and Services sectors to 46.2 (from 47.1) and 53.7 (from 55.2), respectively, in line with their European counterparts. In addition, Retail Sales contracted 2.1% in the year to May and expanded 0.3% vs. the previous month, while the Consumer Confidence gauged by Gfk improved a little to -24 in June.
GBP/USD is at risk of further short-term declines, with support levels around 1.2590, where the 2021-2023 line sits, seconded by the temporary 55-day SMA at 1.2514, and the June low of 1.2368 (June 5). Additional pullbacks could lead to the May low at 1.2308 (May 25) before the April low at 1.2274 (April 3), as well as the key 200-day SMA at 1.2073. On the upside, if Cable breaks above the 2023 high of 1.2848 (June 16), it could potentially test the 200-week SMA at 1.2874 prior to the psychological level of 1.3000. The day-to-day RSI flirted with the 60 yardstick.
Resistance levels: 1.2848 1.3089 1.3146 (4H chart)
Support levels: 1.2685 1.2613 1.2486 (4H chart)
AUDUSD
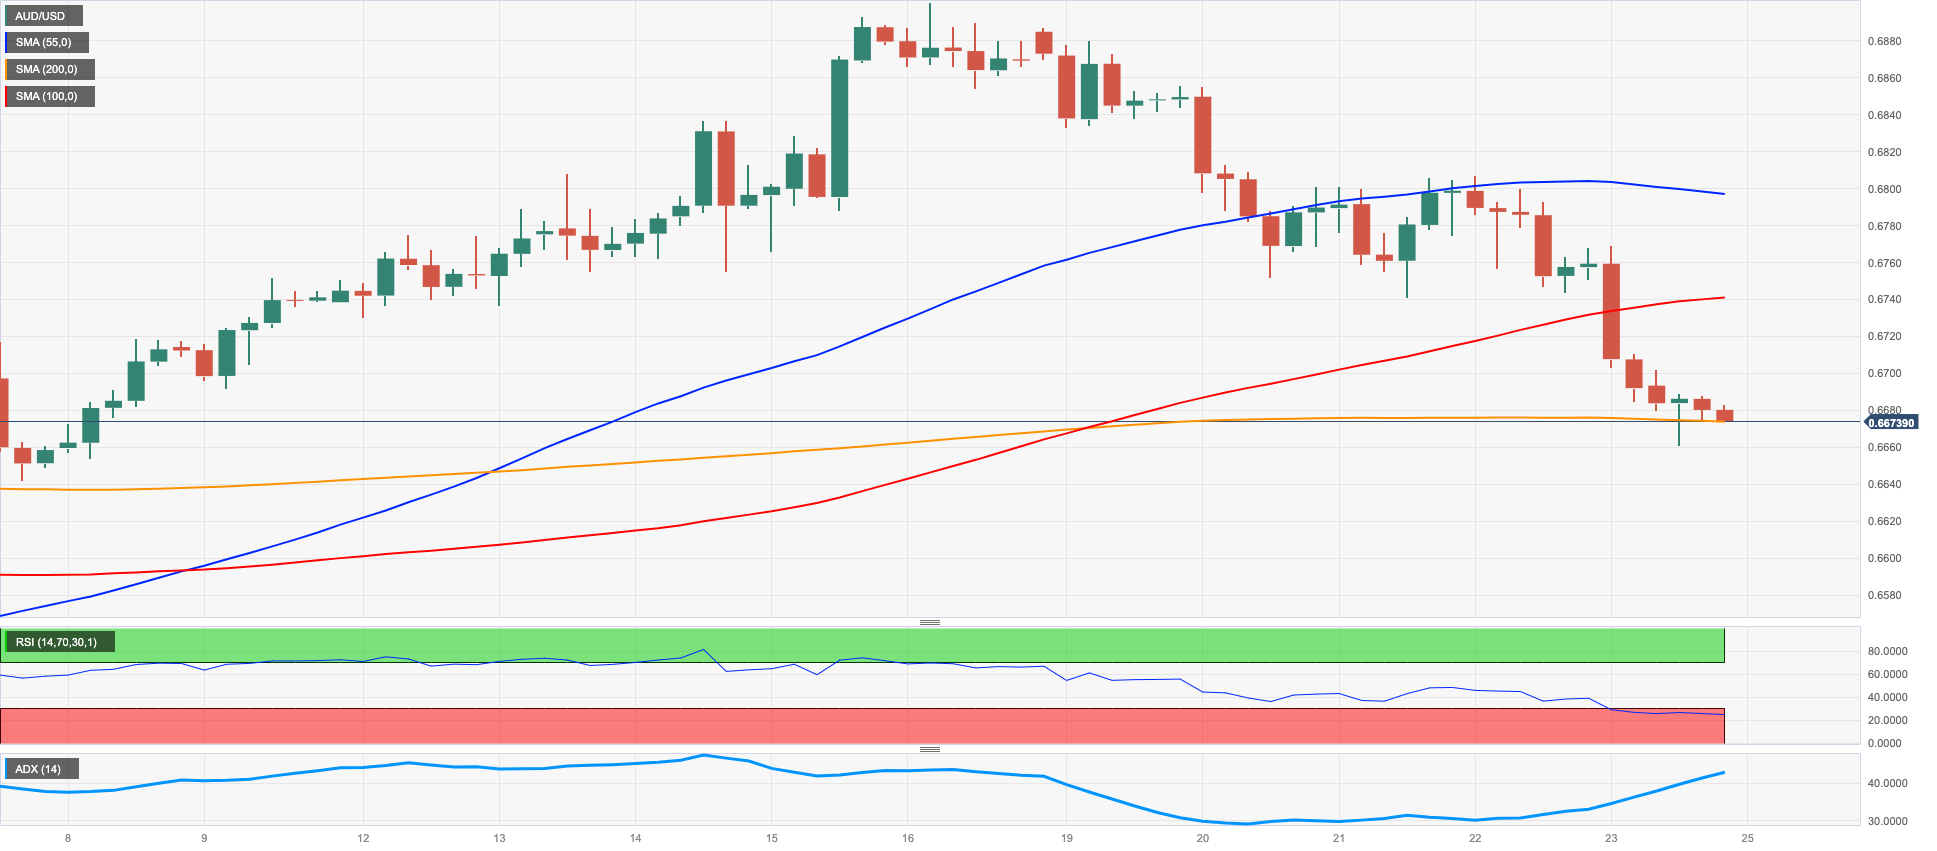
At the end of last week, AUD/USD continued to decline and reached new lows of around 0.6660, which haven't been seen in the past two weeks. This downward trend was a result of the pair reversing three consecutive advances, following its rejection from the top boundaries of 0.6900 on June 16.
The Australian dollar experienced its second consecutive daily pullback due to the bearish tone in the risk complex and extra strength of the greenback, which has been fueled by rising recession fears and speculation of further tightening by the Fed.
In Oz, the preliminary Judo Bank Manufacturing and Services PMIs for June are expected to be at 48.6 and 50.7, respectively.
There is a possibility of further correction for the AUD/USD. Against that, there are no support levels of note until the 2023 low of 0.6458 (May 31), ahead of the weekly lows of 0.6386 (November 10, 2022), and the November 2022 low of 0.6272 (November 3). On the contrary, if the bullish bias resumes, the pair may face resistance at the June peak of 0.6899 (June 16) before the critical level of 0.7000, the weekly high of 0.7029 (February 14), and the 2023 top of 0.7157 (February 2). The day-to-day RSI dropped below the 46 mark.
Resistance levels: 0.6806 0.6899 0.6920 (4H chart)
Support levels: 0.6662 0.6641 0.6579 (4H chart)
GOLD
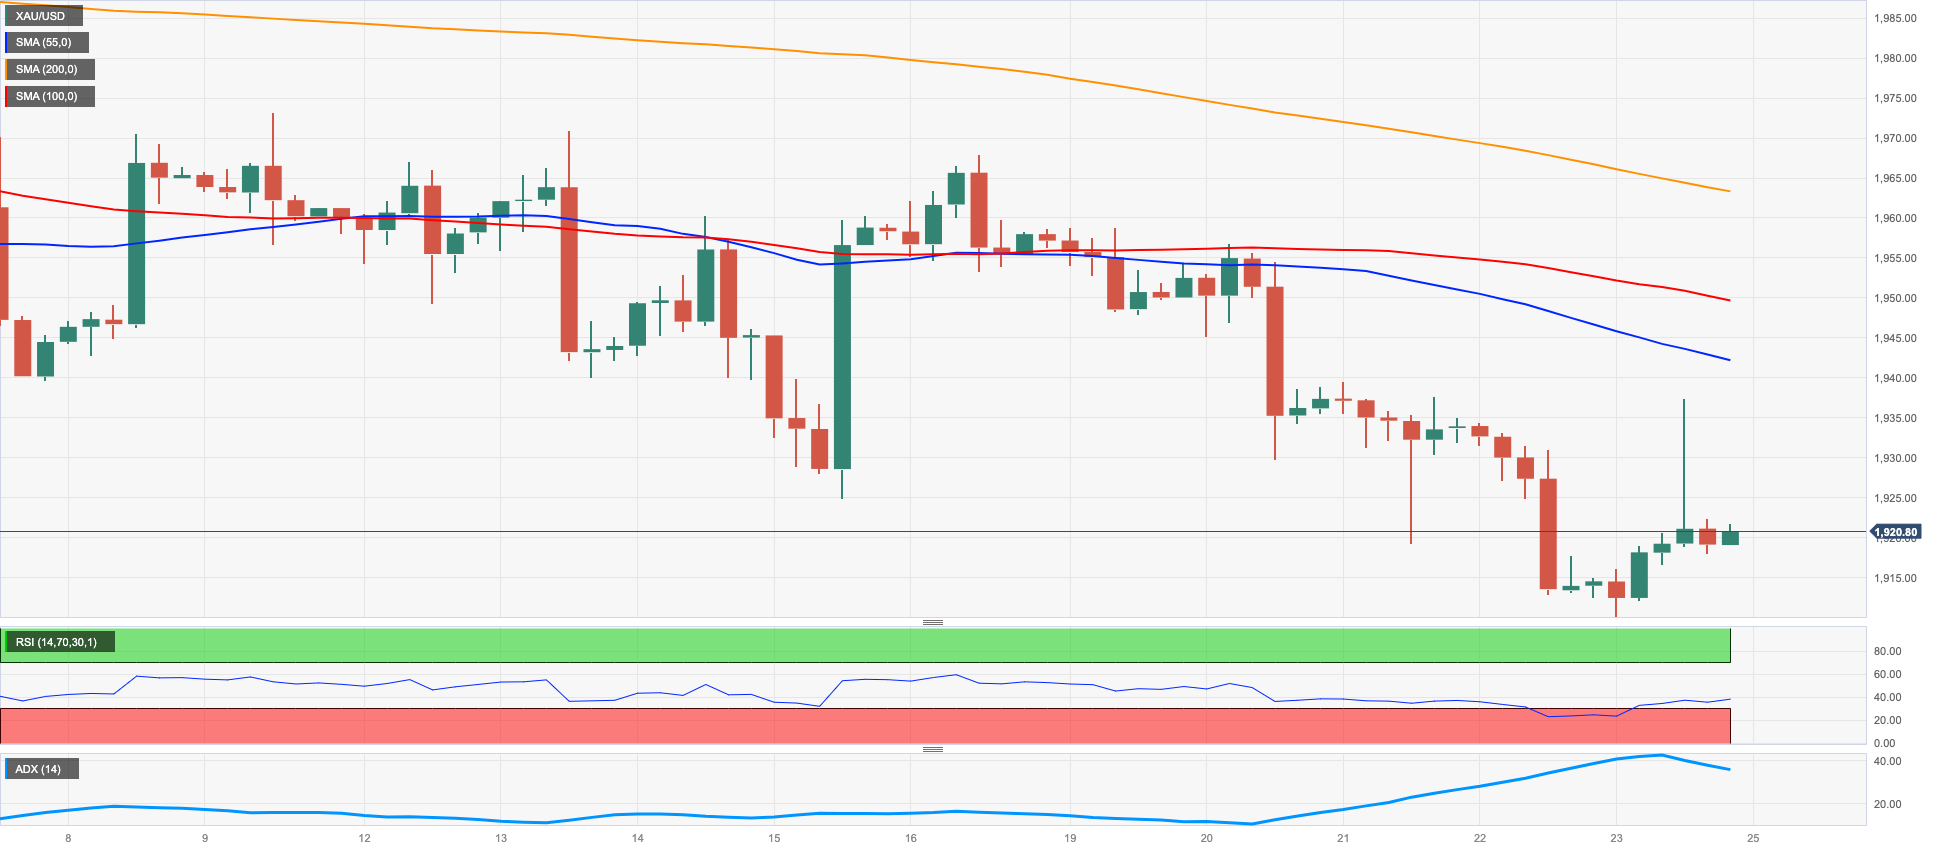
After five consecutive daily pullbacks, the precious metal showed some signs of relief as prices closed with modest gains on Friday.
The price of a troy ounce of gold had a volatile session, hitting a low of around $1910 before surging to the $1940 zone and closing near the $1920 mark.
The strong sentiment around the buck weighed on gold, but the correction in US yields helped to prop up the daily uptick.
However, gold is expected to remain under scrutiny due to the continuation of the hiking campaign by major central banks, including the Federal Reserve.
Gold has broken below its recent consolidation range and immediate support levels can be identified at the June low of $1910 (June 23), followed by the 200-day SMA at $1852. The next support levels are the 2023 low of $1804 (February 28), and the critical threshold of $1800 per troy ounce. On the flip side, the initial obstacle for gold is at the June high of $1983 (June 2), followed by the significant milestone of $2000. It's important to note that there are no major resistance levels until the 2023 peak of $2067 (May 4), ahead of the 2022 high of $2070 (March 8), and ultimately the all-time record of $2075 (August 7, 2020).
Resistance levels: $1965 $1983 $2022 (4H chart)
Support levels: $1910 $1885 $1809 (4H chart)
CRUDE WTI
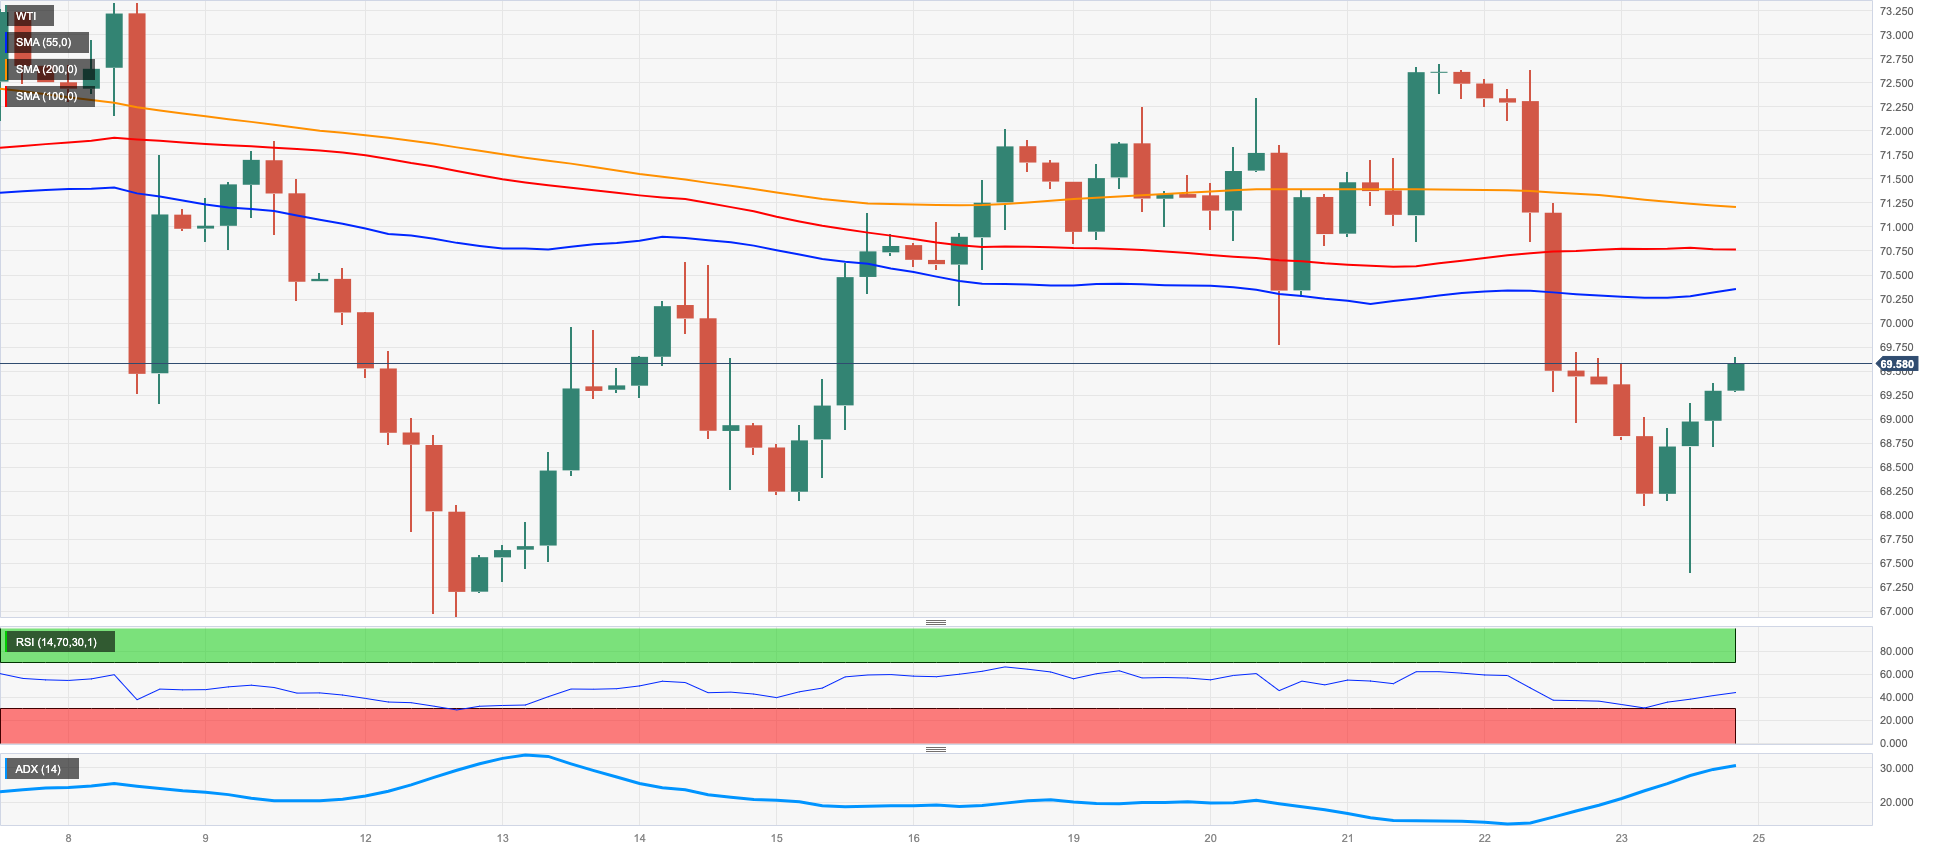
WTI prices closed Friday's session with marginal losses around $69.50 per barrel, recovering from an earlier drop to the $67.40 zone.
The combination of concerns regarding the Chinese recovery and a possible central-bank-led economic slowdown continued to weigh on traders' sentiment and keep the commodity's price action depressed on a weekly basis.
In terms of data, driller Baker Hughes reported that US total oil rigs decreased by 6 to 546 in the week ending June 23.
Looking ahead, the immediate downside for WTI lies at the June low of $66.86 (June 13), followed by the 2023 low at $63.61 (May 4), the December 2021 low at $62.46 (December 2), and the critical level of $60.00 per barrel. By contrast, prices could potentially challenge the June high of $74.92 (June 5), which finds support from the vicinity of the temporary 100-day SMA at $74.29 and is positioned just before the critical 200-day SMA at $77.98. Notable resistance levels beyond that include the weekly peak of $79.14 (April 24), followed by the significant barrier of $80.00 per barrel, the 2023 peak of $83.49 (April 12), and the November 2022 high of $93.73 (November 7).
Resistance levels: $71.17 $72.68 $73.24 (4H chart)
Support levels: $67.32 $66.77 $63.71 (4H chart)
GER40
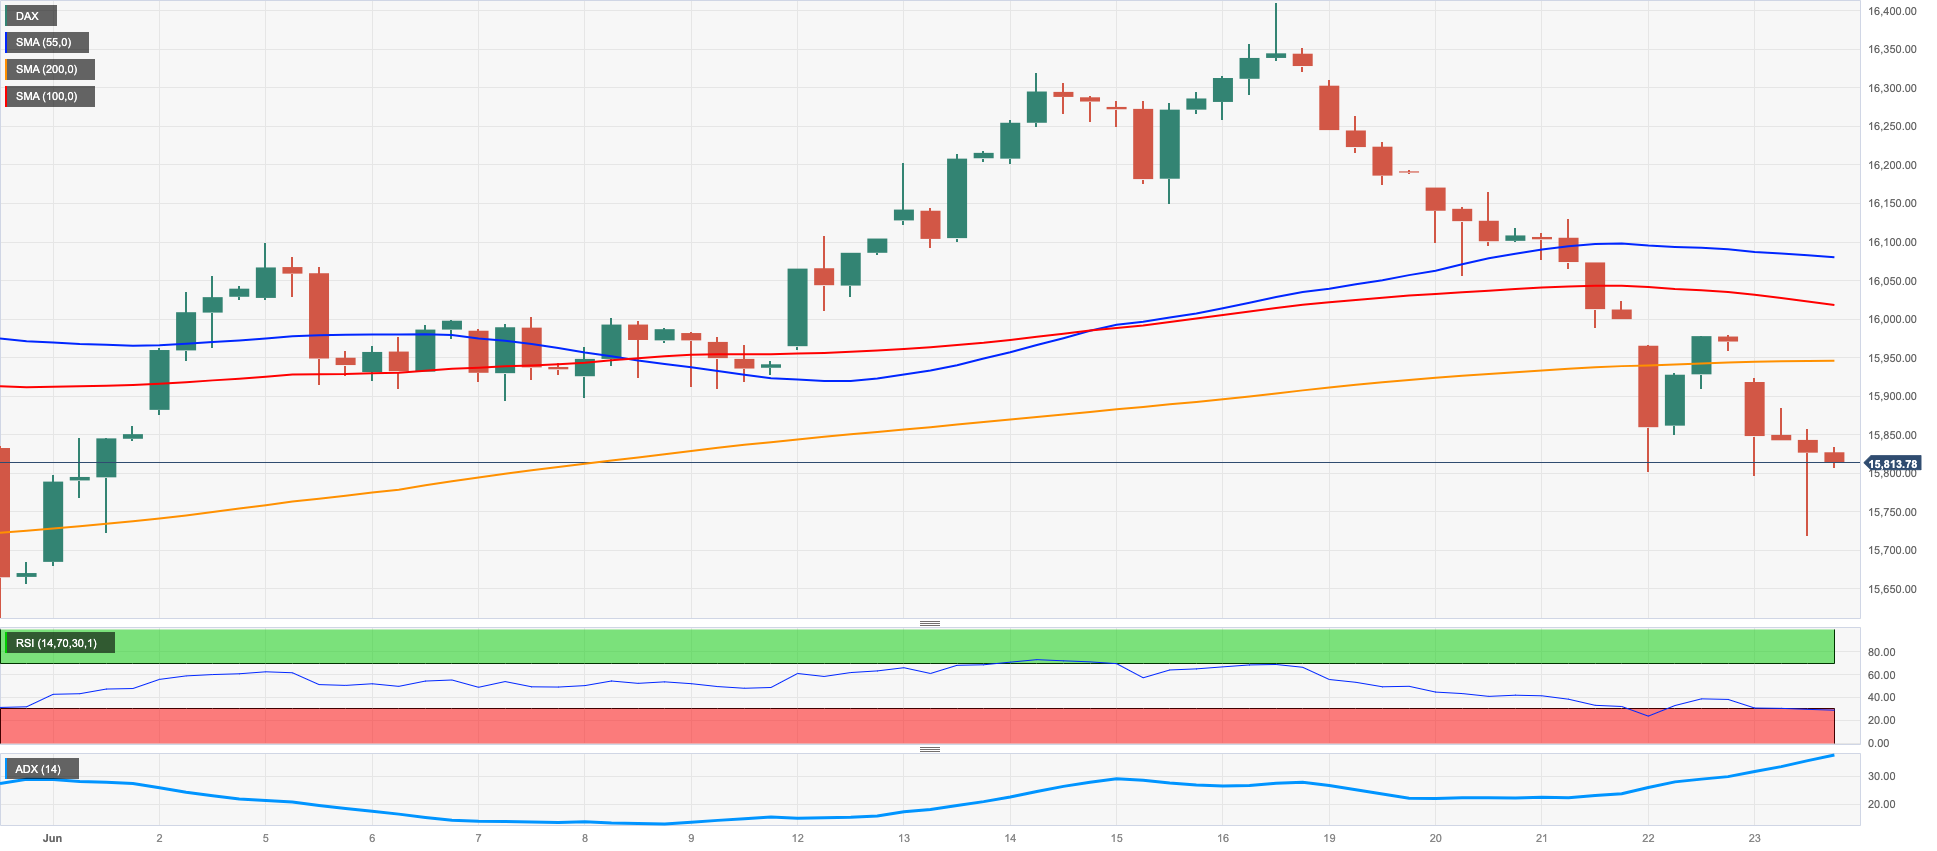
Another negative session in the European stocks markets saw the German reference DAX40 retreat for the fifth consecutive session and print new monthly lows around the 15700 region.
The spectre of a recession in the region appeared reignited after flash prints from Manufacturing and Services PMIs in the core euro area (France, Germany and the Eurozone) disappointed expectations for the month of June.
In addition, jitters around the idea that a recession is probably in the offing in the euro bloc also kept buyers at bay during throughout the week.
Further weakness in the index echoed in the 10-year bund yields, which dropped to multi-day lows near 2.30%.
If the current bearish trend continues, the first objective would be the interim 100-day SMA at 15658, which somewhat underpins the May low of 15629 (May 31). Further losses could result in revisiting the April low of 15482 (April 5), followed by minor support at 14809 (March 24), and the significant 200-day SMA at 14703. The March low of 14458 (March 20) would be the next level. On the upside, the immediate target is the all-time high of 16427 (June 16). The daily RSI broke below the 48 level.
Best Performers: Sartorius AG VZO, Zalando SE, Adidas
Worst Performers: Daimler Truck Holding, Mercedes Benz Group, Henkel VZO
Resistance levels: 16046 16427 17000? (4H chart)
Support levels: 15733 15629 15482 (4H chart)
NASDAQ
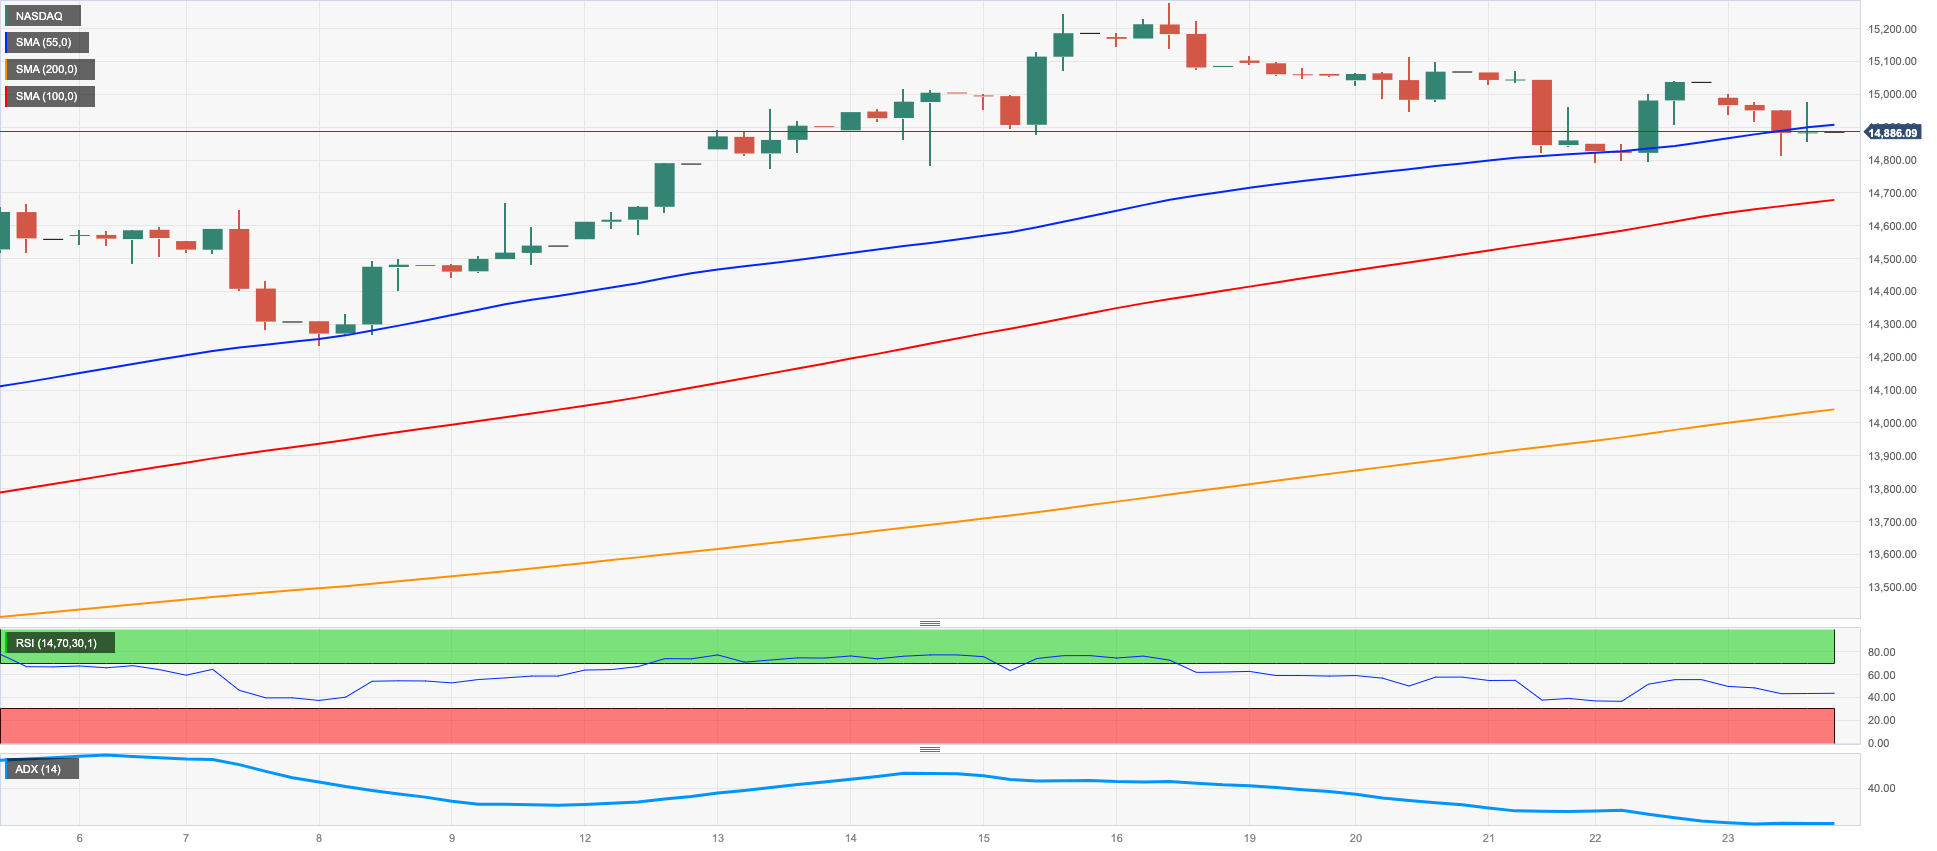
On Friday, the tech sector benchmark Nasdaq 100 retreated modestly and closed the week just below the significant 15000 mark. It appears that the index has encountered strong resistance near the 15300 zone, which caused it to give away some of the previous weekly advance.
The ongoing rally in the sector was undermined by increasing concerns about a potential US recession, as well as speculation of extra rate hikes by the Fed in the second half of the year, leading to a further decline in the index by the end of the week.
Looking ahead, the Nasdaq 100's uptrend is expected to target the 2023 high of 15284 (June 16), before the round level of 16000. Instead, it's crucial to monitor immediate support levels, which include the interim 55-day SMA at 13740, closely followed by the weekly low of 13520 (May 24), and the May low of 12938 (May 4). If the index falls below this level, it may experience a potential decline towards the April low of 12724 (April 25), ahead of the 200-day SMA at 12299 and the March low of 11695 (March 13). The daily RSI deflated further to the 63 zone.
Top Gainers: Sirius XM, Adobe, Meta Platforms
Top Losers: JD.com Inc Adr, Lucid Group, Atlassian Corp Plc
Resistance levels: 15284 16017 16607 (4H chart)
Support levels: 14794 14383 13520 (4H chart)
DOW JONES
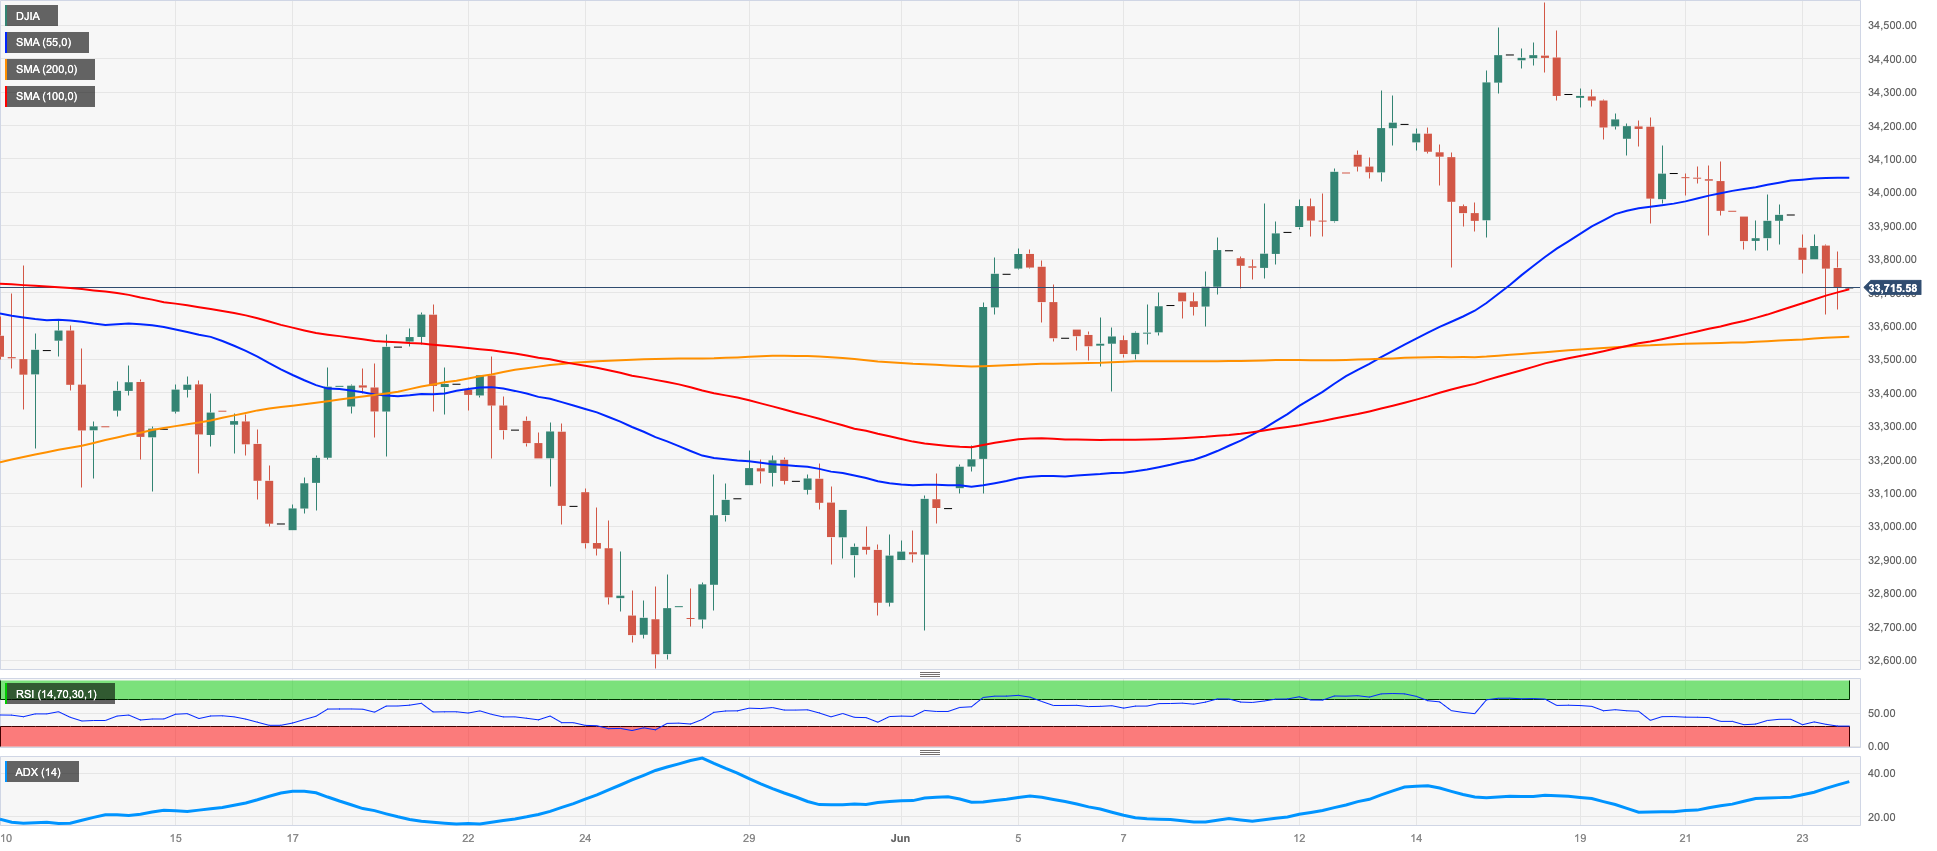
Since Monday, the US stock benchmark Dow Jones index has experienced continuous losses, putting an end to a three-week positive streak.
The concerns about an impending economic downturn, especially with the likely prospect of the Federal Reserve implementing further tightening measures, were intensified by the hawkish comments from the Fed's rate-setters. As a result, even the slightest attempts at a bullish recovery were suppressed on Friday.
Overall, the Dow Jones dropped by 0.65% to reach 33,727, while the S&P 500 deflated by 0.77% to 4,348, and the technology-heavy Nasdaq Composite retreated by 1.01% to 13,492.
Further losses in the Dow are now expected to meet initial provisional contention at the 55-day and 100-day SMAs at 33615 and 33363 , respectively, before reaching the crucial 200-day SMA at 32859. Further down the line, there is the May low of 32586 (May 25) followed by the March 2023 low of 31429 (March 15) and the 2022 low of 28660 (October 13). The other way around, the next significant resistance level is located at the 2023 peak of 34588 (June 16), prior to the high from December 2022 at 34712 (December 13) and the April 2022 top at 35492 (April 21). The daily RSI revisited the 50 threshold.
Top Performers: Intel, Merck&Co, Visa A
Worst Performers: Cisco, Walgreen Boots, Goldman Sachs
Resistance levels: 34588 34712 35492 (4H chart)
Support levels: 33646 33399 32586 (4H chart)
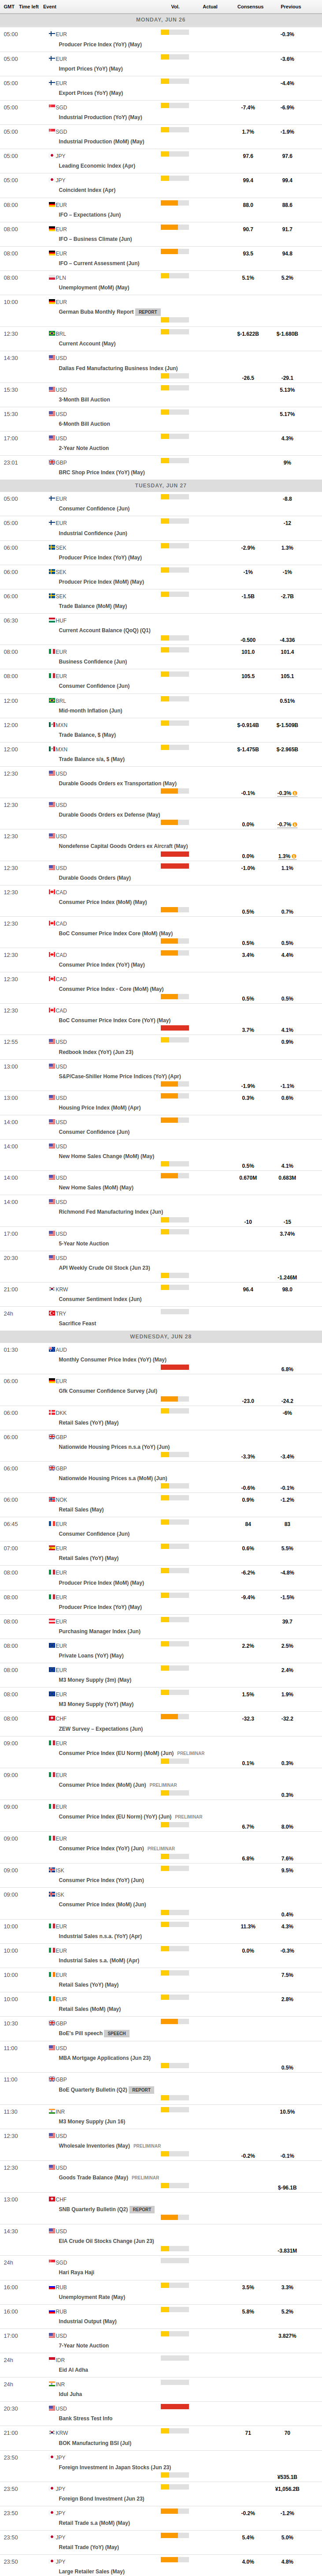
MACROECONOMIC EVENTS
All Information & Updates provided by:

All information relating to the financial markets available on this page has been prepared and issued by FXStreet (Forexstreet SL, Spain, Reg: B62498233) on the basis of publicly available information and all information believed to be reliable and does not conflict with Kuwaiti local laws, and all necessary care has been taken to before the company to ensure that the facts mentioned are correct from the source.
NCM Investment nor any of its directors or employees shall in any way be held responsible for the contents of this news, and the information contained on this page is intended only to provide clients with publicly available information and should not be construed as investment advice, report or analysis and/or constitute an offer or invitation to buy or sell financial instruments of any kind.
RISK WARNING: Forex and CFDs are highly risky leveraged products, as losses can exceed deposits. Please ensure you understand all the risks and take independent advice if necessary. NCM will segregate the clients based on the criteria of the regulator and its bylaws. NCM does not provide any advisory service; the material published does not constitute advice or a recommendation for a transaction in any financial instrument. NCM accepts no responsibility for any use of the content presented and any consequences of that use. Anyone acting on the information provided does so at their own risk.