
- Contact Us:
-

-

-

-


Daily Market Updates
27 Jun 2023
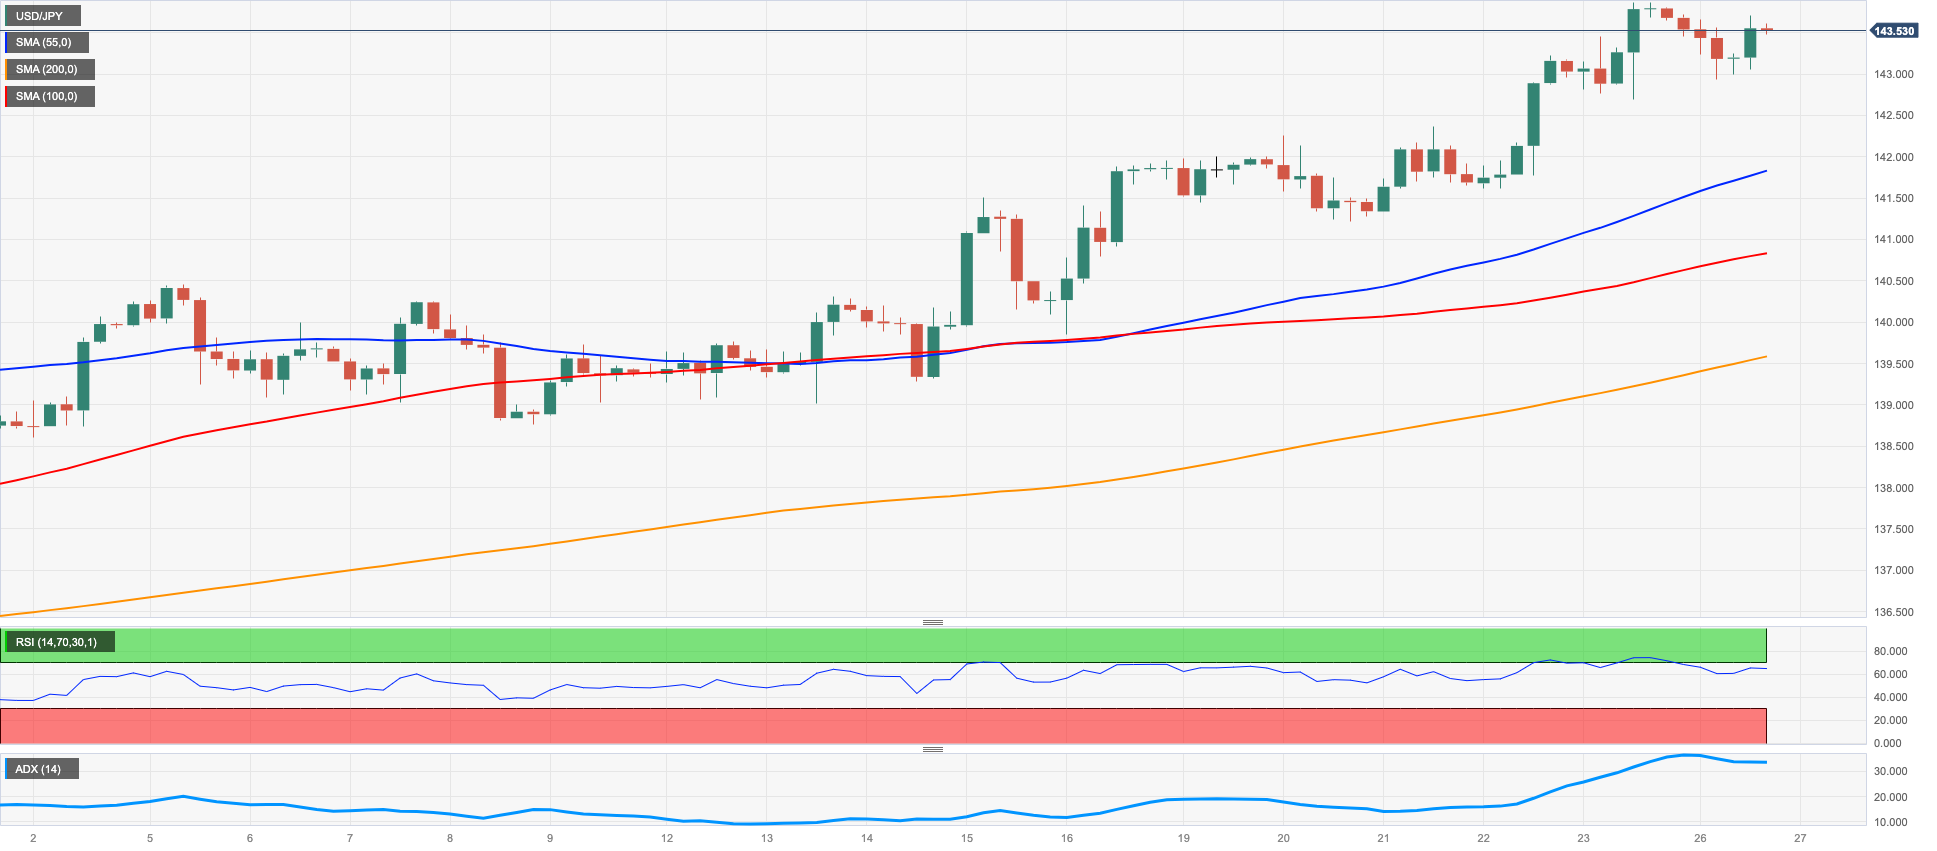
USDJPY
USD/JPY had an inconclusive trading session, although it stayed within the upper end of the recent range, close to Friday's 2023 highs below the 144.00 level.
The selling pressure on the Japanese safe haven was favoured by the softer tone in the greenback, combined with the mixed performance in US yields across the curve. However, comments from Japanese officials during early trading revived the possibility of FX intervention and lent some legs to the JPY.
On the latter, Japan's Chief Cabinet Sec. Matsuno stated that it was important for FX to move stably, reflecting economic fundamentals. He further mentioned that they were closely watching FX moves with a high sense of urgency. In addition, Japan's Top FX Diplomat Kanda stated that they would respond to FX moves if they became excessive. He emphasized that FX should fluctuate steadily in line with fundamentals and mentioned that their focus was on FX moves rather than levels.
In the docket, the BoJ Summary of Opinions stated that it was deemed suitable to sustain the current monetary easing and that sustainable and consistent achievement of the price objective required wage growth instead of solely relying on cost-push inflation. The BoJ believed that it was premature to alter the policy due to the eagerness of smaller enterprises to increase wages and investment. The central bank also emphasized the need to monitor the potential side effects of maintaining an easy policy, as the long-term risk to prices was deemed to be weighted towards the downside. Furthermore, the distortion in the shape of the yield curve had been resolved, and therefore, there was no need to make operational changes to YCC.
Additionally, final figures saw the Coincident Index improve marginally to 97.3 and the Leading Economic Index come unchanged at 96.8, both prints for the month of April.
The outlook for USD/JPY remains positive, with key resistance levels at the 2023 high of 143.87 (June 23), followed by the October 2022 top of 151.94 (October 22) and the round level of 152.00. On the downside, initial obstacles can be observed at the June low of 138.42 (June 1), followed by the key 200-day SMA at 137.20, and additional support levels at the temporary 100-day SMA of 135.73, the weekly low of 133.01 (April 26), and the minor support at 132.01 (April 13). South of here, the April low of 130.62 (April 5) is followed by the key level of 130.00 and the March low of 129.63 (March 24), which precedes the February low of 128.08 (February 8). The daily RSI remained in the overbought territory beyond 72.
Resistance levels: 143.87 146.79 148.45 (4H chart)
Support levels: 142.64 141.21 139.85 (4H chart)
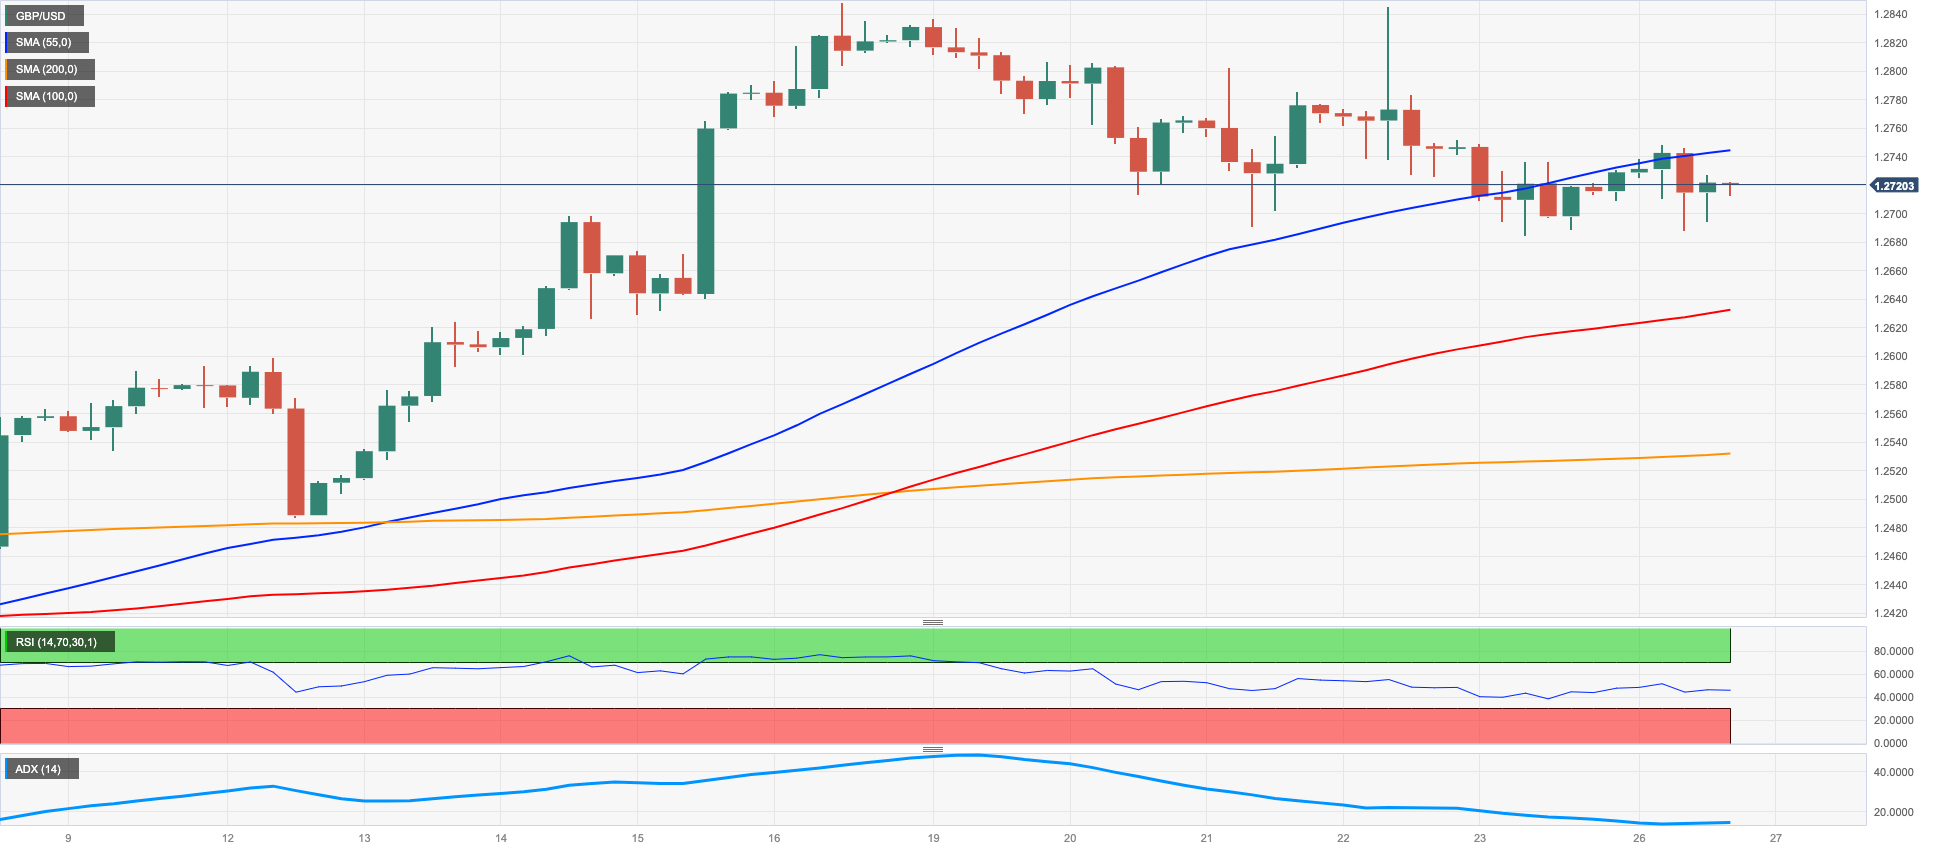
GBPUSD
The greenback's loss of momentum lifted spirits around the Sterling and pushed GBP/USD back to the area above the 1.2700 resistance level at the beginning of the week.
Meanwhile, market participants continued to factor in the possibility of further tightening by the Bank of England (BoE), especially after the recent UK inflation data revealed an increase in consumer prices. This contrasts sharply with the bank's view that prices should significantly decline in the latter half of the year.
In terms of data from the UK, the CBI Distributive Trades index slightly improved to -9 in June (from -10), representing the only release across the Channel.
GBP/USD faces the risk of additional short-term declines, with support levels identified around 1.2590, where the 2021-2023 trendline is positioned. This is followed by the provisional 55-day SMA at 1.2520 and the June low of 1.2368 (June 5). The latter appears propped up by the interim 100-day SMA at 1.2353 and comes ahead of the May low at 1.2308 (May 25) and the April low at 1.2274 (April 3), as well as the crucial 200-day SMA at 1.2080. On the upside, if Cable surpasses the 2023 high of 1.2848 (June 16), it could potentially test the 200-week SMA at 1.2877 before reaching the psychological level of 1.3000. The everyday RSI looked stable around 61.
Resistance levels: 1.2848 1.3089 1.3146 (4H chart)
Support levels: 1.2685 1.2534 1.2486 (4H chart)
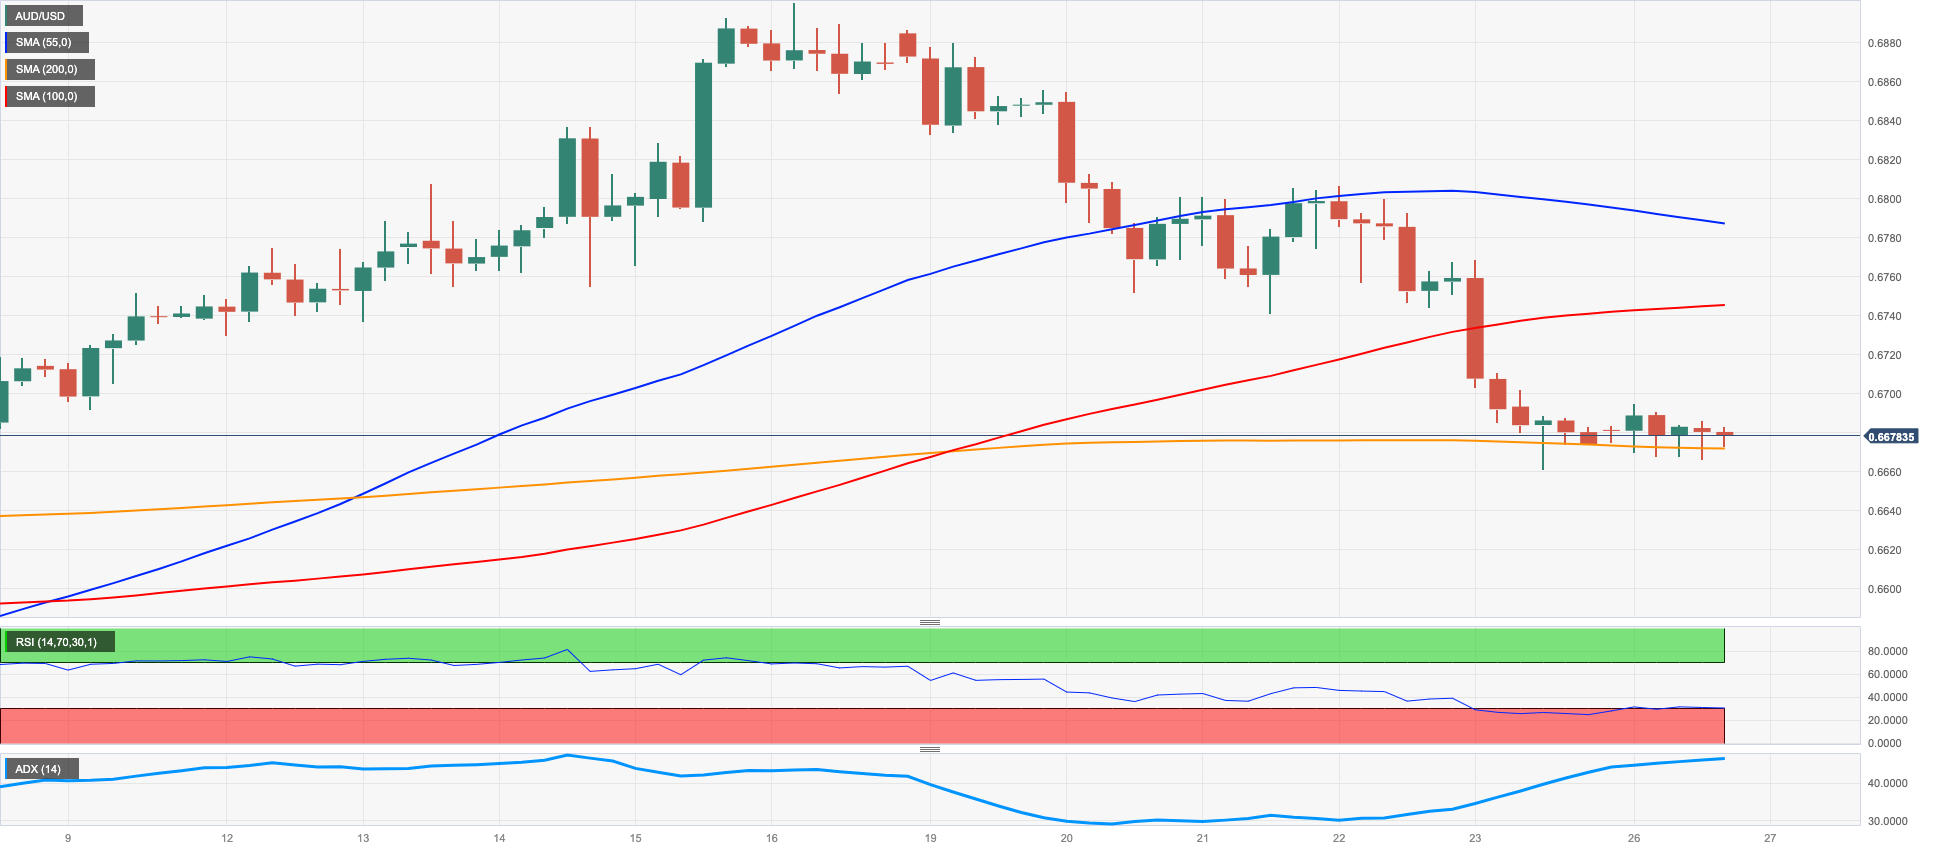
AUDUSD
AUD/USD began the new week trading within a narrow range below 0.6700, which is also where the important 200-day SMA is located.
Despite the slight decline in the value of the greenback, the Australian dollar did not experience any significant gains and remained at the lower end of its recent significant drop.
The downward pressure on commodity prices, including copper and iron ore, also contributed to the pair's lacklustre performance.
At the start of the week, no economic data was released in Australia.
There is a potential for further correction in AUD/USD. The loss of the weekly low of 0.6662 (June 23) is expected to pave the way for a probable deeper pullback to the 2023 low of 0.6458 (May 31) prior to the November 2022 low at 0.6272 (November 3) and the 2022 low of 0.6169 (October 13). Having said that, there is immediate resistance at the June peak of 0.6899 (June 16), ahead of the critical level of 0.7000, the weekly high of 0.7029 (February 14), and the 2023 peak of 0.7157 (February 2). The day-to-day RSI seems to have settled around 46.
Resistance levels: 0.6806 0.6899 0.6920 (4H chart)
Support levels: 0.6662 0.6641 0.6579 (4H chart)
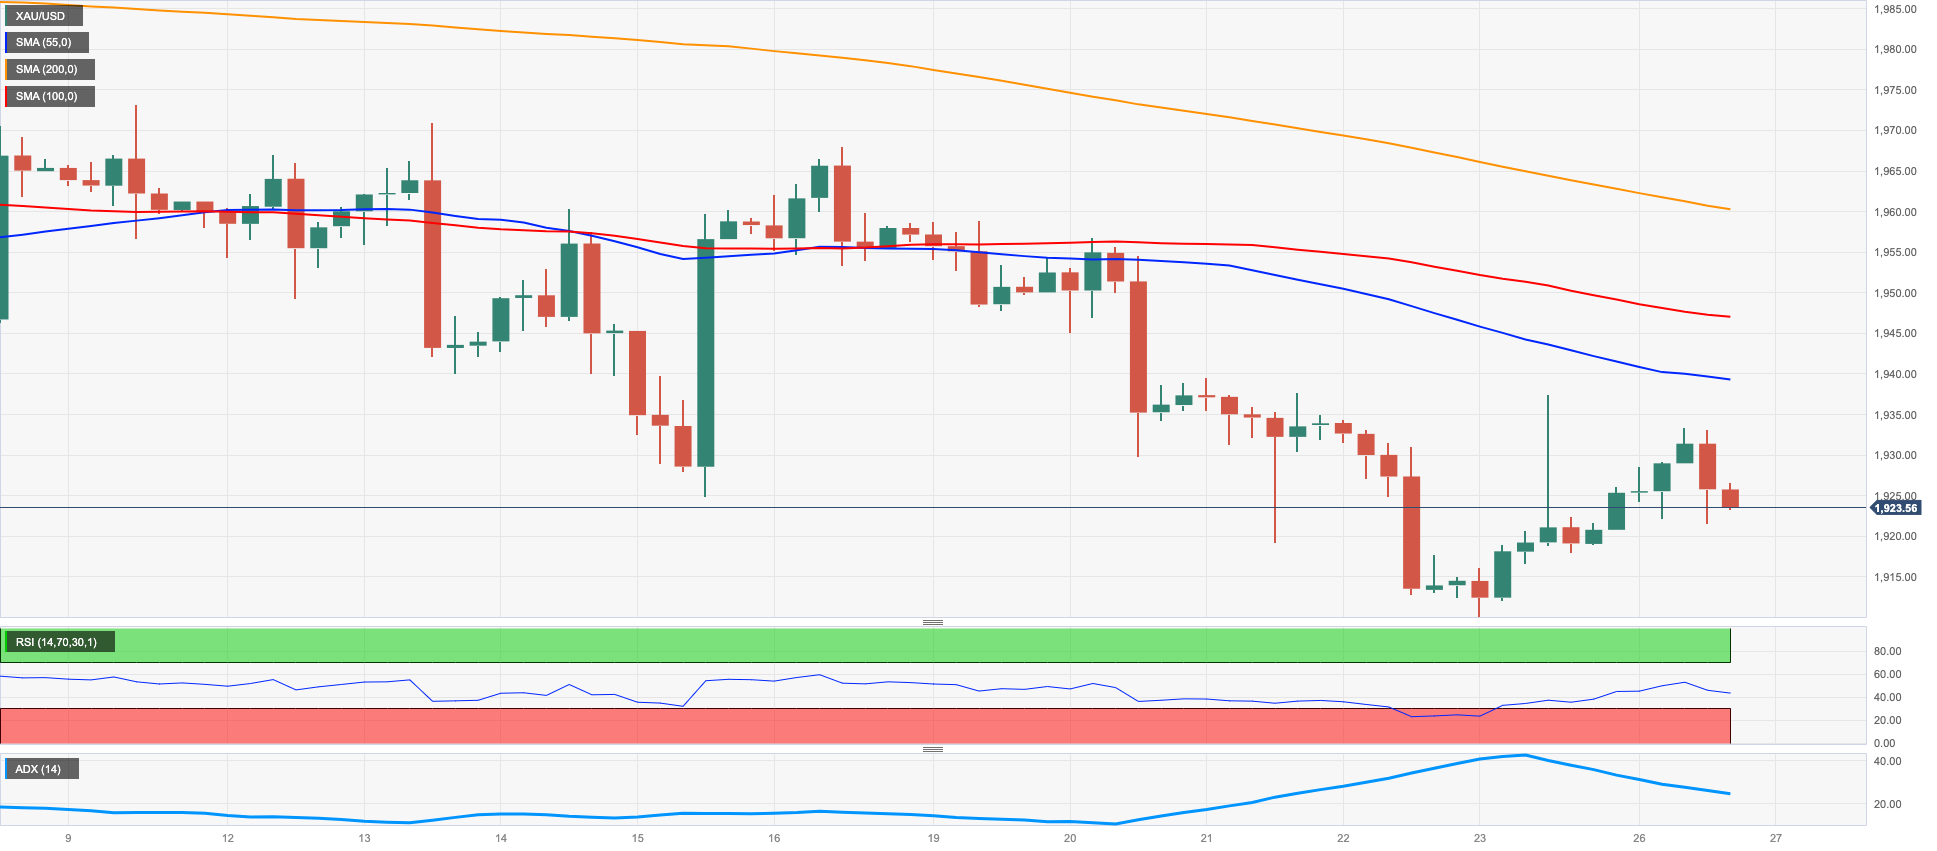
GOLD
At the beginning of the week, the price of a troy ounce of gold continued to rise, briefly surpassing the $1930 level after Friday's small gains.
This positive trend can be attributed to the US dollar's decreased strength, low US yields, and concerns surrounding recent events in Russia.
Moving forward, the gold market is expected to closely monitor the ECB Forum in Sintra, as the central bank may reveal more information about its monetary policy plans for the second half of the year.
Gold has recently broken below its consolidation range, and immediate support levels can be identified at the June low of $1910 (June 23), while the breach of the key $1900 round level could trigger a potential retracement to the key 200-day SMA at $1853. The next support levels are the 2023 low of $1804 (February 28) and the critical threshold of $1800 per troy ounce. On the other hand, the initial obstacle for gold is at the June top of $1983 (June 2), followed by the significant milestone of $2000. Notably, there are no major resistance levels until the 2023 peak of $2067 (May 4), ahead of the 2022 high of $2070 (March 8), and ultimately the all-time record of $2075 (August 7, 2020).
Resistance levels: $1937 $1963 $1983 (4H chart)
Support levels: $1910 $1885 $1809 (4H chart)
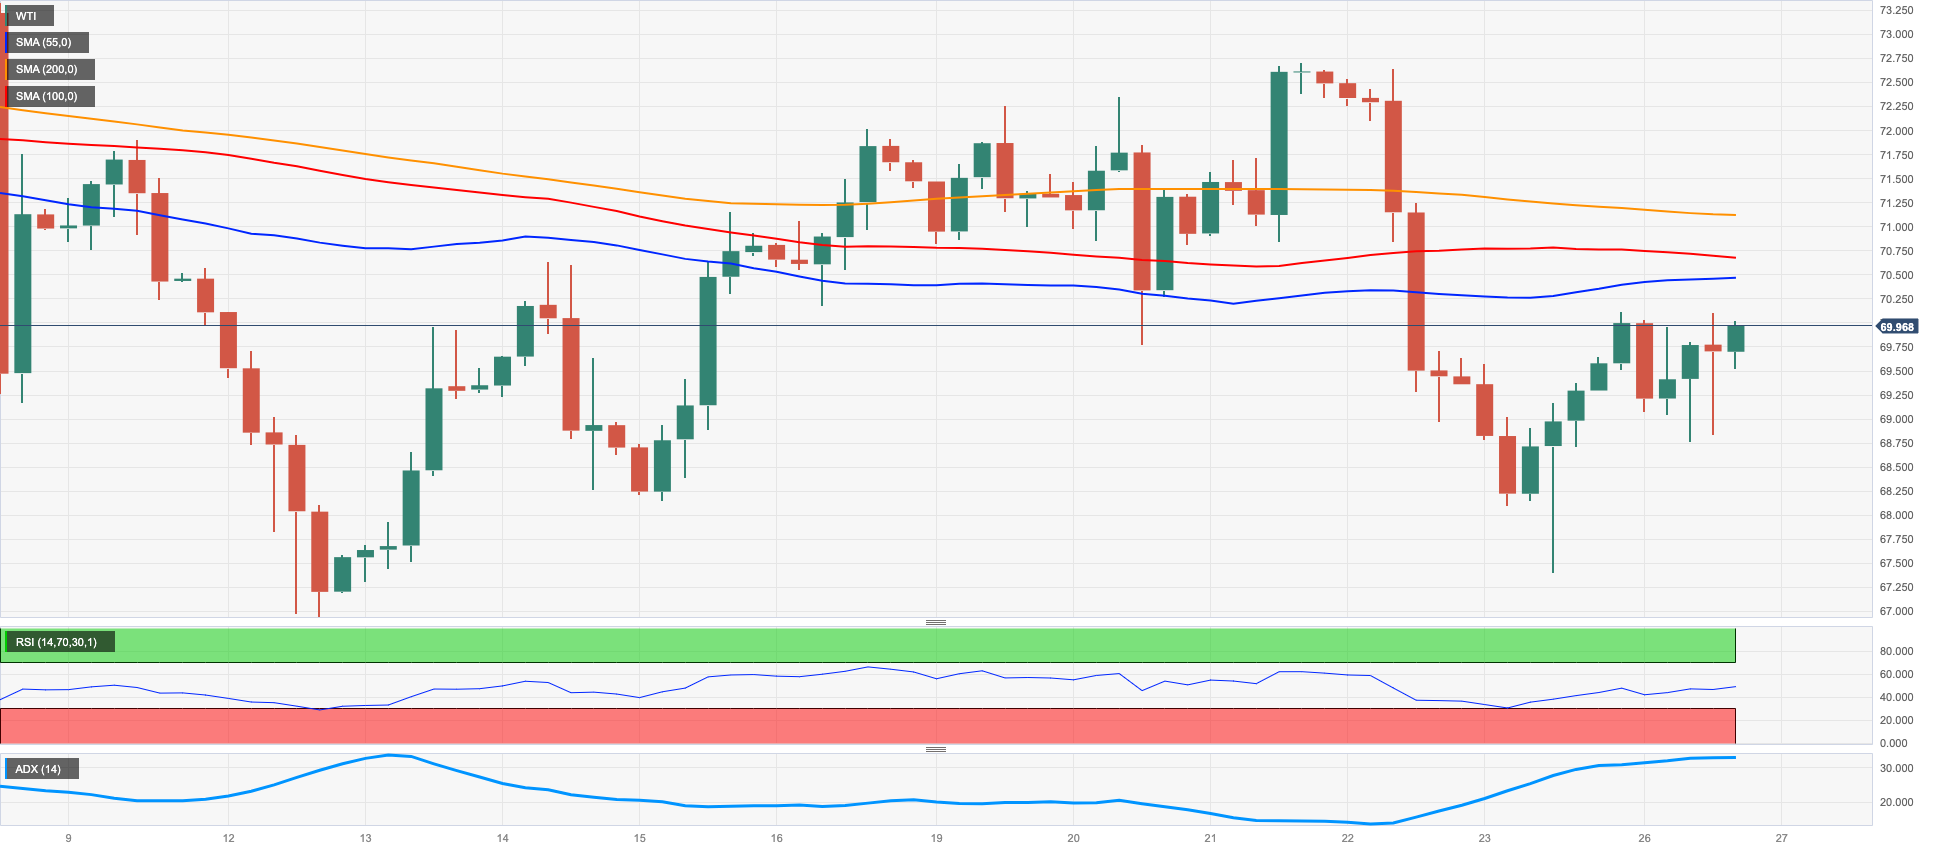
CRUDE WTI
Similar to many other assets, the price of the American benchmark for sweet light crude oil remained within a narrow range around the $70.00 neighbourhood on Monday.
The commodity's prices were closely following news and events in the political landscape of Russia. Additionally, concerns about demand persisted due to the slow recovery in China and the potential for supply disruptions in Russia, adding to the factors affecting the market at the beginning of the week.
As is customary, the American Petroleum Institute (API) and the Energy Information Administration (EIA) will release their reports on US crude oil supplies for the week ending on June 23 on Tuesday and Wednesday, respectively.
Other important events that could impact WTI prices include the ECB Forum and a speech by Chief Powell later in the week, with the ongoing debate around tightening measures taking centre stage.
Looking ahead, the immediate downside for WTI lies at the June low of $66.86 (June 13), followed by the 2023 low at $63.61 (May 4), the December 2021 low at $62.46 (December 2), and the critical level of $60.00 per barrel. On the contrary, prices have the potential to challenge the June high of $74.92 (June 5), with support from the temporary 100-day SMA at $74.23 and positioned just before the critical 200-day SMA at $77.89. Further north comes the weekly peak of $79.14 (April 24), ahead of the significant barrier of $80.00 per barrel, the 2023 high at $83.49 (April 12), and the November 2022 top of $93.73 (November 7).
Resistance levels: $70.03 $71.07 $72.68 (4H chart)
Support levels: $67.32 $66.77 $63.71 (4H chart)
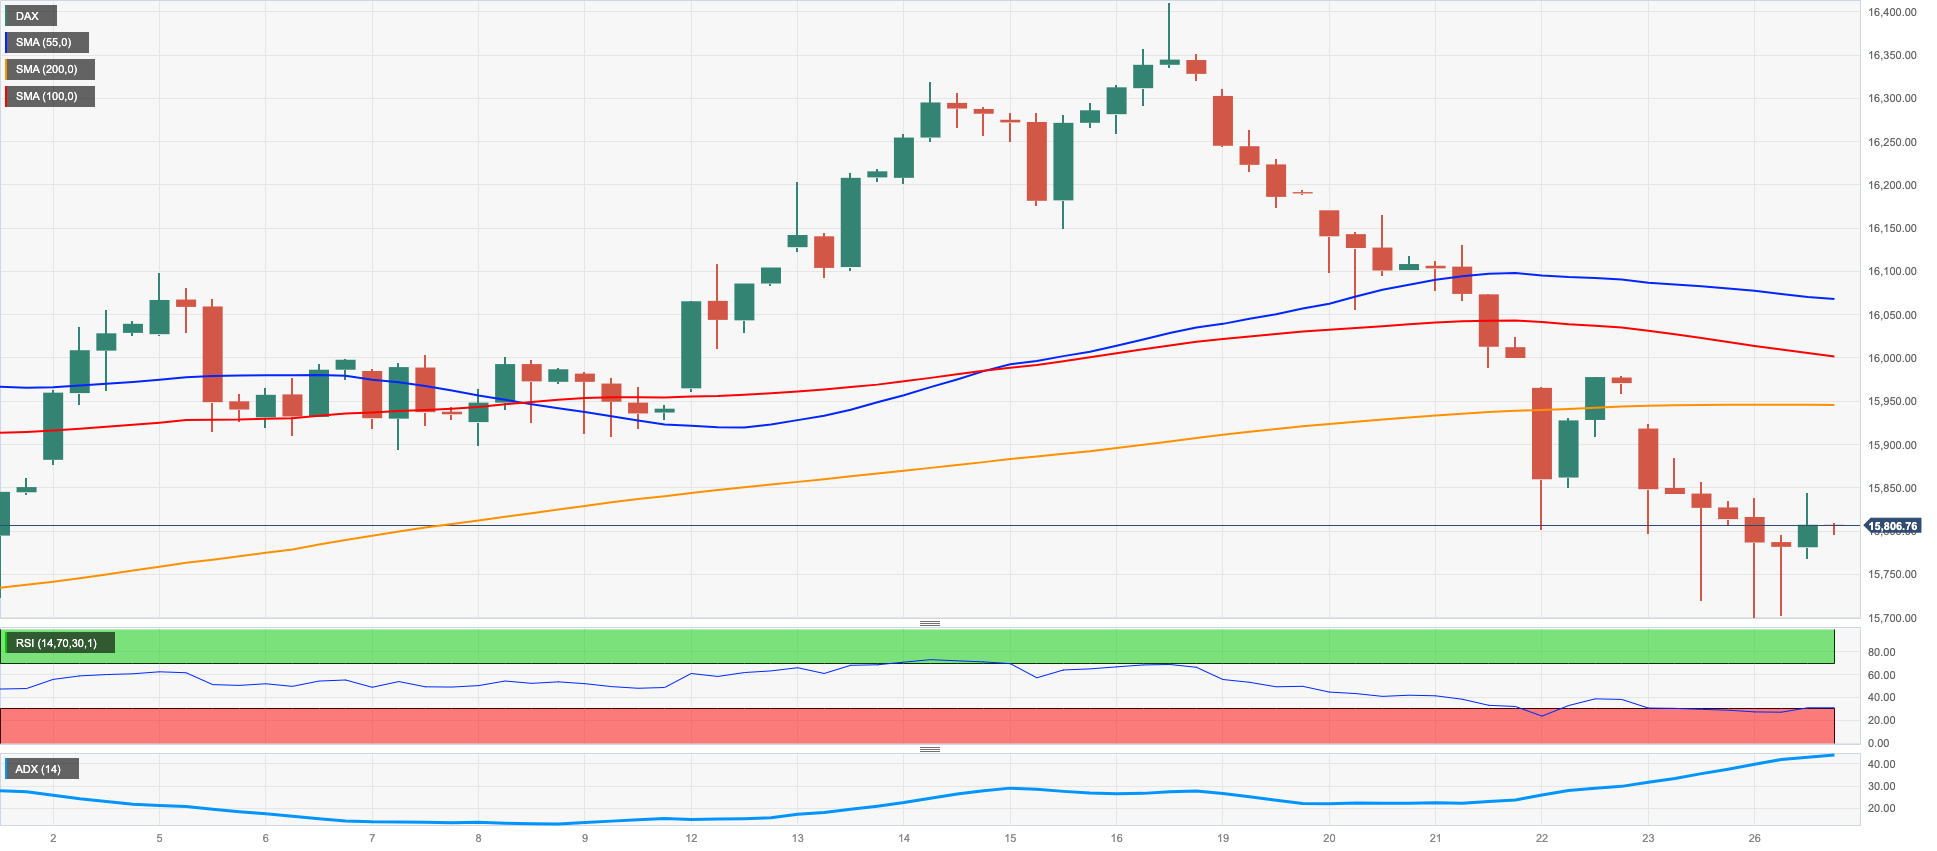
GER40
On Monday, German stocks represented by the DAX40 index experienced their sixth consecutive session of losses, trading very close to monthly lows. The main European indices closed with mixed results against the backdrop of political uncertainty in Russia after the weekend's events.
The DAX40 was further weighed down by the release of the IFO's Business Climate, which showed a lower reading for the month of June, propping up concerns of a potential recession in the largest economy of the euro area.
In the money market, the 10-year bund yields fell to multi-session lows, reaching around 2.30%.
If the current bearish trend continues, the first objective would be to reach the transitory 100-day SMA at 15671, which somewhat supports the May low of 15629 (May 31). Further losses could result in revisiting the April low of 15482 (April 5), followed by minor support at 14809 (March 24), and the significant 200-day SMA at 14728. The March low of 14458 (March 20) would be the next level. Just the opposite, the immediate target is the all-time high of 16427 (June 16). The daily RSI deflated further to the vicinity of 41.
Best Performers: Zalando SE, Daimler Truck Holding, BASF
Worst Performers: Rheinmetall, Siemens Energy AG, Fresenius SE
Resistance levels: 16046 16427 17000? (4H chart)
Support levels: 15713 15629 15482 (4H chart)
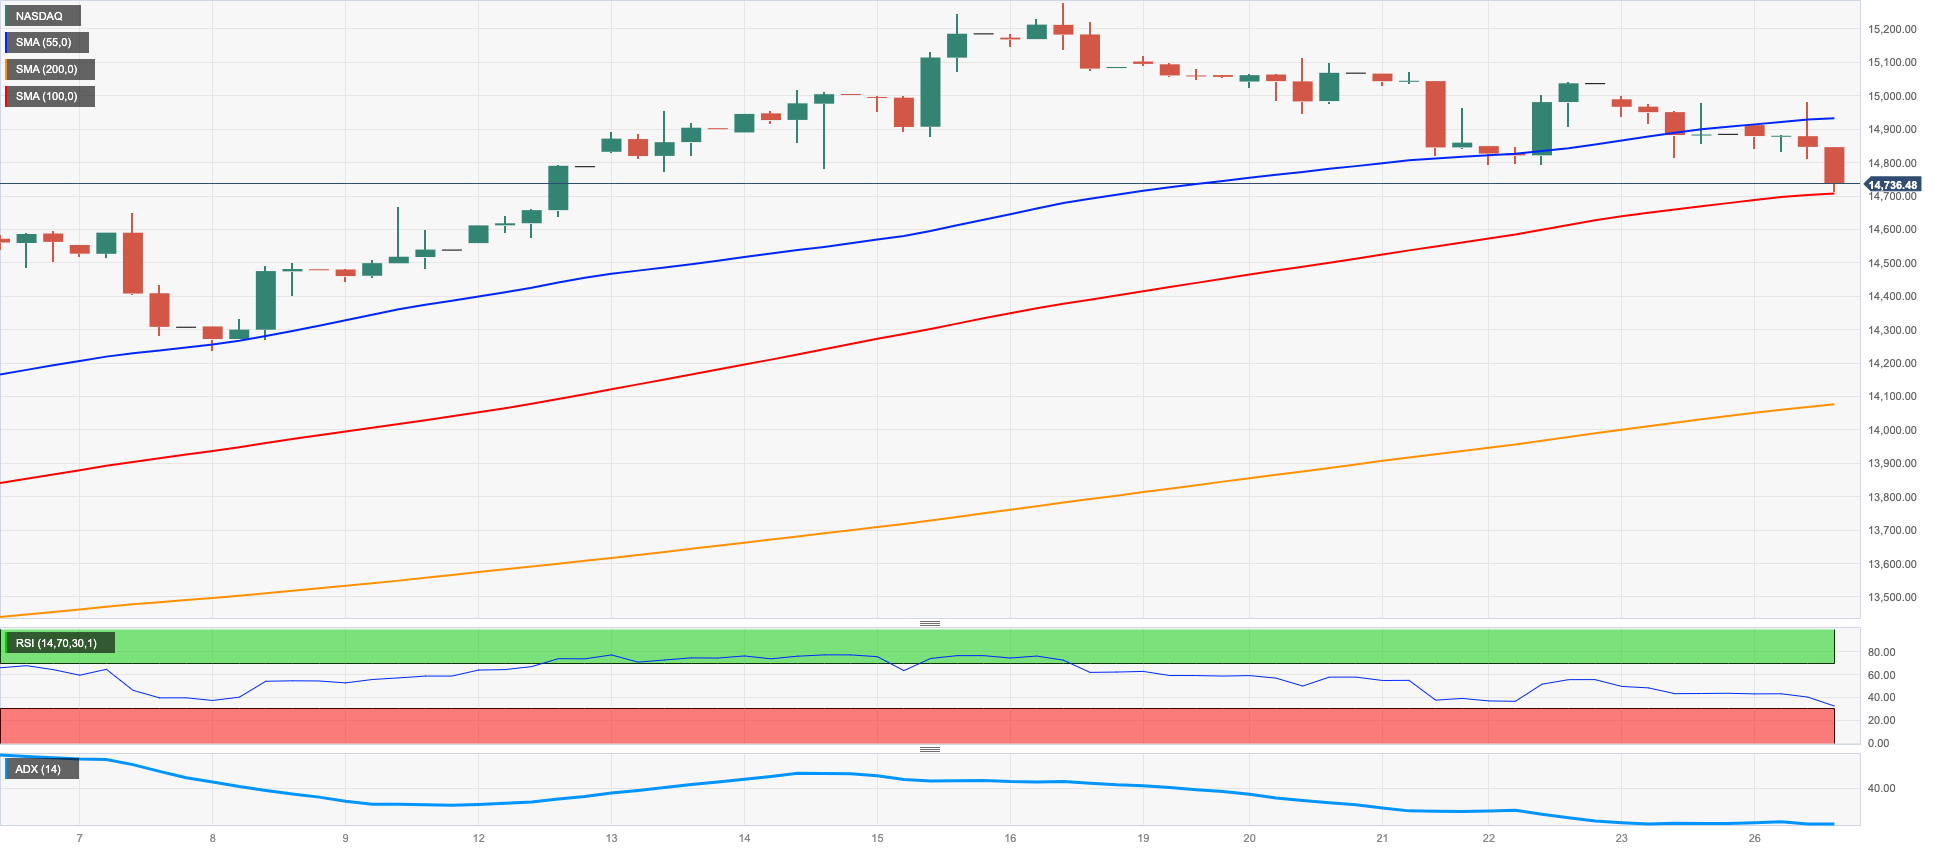
NASDAQ
US tech equities continued to face challenges and extended Friday's minor pullback, reaching new multi-session lows, on Monday.
The overall lack of momentum in global markets, combined with increasing concerns that the Federal Reserve may resume its hiking cycle in the second half of the year, weighed heavily on investor sentiment on Monday and sponsored the second daily pullback in the Nasdaq 100.
In case the selling pressure gains momentum, the Nasdaq 100 is expected to face an initial support at the weekly low of 14283 (June 7) prior to the provisional 55-day SMA at 13772, which is closely followed by the weekly low of 13520 (May 24). A deeper pullback could revisit the May low of 12938 (May 4) seconded by the April low of 12724 (April 25), the 200-day SMA at 12311, and the March low of 11695 (March 13). On the upside, the immediate hurdle comes at the 2023 high of 15284 (June 16), followed by the round level of 16000. The daily RSI breached the 59 zone.
Top Gainers: Lucid Group, GlobalFoundries, Qualcomm
Top Losers: MercadoLibre, Tesla, NVIDIA
Resistance levels: 15284 16017 16607 (4H chart)
Support levels: 14713 14407 13520 (4H chart)
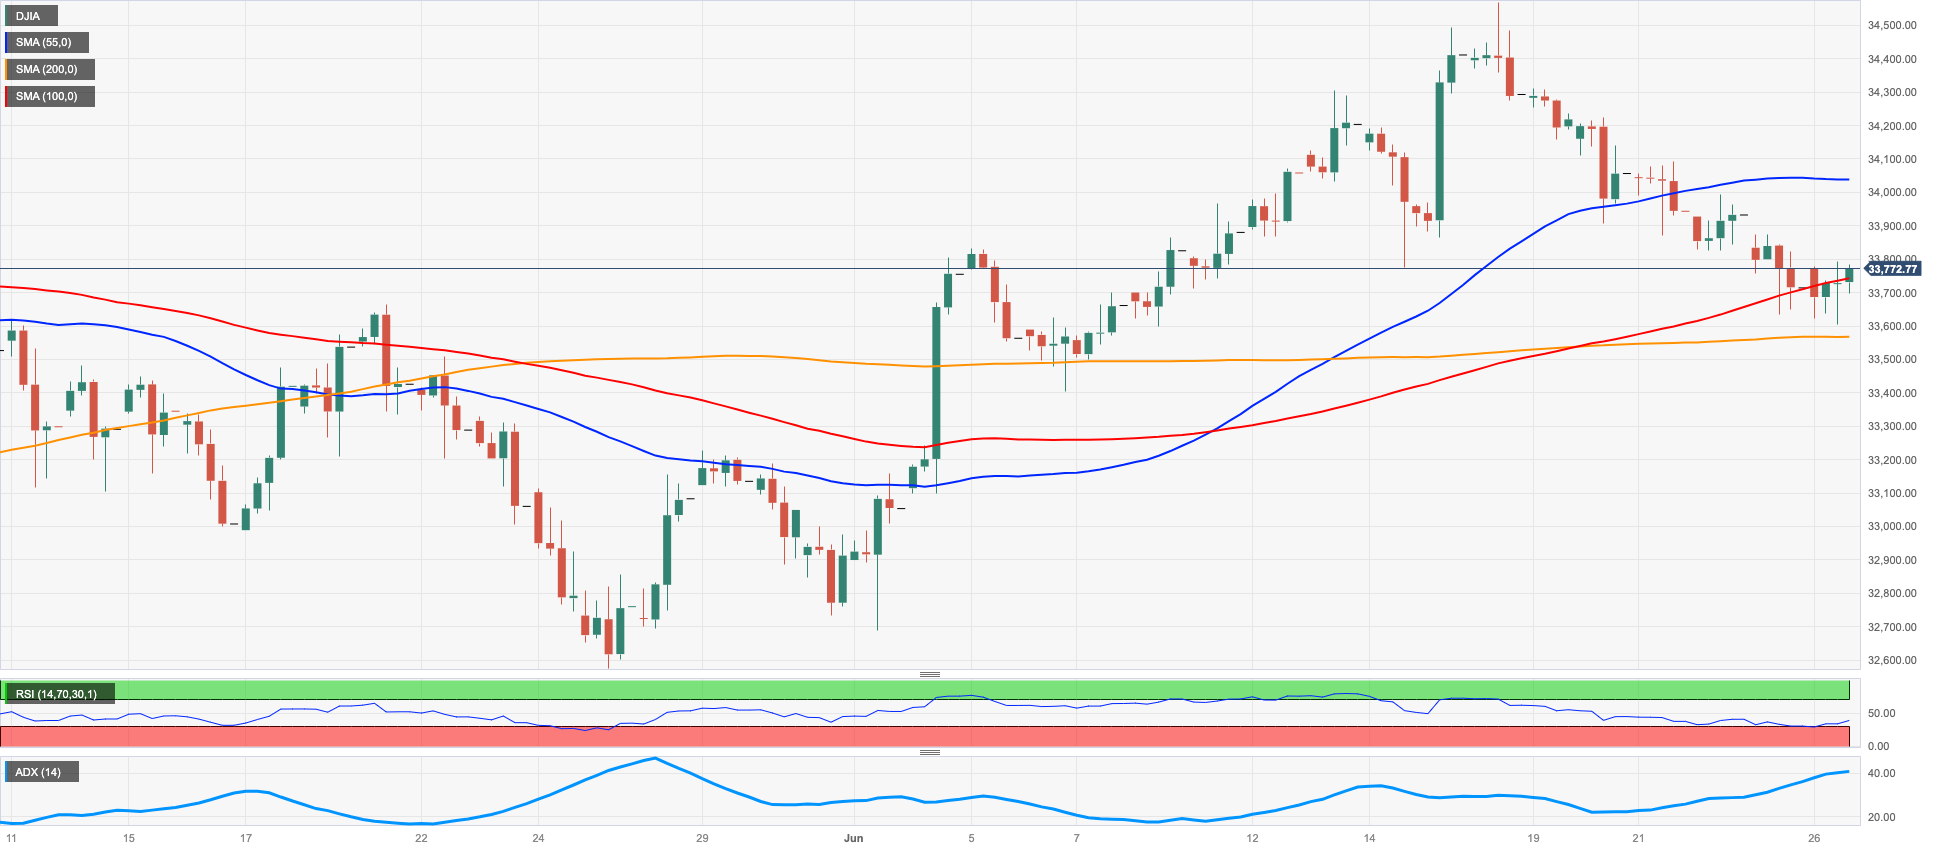
DOW JONES
On Monday, US markets experienced volatility as investors continued to evaluate the possibility of further tightening by the Federal Reserve and other major central banks in the near to medium term.
Speculation of an economic slowdown further dampened buying interest at the beginning of the week. Despite political unrest in Russia, it did not have any impact on stocks as market participants remained focused on the monetary policy front, with particular attention on the ECB Forum on Central Banking (June 26-28) and Chief Powell's speech on Wednesday.
The Dow Jones gained 0.11% to 33763, while the S&P 500 dropped 0.19% to 4339 and the Nasdaq Composite decreased 0.81% to 13383.
In terms of technical analysis, further losses in the Dow are expected to encounter initial interim contention at the 100-day SMAs at 33360, before reaching the important 200-day SMA at 32869. Further down the line, the May low of 32586 (May 25), the March 2023 low of 31429 (March 15), and the 2022 low of 28660 (October 13) are potential support levels. On the other hand, the next significant resistance level is at the 2023 peak of 34588 (June 16), prior to the high from December 2022 at 34712 (December 13) and the April 2022 top at 35492 (April 21). The daily RSI ticked higher to the boundaries of 51.
Top Performers: Nike, Chevron, Home Depot
Worst Performers: Microsoft, Merck&Co, Visa A
Resistance levels: 34588 34712 35492 (4H chart)
Support levels: 33610 33355 32586 (4H chart)
MACROECONOMIC EVENTS

All Information & Updates provided by:

All information relating to the financial markets available on this page has been prepared and issued by FXStreet (Forexstreet SL, Spain, Reg: B62498233) on the basis of publicly available information and all information believed to be reliable and does not conflict with Kuwaiti local laws, and all necessary care has been taken to before the company to ensure that the facts mentioned are correct from the source.
NCM Investment nor any of its directors or employees shall in any way be held responsible for the contents of this news, and the information contained on this page is intended only to provide clients with publicly available information and should not be construed as investment advice, report or analysis and/or constitute an offer or invitation to buy or sell financial instruments of any kind.
RISK WARNING: Forex and CFDs are highly risky leveraged products, as losses can exceed deposits. Please ensure you understand all the risks and take independent advice if necessary. NCM will segregate the clients based on the criteria of the regulator and its bylaws. NCM does not provide any advisory service; the material published does not constitute advice or a recommendation for a transaction in any financial instrument. NCM accepts no responsibility for any use of the content presented and any consequences of that use. Anyone acting on the information provided does so at their own risk.