
- Contact Us:
-

-

-

-


Daily Market Updates
28 Jun 2023
USDJPY
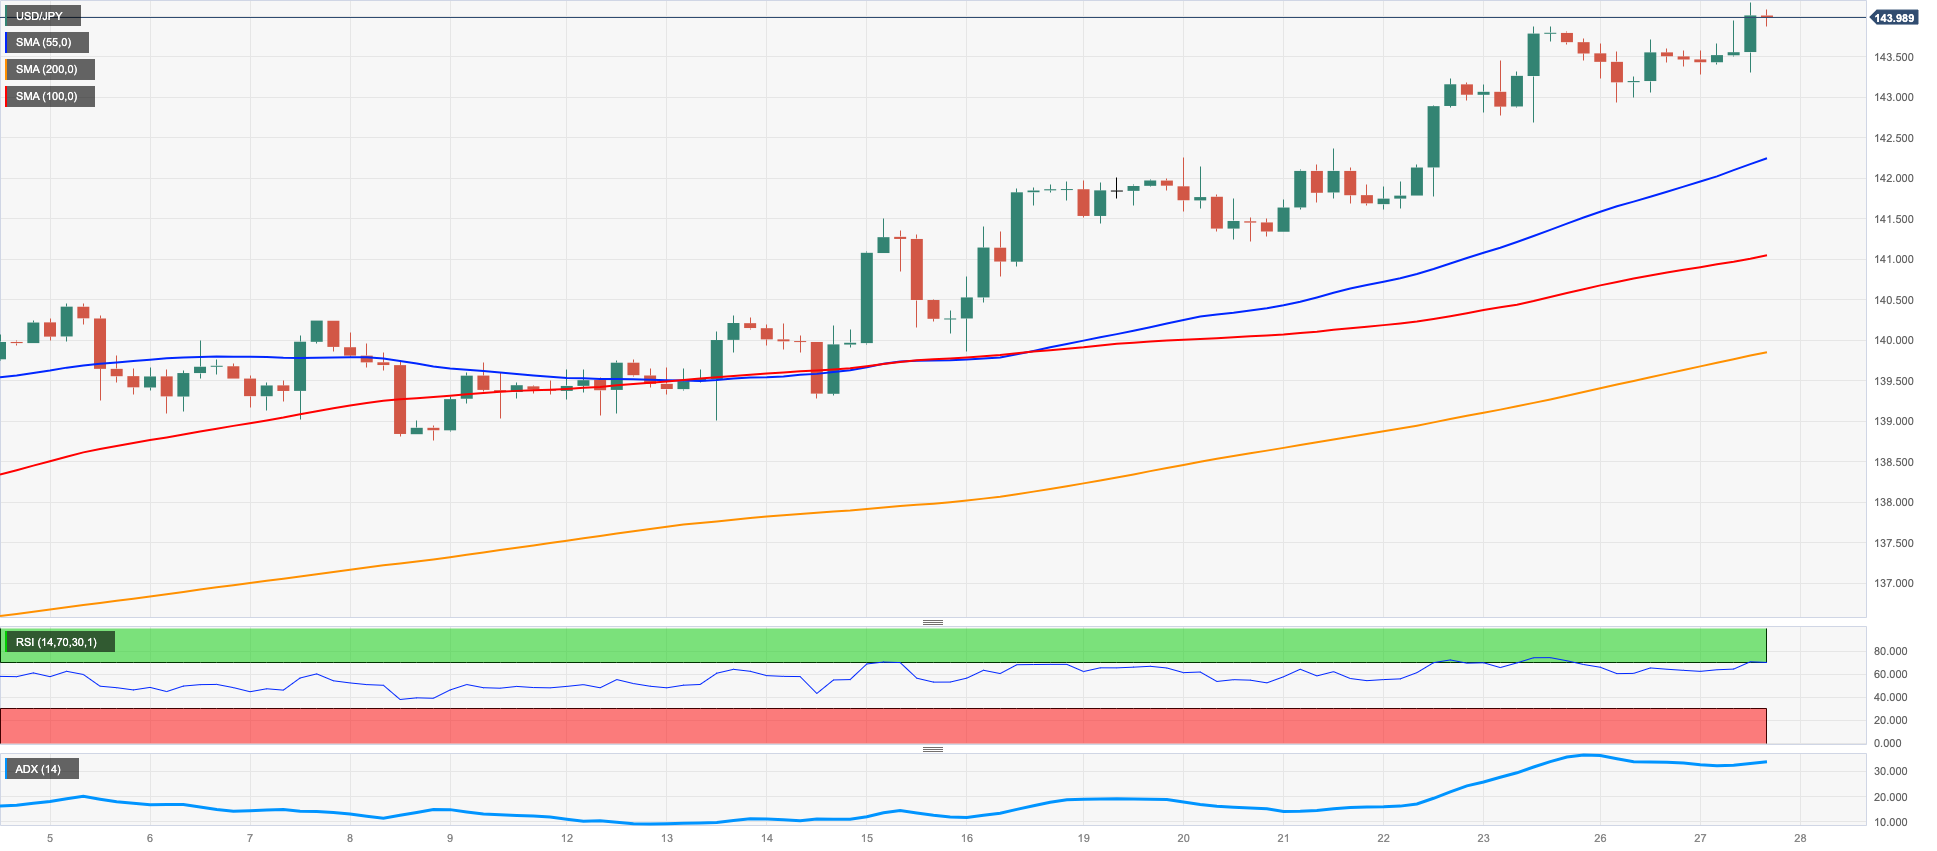
On Tuesday, USD/JPY overcame its initial negative sentiment and reversed the minor decline seen on Monday. The pair even reached new 2023 highs, surpassing the significant hurdle at 144.00.
Despite another negative session for the US dollar, the improvement in US yields in the belly and long end of the curve contributed to the upside bias. Moreover, the overall positive sentiment in the risk universe also put selling pressure on the Japanese currency, despite concerns of a potential recession amidst expected extra tightening from major central banks.
No data releases were scheduled in Japan on Tuesday.
The outlook for USD/JPY looks (very) positive, with key resistance levels at the 2023 high of 143.94 (June 27), followed by the top from October 2022 at 151.94 (October 22), and the psychological level of 152.00. On the downside, immediate contention emerges at the June low of 138.42 (June 1), followed by the crucial 200-day SMA at 137.20, and additional support levels at the provisional 100-day SMA of 135.86, the weekly low of 133.01 (April 26), and minor support at 132.01 (April 13). South of this level, the April low of 130.62 (April 5) is followed by the key level of 130.00 and the March low of 129.63 (March 24), which precedes the February low of 128.08 (February 8). The daily RSI advanced further into the overbought territory past 73.
Resistance levels: 144.17 146.79 148.45 (4H chart)
Support levels: 142.64 141.21 139.85 (4H chart)
GBPUSD
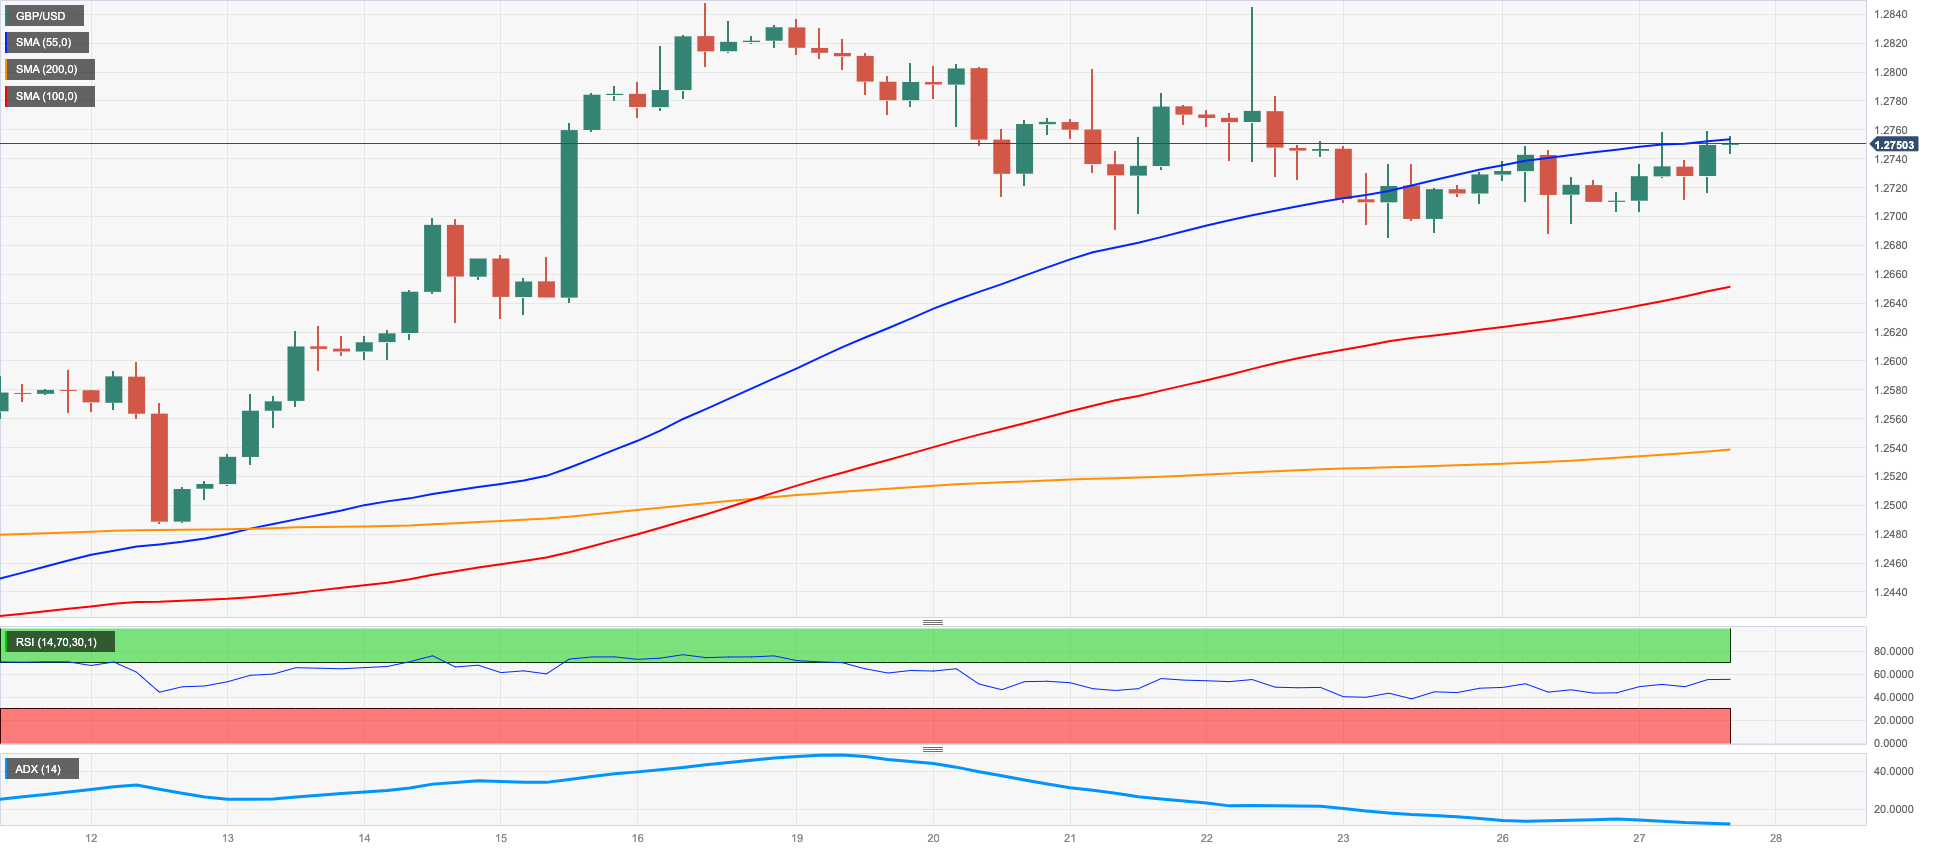
On Tuesday, GBP/USD successfully moved past the bearish trend that had been observed in the latter half of the month and confidently regained the 1.2700 resistance level.
Investors' inclination towards riskier assets played a significant role in driving the British pound higher and supporting its daily recovery. As a result, GBP/USD surged back to the vicinity of its three-day highs, around 1.2760.
Other than the positive momentum in the risk complex, a survey by Bloomberg Economics showed the BoE is expected to drive the UK into a recession by the end of the year as part of its efforts to address the highest inflation among all G7 economies.
Back at the BoE, MPC member S. Dhingra (dove) has stated that the impact of the external shock is still being felt and has not completely subsided. She also noted that wages are responding to inflation, but with a lag, adding that the core measure of inflation is not a good indicator of domestic inflation. Dhingra highlighted that there is a lag of one or two quarters between the decline in producer price inflation (PPI) and consumer price inflation (CPI), although she expressed optimism regarding the sharp drop in PPI inflation, which he considers to be promising. She also noted that despite food is the area where inflation remains most stubborn, there are promising signals that CPI inflation should ease.
There were no data releases in the UK docket on Tuesday.
Despite Tuesday’s rebound, there is still a risk of further short-term declines for GBP/USD, with several support levels identified. The first support level is around 1.2580, where the 2021-2023 trendline is located, followed by the temporary 55-day SMA at 1.2526 and the June low of 1.2368 (June 5). The transitory 100-day SMA at 1.2353 is expected to support the latter, which is then followed by the May low at 1.2308 (May 25) and the April low at 1.2274 (April 3). The crucial 200-day SMA at 1.2087 comes next. On the upside, if the pair surpasses the 2023 high of 1.2848 (June 16), it could potentially test the 200-week SMA at 1.2877 before reaching the psychological level of 1.3000. The everyday RSI ticked higher past 62.
Resistance levels: 1.2848 1.3089 1.3146 (4H chart)
Support levels: 1.2685 1.2537 1.2486 (4H chart)
AUDUSD
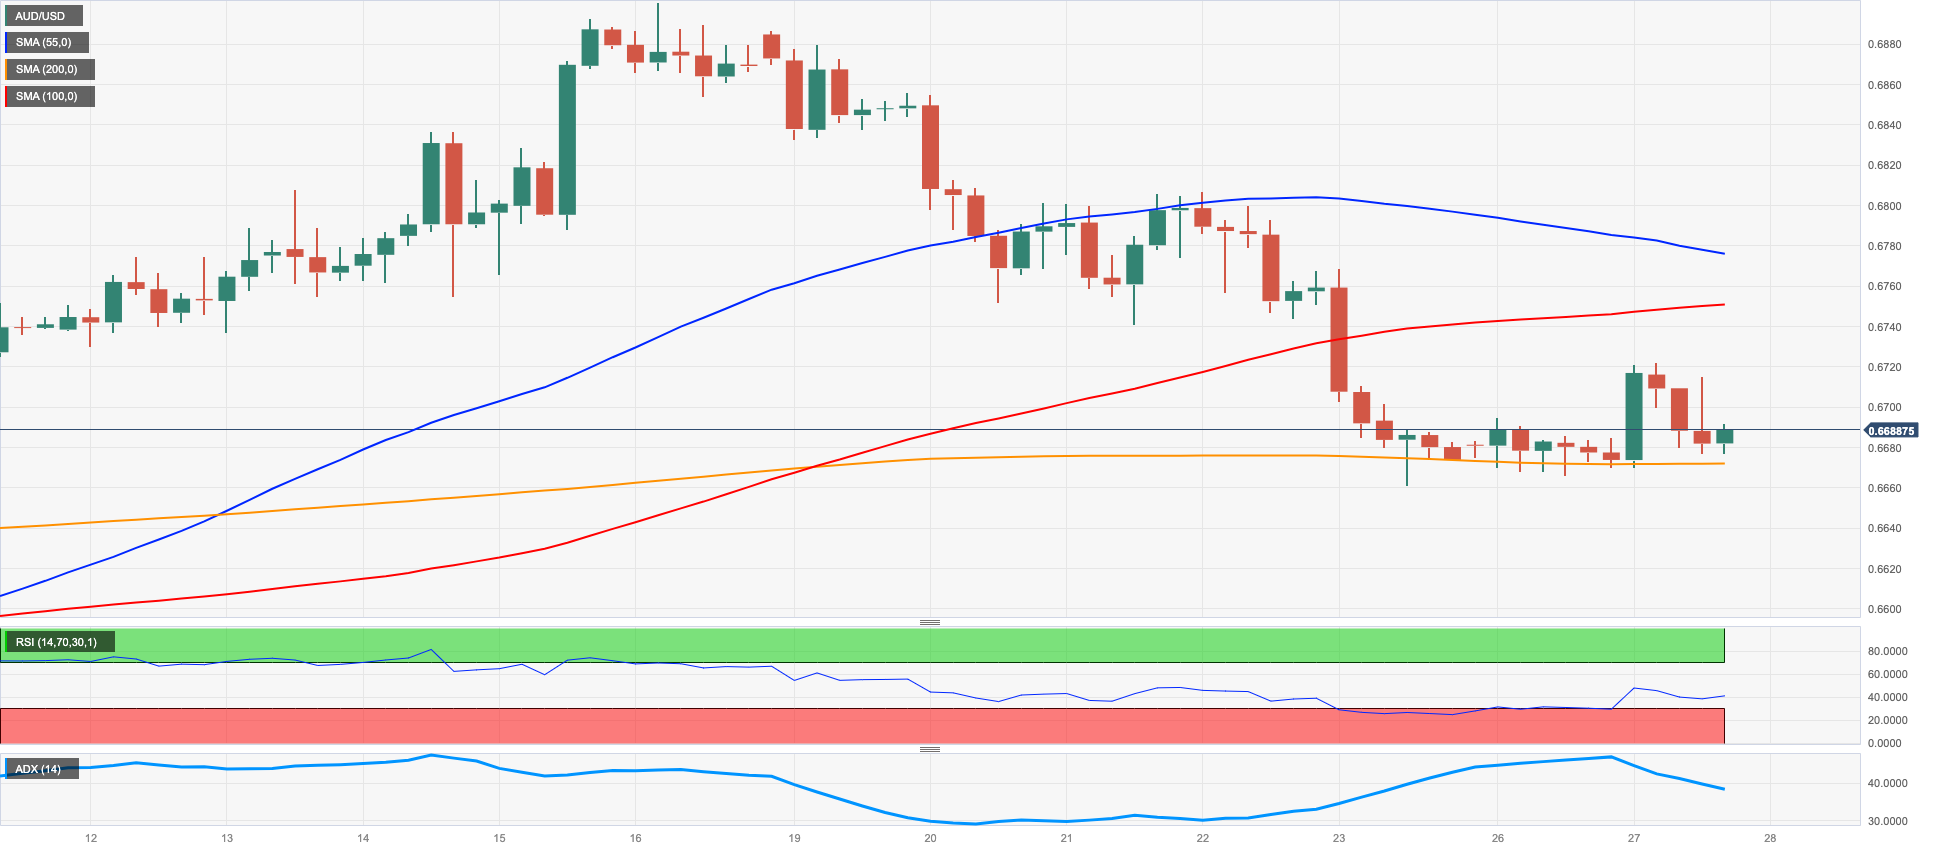
Following three consecutive sessions of losses, the Australian dollar, in line with other riskier assets, regained buying interest and supported the first daily increase in AUD/USD.
The positive sentiment surrounding the Australian dollar was supported by a decline in the greenback, while the mixed tone in the risk market resulted in copper prices continuing their retracement for the week and a slight retreat in iron ore prices. These factors limited the upside potential of the AUD/USD pair.
On Tuesday, there were no significant events or releases on the Australian economic calendar.
There is a possibility of further correction in AUD/USD. If the weekly low of 0.6662 (June 23) is breached, it is expected to pave the way for a potential deeper pullback towards the 2023 low of 0.6458 (May 31), followed by the November 2022 low at 0.6272 (November 3), and the 2022 low of 0.6169 (October 13). Instead, immediate resistance level can be found at 0.6801 (23.6% Fibo of the June rally) ahead of the June peak of 0.6899 (June 16), followed by the critical level of 0.7000, the weekly high of 0.7029 (February 14), and the 2023 peak of 0.7157 (February 2). The day-to-day RSI ticked marginally higher to the vicinity of 48.
Resistance levels: 0.6720 0.6806 0.6899 (4H chart)
Support levels: 0.6662 0.6641 0.6579 (4H chart)
GOLD
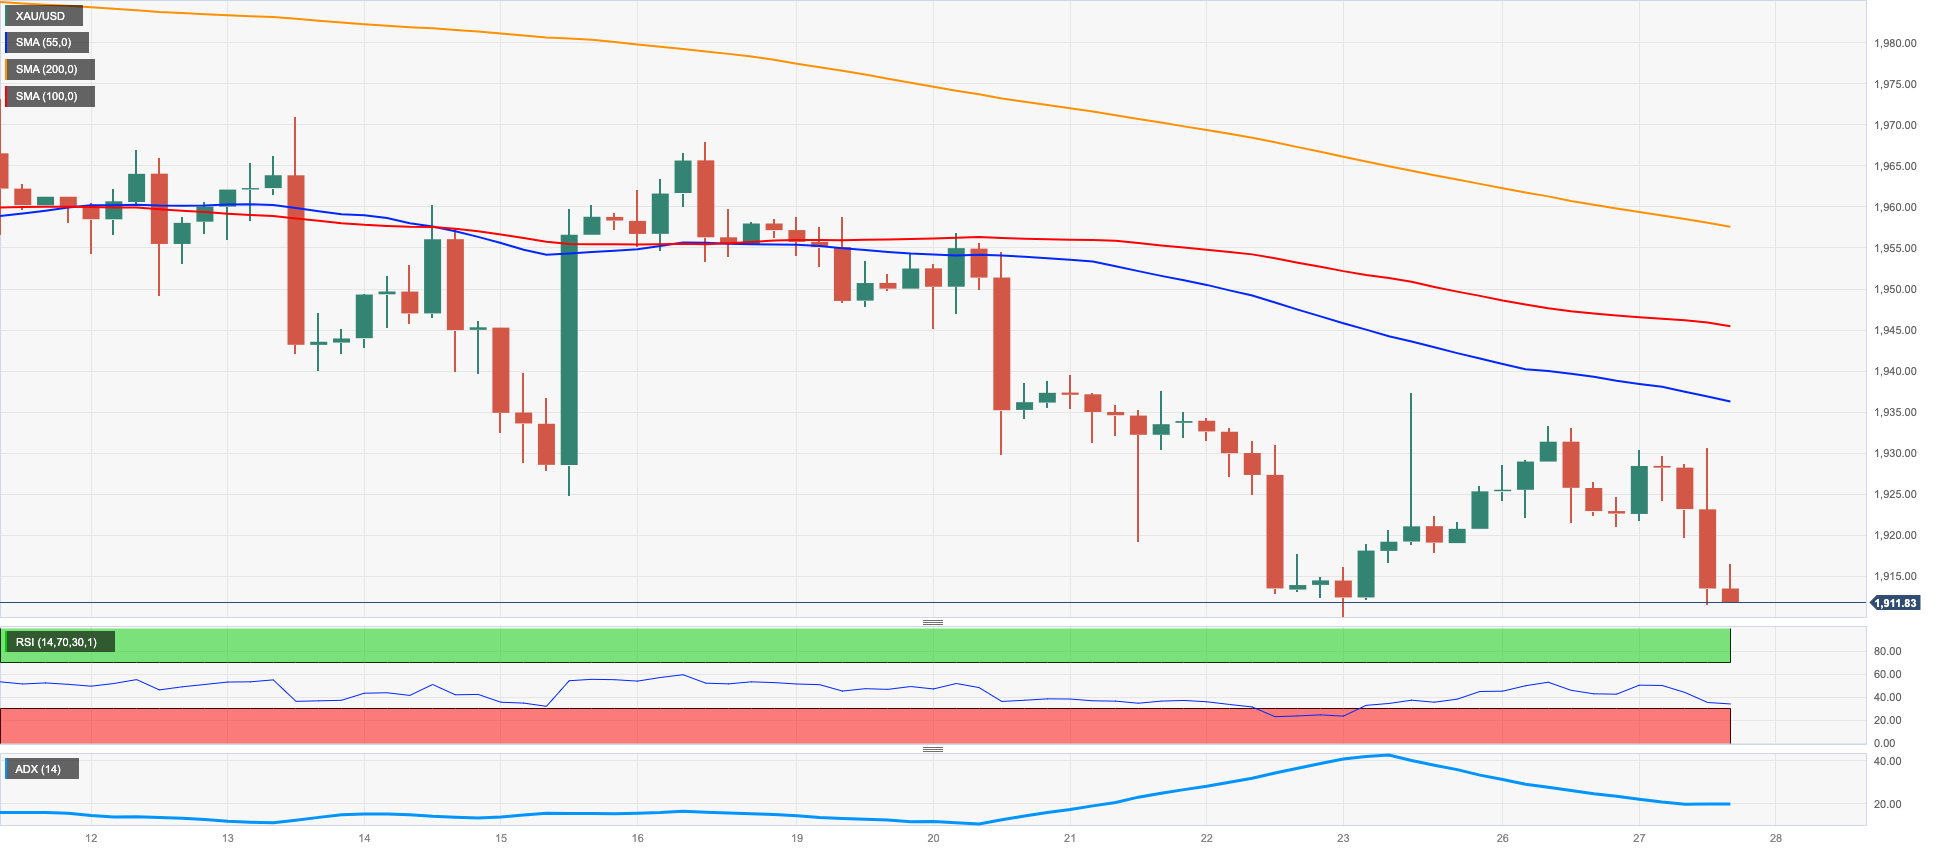
Gold prices experienced a marked decline on Tuesday and halted their two-day winning streak, briefly retesting the recent lows near $1910 per troy ounce, where decent support turned up.
Despite the softness of the dollar, the improvement in US yields across the curve, along with the current risk-on sentiment in global markets, all contributed to the depressed price action of the precious metal on turnaround Tuesday.
Furthermore, gold is closely monitoring developments around the ECB, the Fed, and other major central banks, in light of rising speculation regarding the continuation of their tightening stance in the latter half of the year.
Recently, gold broke below its consolidation range, and immediate support levels can be seen at the June low of $1910 (June 23). Further, the breach of the essential $1900 round level could trigger a potential retracement to the key 200-day SMA at $1854 ahead of the 2023 low of $1804 (February 28) and the crucial threshold of $1800 per troy ounce. On the flip side, the initial obstacle comes at the June top of $1983 (June 2), followed by the significant milestone of $2000. Up from here, there are no major resistance levels until the 2023 peak of $2067 (May 4), prior to the 2022 high of $2070 (March 8), and ultimately the all-time record of $2075 (August 7, 2020).
Resistance levels: $1937 $1959 $1983 (4H chart)
Support levels: $1910 $1885 $1809 (4H chart)
CRUDE WTI
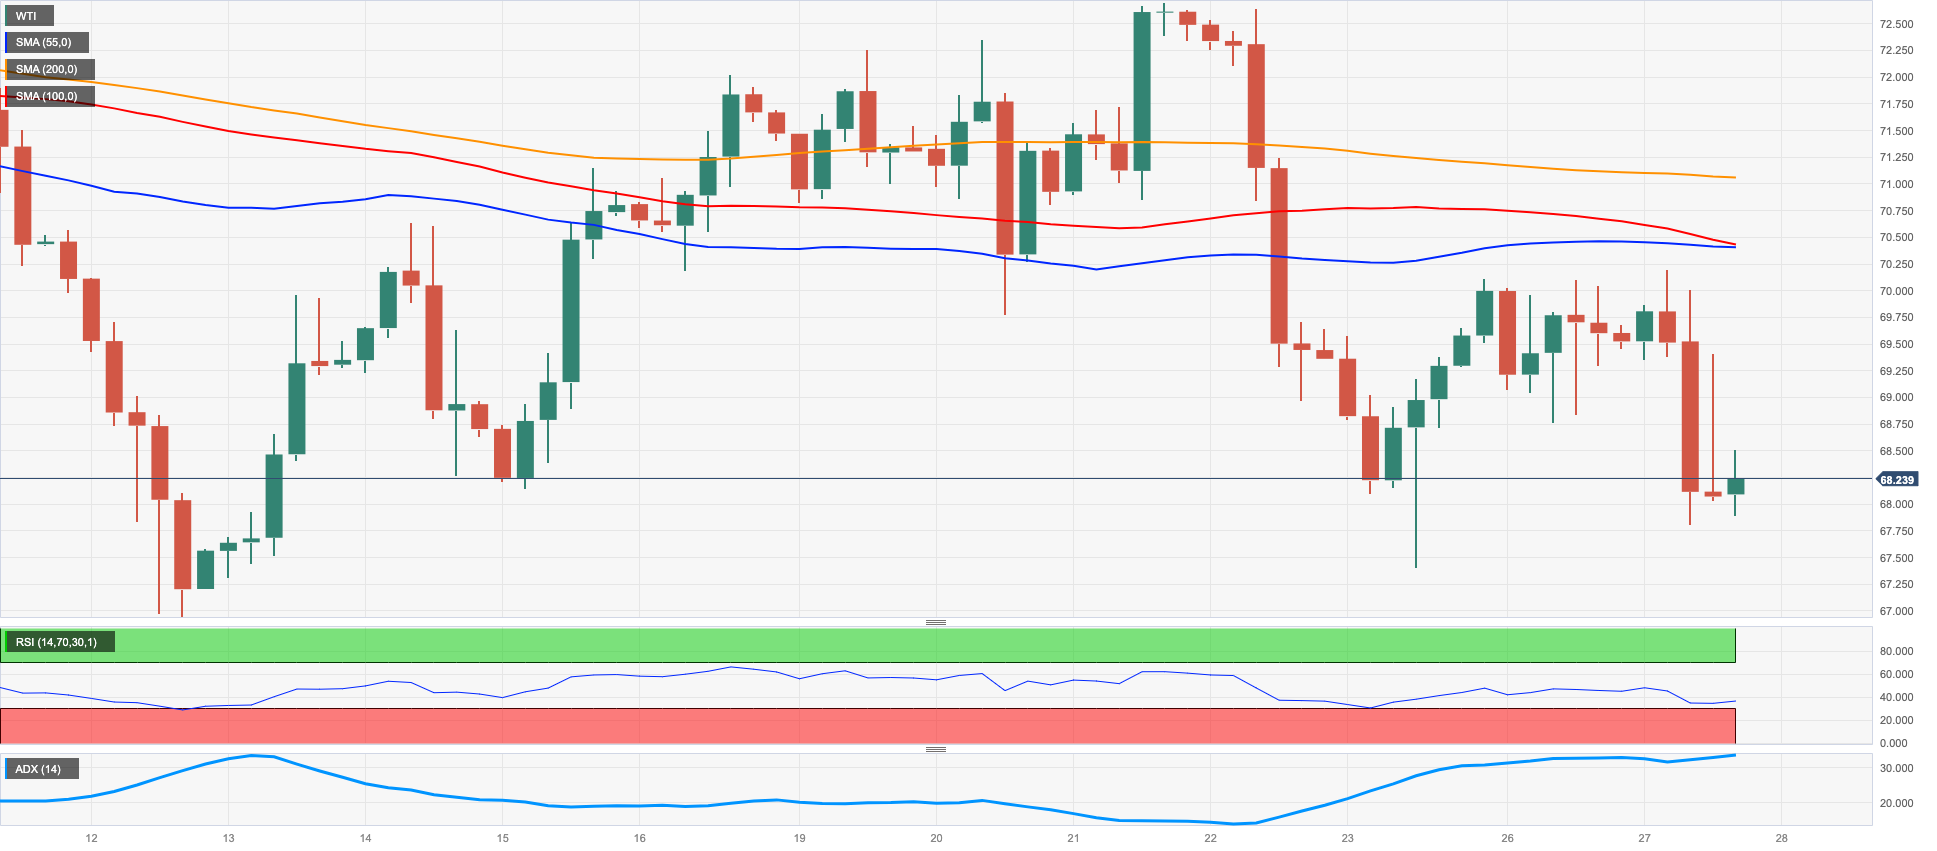
WTI prices experienced modest losses on Tuesday, revisiting the vicinity of the $68.00 mark per barrel mark and continuing their erratic performance for the week.
Traders' mood was weighed down by recession concerns in light of the anticipated continuation of the tightening cycle by the Federal Reserve, along with further rate hikes expected by the ECB and the BoE. Additionally, jitters around the economic recovery in China, expected to happen in the second half of the year, kept any bullish attempt at bay.
Later in the North American session, the American Petroleum Institute (API) will release its weekly report on US crude oil inventories, followed by the Energy Information Administration's (EIA) report on Wednesday.
Looking ahead, the immediate downside for WTI can be observed at the June low of $66.86 (June 13), followed by the 2023 low at $63.61 (May 4), the December 2021 low at $62.46 (December 2), and the crucial level of $60.00 per barrel. Conversely, prices have the potential to challenge the June high of $74.92 (June 5), with appeared reinforced by the proximity of the provisional 100-day SMA at $74.18. Further up emerges the critical 200-day SMA at $77.79 seconded by the weekly peak of $79.14 (April 24) and the significant barrier of $80.00 per barrel. The breakout of the latter exposes a move to the 2023 high of $83.49 (April 12), prior to the top from November 2022 at $93.73 (November 7).
Resistance levels: $70.11 $70.96 $72.68 (4H chart)
Support levels: $67.32 $66.77 $63.71 (4H chart)
GER40
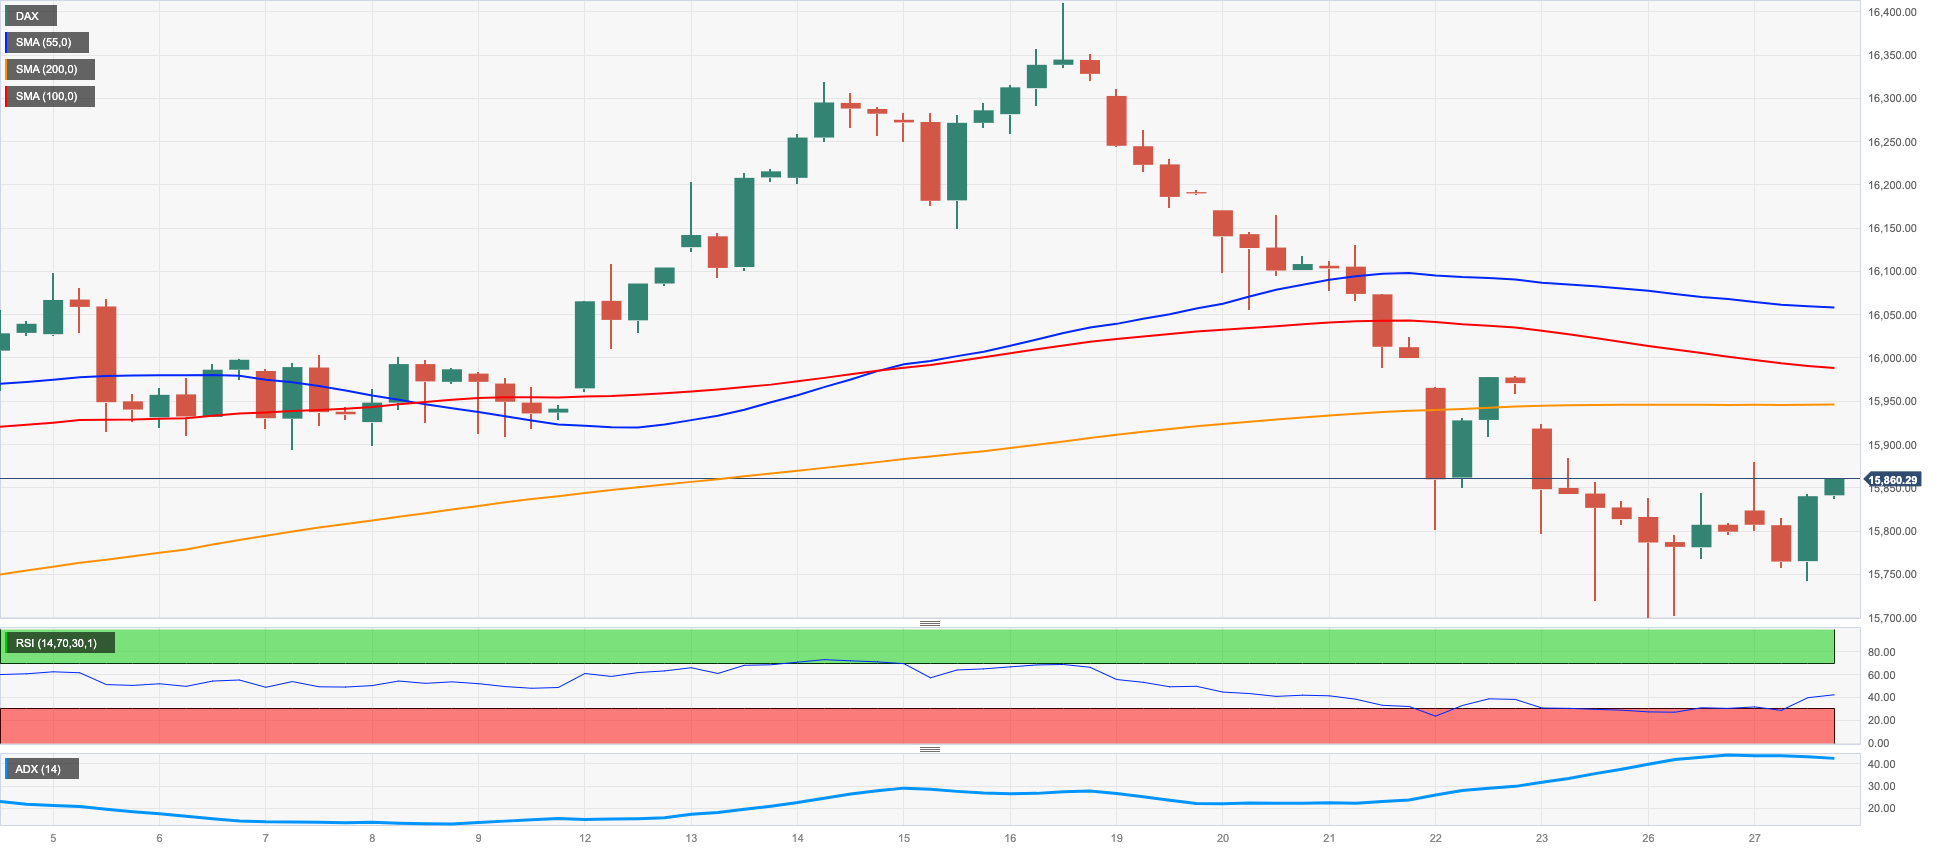
European equities finally found some relief as Tuesday's session witnessed widespread gains across the continent.
Indeed, the German benchmark DAX40 experienced modest gains but remained below the critical 16000 level.
Despite the hawkish stance expressed by ECB policymakers at the Sintra Forum, all of whom favoured additional tightening in July (and possibly September) due to persistent high inflation and growing recession risks, the index managed to rebound during the day.
In Germany, the bond market followed the lead of its US counterparts, breaking free from two consecutive sessions of losses and pushing the 10-year bund yields above the 2.35% level on Tuesday.
If sellers regain control, the first target for the DAX40 would be to reach the interim 100-day SMA at 15675, which provides some support near the May low of 15629 (May 31). Further losses may lead to a revisit of the April low at 15482 (April 5), followed by minor support at 14809 (March 24), and the significant 200-day SMA at 14742. The next level would be the March low at 14458 (March 20). On the opposite side, the immediate objective is to reach the all-time high of 16427 (June 16). The daily RSI bounced tepidly to the area above 43.
Best Performers: Zalando SE, Siemens Energy AG, Commerzbank
Worst Performers: Sartorius AG VZO, Merck, Qiagen
Resistance levels: 16049 16427 17000? (4H chart)
Support levels: 15713 15629 15482 (4H chart)
NASDAQ
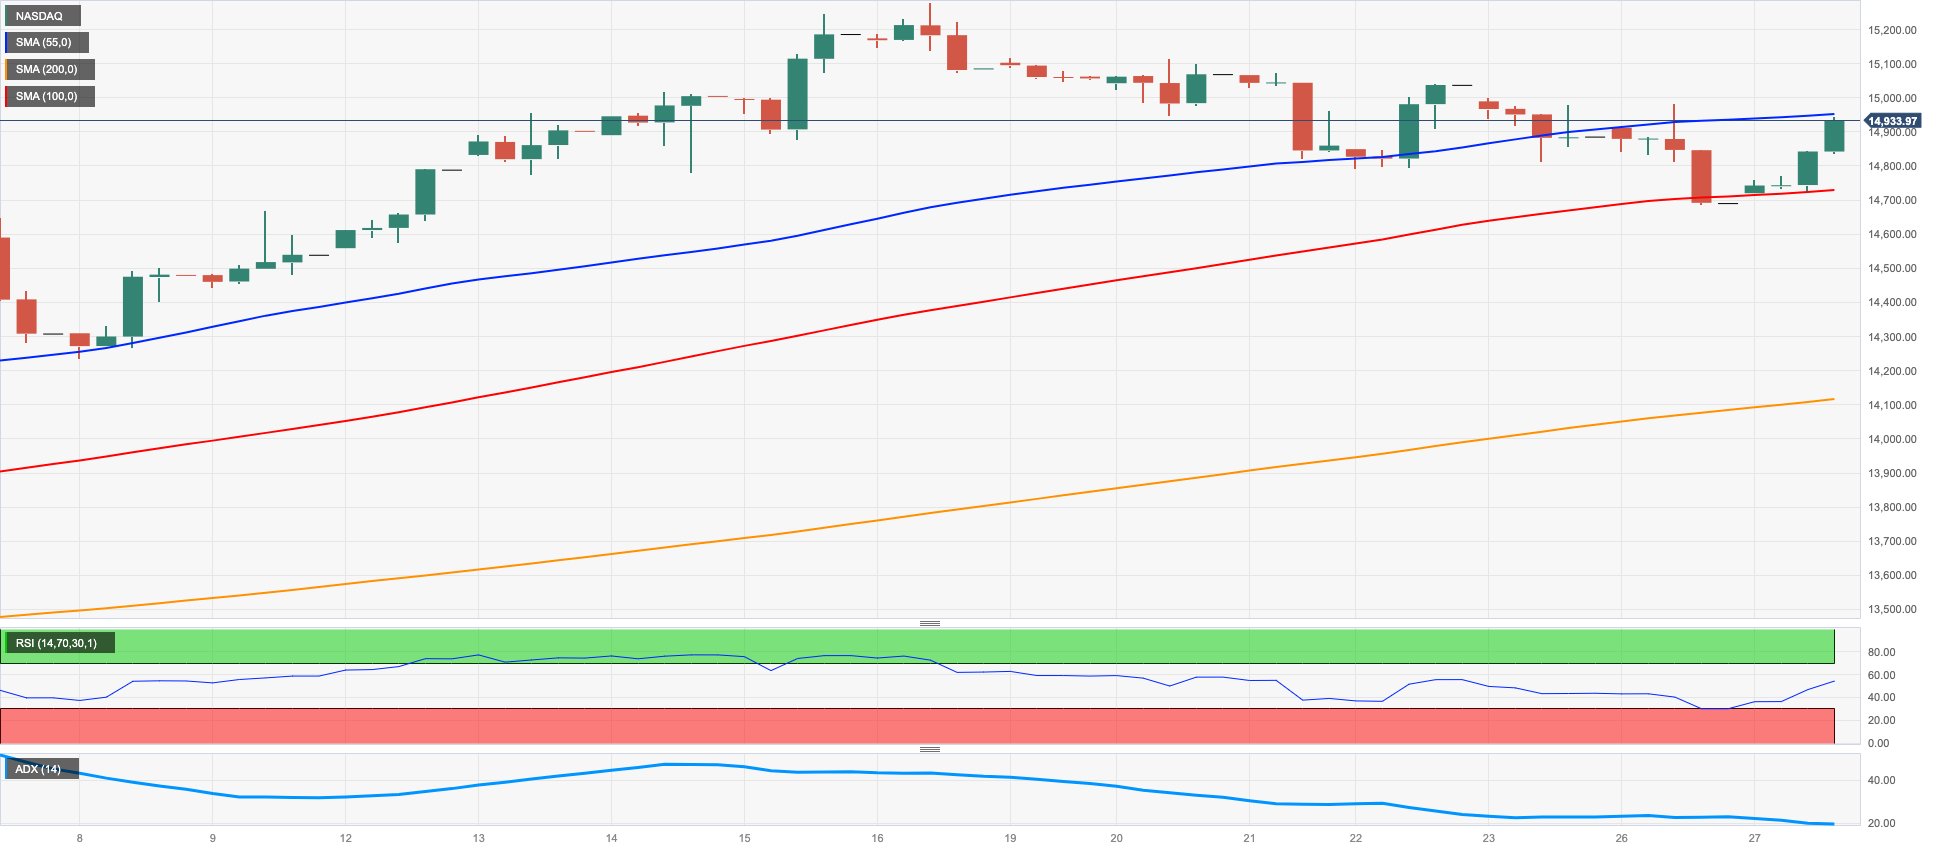
On Tuesday, US tech stocks experienced a strong rebound and approached the 15000 level when measured by the Nasdaq 100, marking a departure from two consecutive sessions of losses.
The improved investor sentiment was driven by positive results from US fundamentals, which reinforced the perception of a resilient economy. Additionally, the continued weakness of the US dollar and strong daily performances from Tesla, NVIDIA, and Meta Platforms contributed to the positive session.
In the event that bears regain the upper hand, it is expected that the Nasdaq 100 will face initial support at the weekly lows of 14687 (June 26) and14283 (June 7), followed by the temporary 55-day SMA at 13805, and then another weekly low of 13520 (May 24). A more significant pullback could revisit the May low of 12938 (May 4), followed by the April low of 12724 (April 25), the 200-day SMA at 12324, and the March low of 11695 (March 13). On the upside, the immediate hurdle is at the 2023 high of 15284 (June 16), followed by the round level of 16000. The daily RSI advanced north of the 61 hurdle.
Top Gainers: Sirius XM, Lucid Group, Old Dominion Freight Line
Top Losers: Walgreen Boots, Illumina, DexCom
Resistance levels: 15284 16017 16607 (4H chart)
Support levels: 14687 14283 13520 (4H chart)
DOW JONES
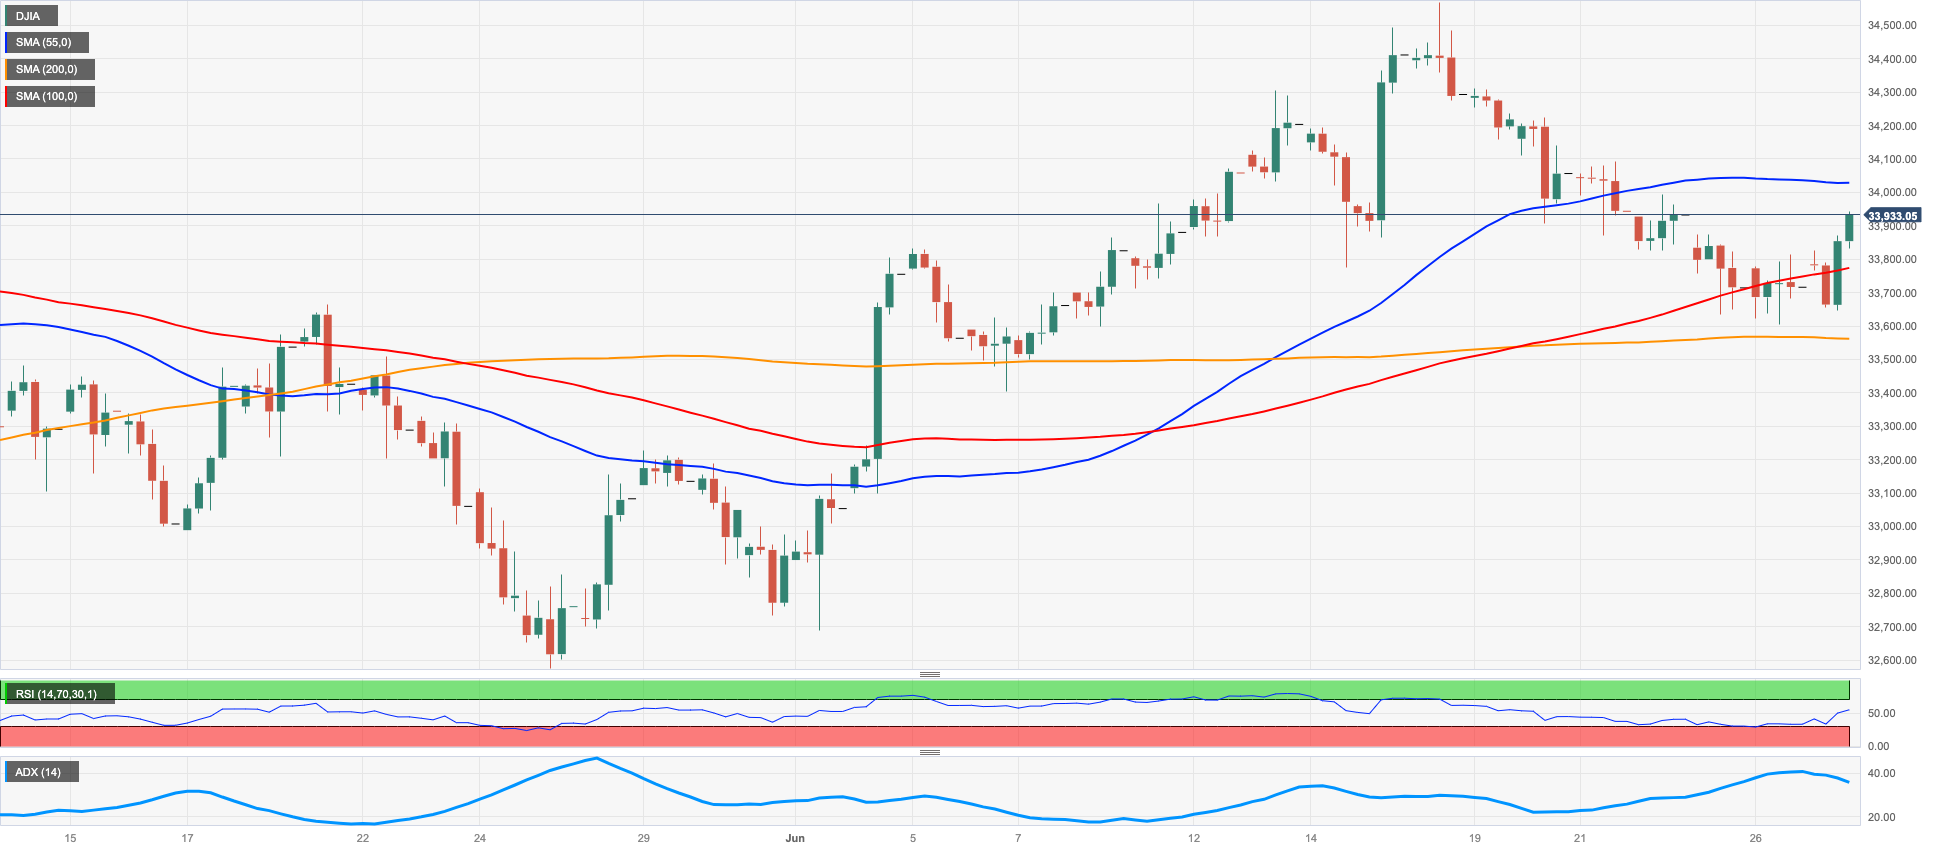
US equities received a boost on Tuesday as the Dow Jones index recorded a marked increase, breaking a six-day streak of closing in negative territory.
This uptick in the stock market was attributed to strong results from various economic indicators, including Durable Goods Orders, New Home Sales, and Consumer Confidence, which exceeded expectations and allayed concerns of an economic slowdown.
Additionally, the weaker dollar and a general interest in taking on risk also contributed to the rise in stocks.
The Dow Jones rose by 0.62% to 33923, the S&P 500 increased by 1.05% to 4,4374, and the tech-heavy Nasdaq Composite gained 1.49% to 13,534.
The Dow Jones remains under pressure. Against that, the weekly low at 33610 (June 26) emerges as an immediate contention prior to the transitory 100-day SMA at 33358, ahead of the important 200-day SMA at 32880. Further down the line, the May low of 32586 (May 25), the 2023 low of 31429 (March 15), and the 2022 low of 28660 (October 13) are potential support levels. By contrast, the next significant resistance level is at the 2023 peak of 34588 (June 16), before the high from December 2022 at 34712 (December 13) and the April 2022 top at 35492 (April 21). The daily RSI leapt past the 54 yardstick.
Top Performers: Home Depot, Nike, Intel
Worst Performers: Walgreen Boots, 3M, Chevron
Resistance levels: 34588 34712 35492 (4H chart)
Support levels: 33610 33353 32586 (4H chart)
MACROECONOMIC EVENTS

All Information & Updates provided by:

All information relating to the financial markets available on this page has been prepared and issued by FXStreet (Forexstreet SL, Spain, Reg: B62498233) on the basis of publicly available information and all information believed to be reliable and does not conflict with Kuwaiti local laws, and all necessary care has been taken to before the company to ensure that the facts mentioned are correct from the source.
NCM Investment nor any of its directors or employees shall in any way be held responsible for the contents of this news, and the information contained on this page is intended only to provide clients with publicly available information and should not be construed as investment advice, report or analysis and/or constitute an offer or invitation to buy or sell financial instruments of any kind.
RISK WARNING: Forex and CFDs are highly risky leveraged products, as losses can exceed deposits. Please ensure you understand all the risks and take independent advice if necessary. NCM will segregate the clients based on the criteria of the regulator and its bylaws. NCM does not provide any advisory service; the material published does not constitute advice or a recommendation for a transaction in any financial instrument. NCM accepts no responsibility for any use of the content presented and any consequences of that use. Anyone acting on the information provided does so at their own risk.