
- Contact Us:
-

-

-

-


Daily Market Updates
29 Jun 2023
USDJPY
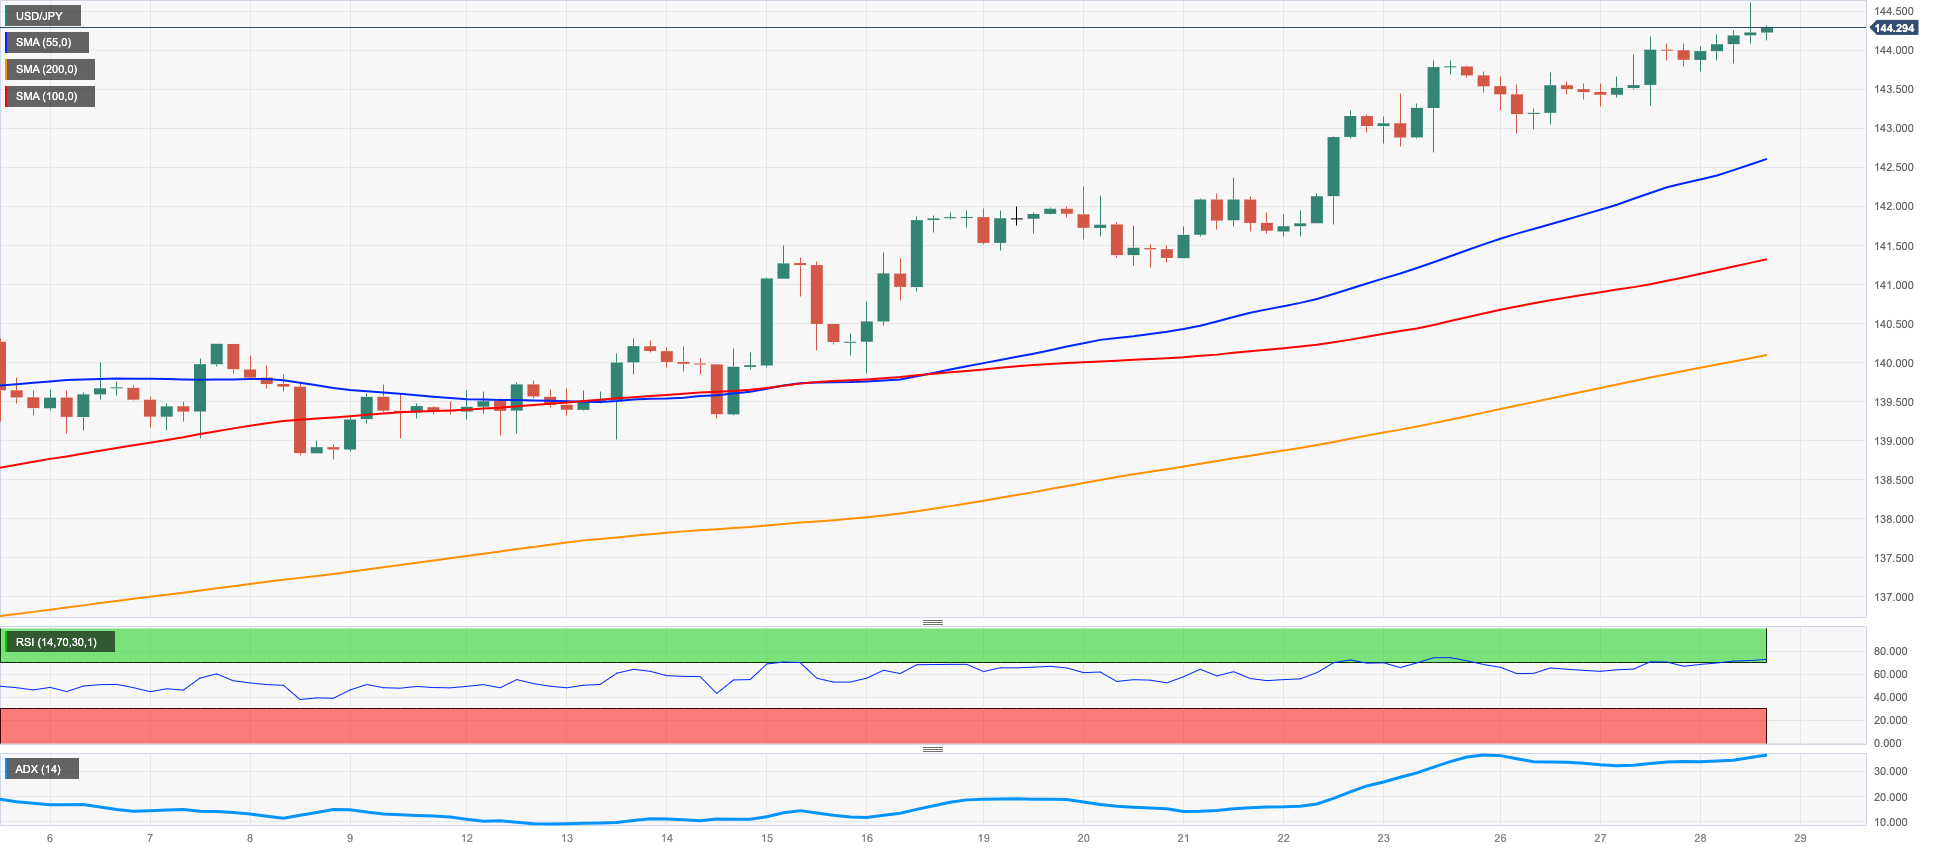
USD/JPY extended its recent breach of the 144.00 obstacle to record fresh highs in the 144.60 level, which was last traded in early November 2022.
The greenback's recovery, along with the growing monetary policy divergence between the Fed and the BoJ, fueled the daily advance in spot.
In a discussion panel on monetary policy at the ECB Forum on Central Banking, BoJ K. Ueda reiterated that underlying inflation was below the target. However, wage inflation consistent with the inflation target was well above 2%. He also mentioned that if they become reasonably sure about the second part of the inflation forecast, it would be a good reason for reconsidering a policy change. It was reported that the economy was expected to expand slightly above potential for some time. Additionally, he noted that they were seeing signs of inflation expectations rising, but they were not fully in line with the target. Finally, he expressed concern that the tensions between China and the US could bring supply-chain inefficiencies.
Earlier in the session and considering the recent sharp depreciation of the Japanese yen, Japan's Finance Minister Suzuki said that there were one-sided movements observed in the current FX market and that the government would respond appropriately to any excessive FX moves if necessary.
Adding to the above, Japan's top currency diplomat, Kanda, stated that he was keeping an eye on the FX space with a keen sense of urgency and would react appropriately to excessive moves.
The outlook for USD/JPY remains positive. Key resistance levels were identified, starting with the 2023 high of 144.61 (June 28), followed by the top from October 2022 at 151.94 (October 22), and the psychological level of 152.00. On the downside, immediate contention was observed at the June low of 138.42 (June 1), with further support levels at the temporary 55-day SMA at 137.96 ahead of the crucial 200-day SMA of 137.20. Further down emerges the interim 100-day SMA of 135.99 prior to the weekly low of 133.01 (April 26), and the minor support at 132.01 (April 13). Below this level, the April low of 130.62 (April 5) was identified before the key level of 130.00. The daily RSI remained in the overbought territory beyond 74.
Resistance levels: 144.61 146.79 148.45 (4H chart)
Support levels: 142.64 141.21 139.92 (4H chart)
GBPUSD
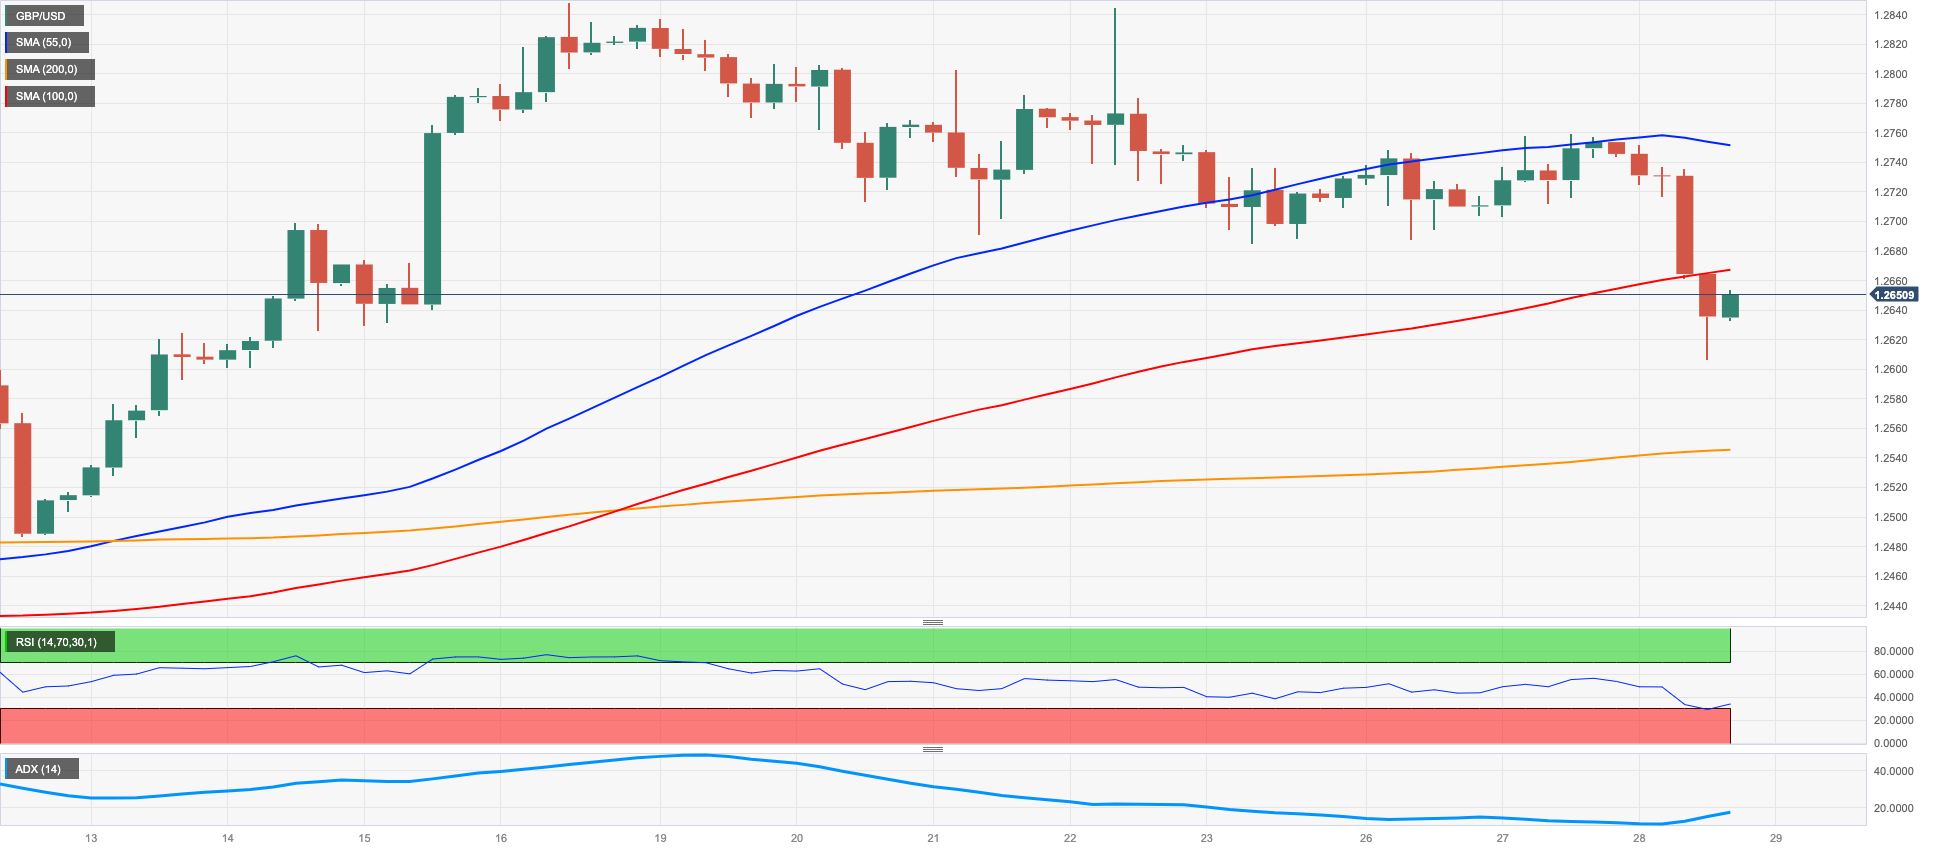
The greenback's late and robust comeback on Wednesday put the previous risk complex exuberance to rest, forcing GBP/USD to drop to multi-session lows around the 1.2600 region on Wednesday.
Indeed, the dollar’s daily uptick regained extra impulse in the wake of the central bankers’ gathering at the ECB Forum in Sintra (Portugal), where BoE Governor A. Bailey stated that the economy had turned out to be much more resilient, adding that the data had shown clear signs of the persistence of inflation, and that they would do what was necessary to meet the inflation target. Additionally, it was reported that headline inflation was expected to come down markedly in 2023, while core inflation in the UK was much stickier. Furthermore, Bailey expressed interest in the fact that markets were expecting a short-lived rates peak, while noted that the balance sheet reduction had gone very smoothly so far.
Earlier in the session, BoE’s Chief Economist H. Pill argued that forecasts might not be reliable predictors of the outlook, adding that in a tight labor market, second-round effects become more pronounced.
Although there was a rebound on Tuesday, GBP/USD still faces the possibility of further short-term declines, as several support levels have been identified. One of the first support levels is located at the weekly low of 1.2606 (June 28) prior to the 1.2580 region, where the 2021-2023 trendline can be found. This is followed by the transitory 55-day SMA at 1.2529 and the June low of 1.2368 (June 5). The interim 100-day SMA at 1.2366 is expected to provide support for the latter, and this is then followed by the May low at 1.2308 (May 25) and the April low at 1.2274 (April 3). The crucial 200-day SMA at 1.2094 comes next. On the other hand, if the pair manages to surpass the 2023 high of 1.2848 (June 16), it could potentially test the 200-week SMA at 1.2876 before reaching the psychological level of 1.3000. The everyday RSI dropped below 52.
Resistance levels: 1.2751 1.2848 1.3089 (4H chart)
Support levels: 1.2606 1.2542 1.2486 (4H chart)
AUDUSD
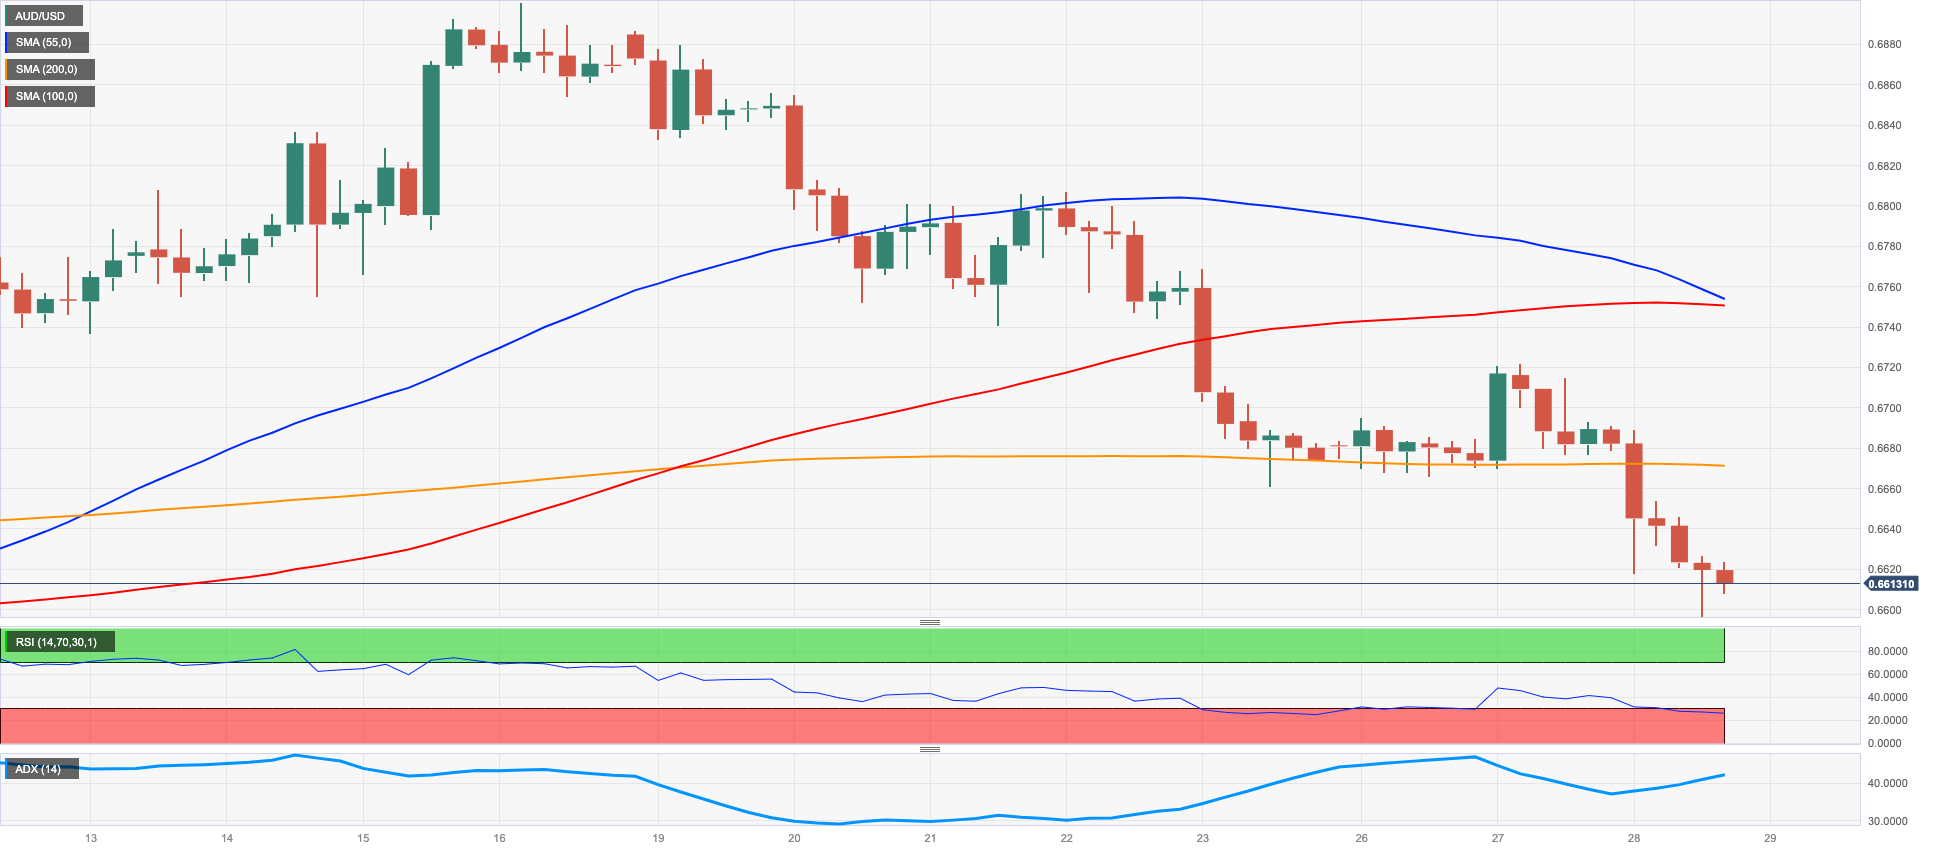
AUD/USD dipped further into negative territory, briefly piercing the key support at 0.6600 to print 3-week lows and trade close to the 78.6% Fibo retracement of the June rally (0.6773) on Wednesday.
The strong rebound in the greenback was said to have weighed heavily on high-beta currencies and the risk complex in general, while the bearish performance in the commodity universe was also reported to have contributed to the sour sentiment around the Aussie dollar.
It was noted that the Monthly CPI Indicator had eased to 5.6% during May (from 6.8%) in the domestic calendar.
Looking ahead, there is a possibility of further correction in AUD/USD. If the weekly low of 0.6596 (June 28) is breached, it is expected to pave the way for a potential deeper pullback towards 0.6573 (78.6% Fibo of the June rally) prior to the 2023 low of 0.6458 (May 31), followed by the November 2022 low at 0.6272 (November 3), and the 2022 low of 0.6169 (October 13). Having said that, the immediate resistance level can be found at the weekly top of 0.6720 (June 27) ahead of 0.6801 (23.6% Fibo of the June rally) and the June peak of 0.6899 (June 16). North from here comes the critical level of 0.7000, the weekly high of 0.7029 (February 14), and the 2023 top of 0.7157 (February 2). The day-to-day RSI slipped back to the proximity of 40.
Resistance levels: 0.6670 0.6720 0.6806 (4H chart)
Support levels: 0.6597 0.6579 0.6458 (4H chart)
GOLD
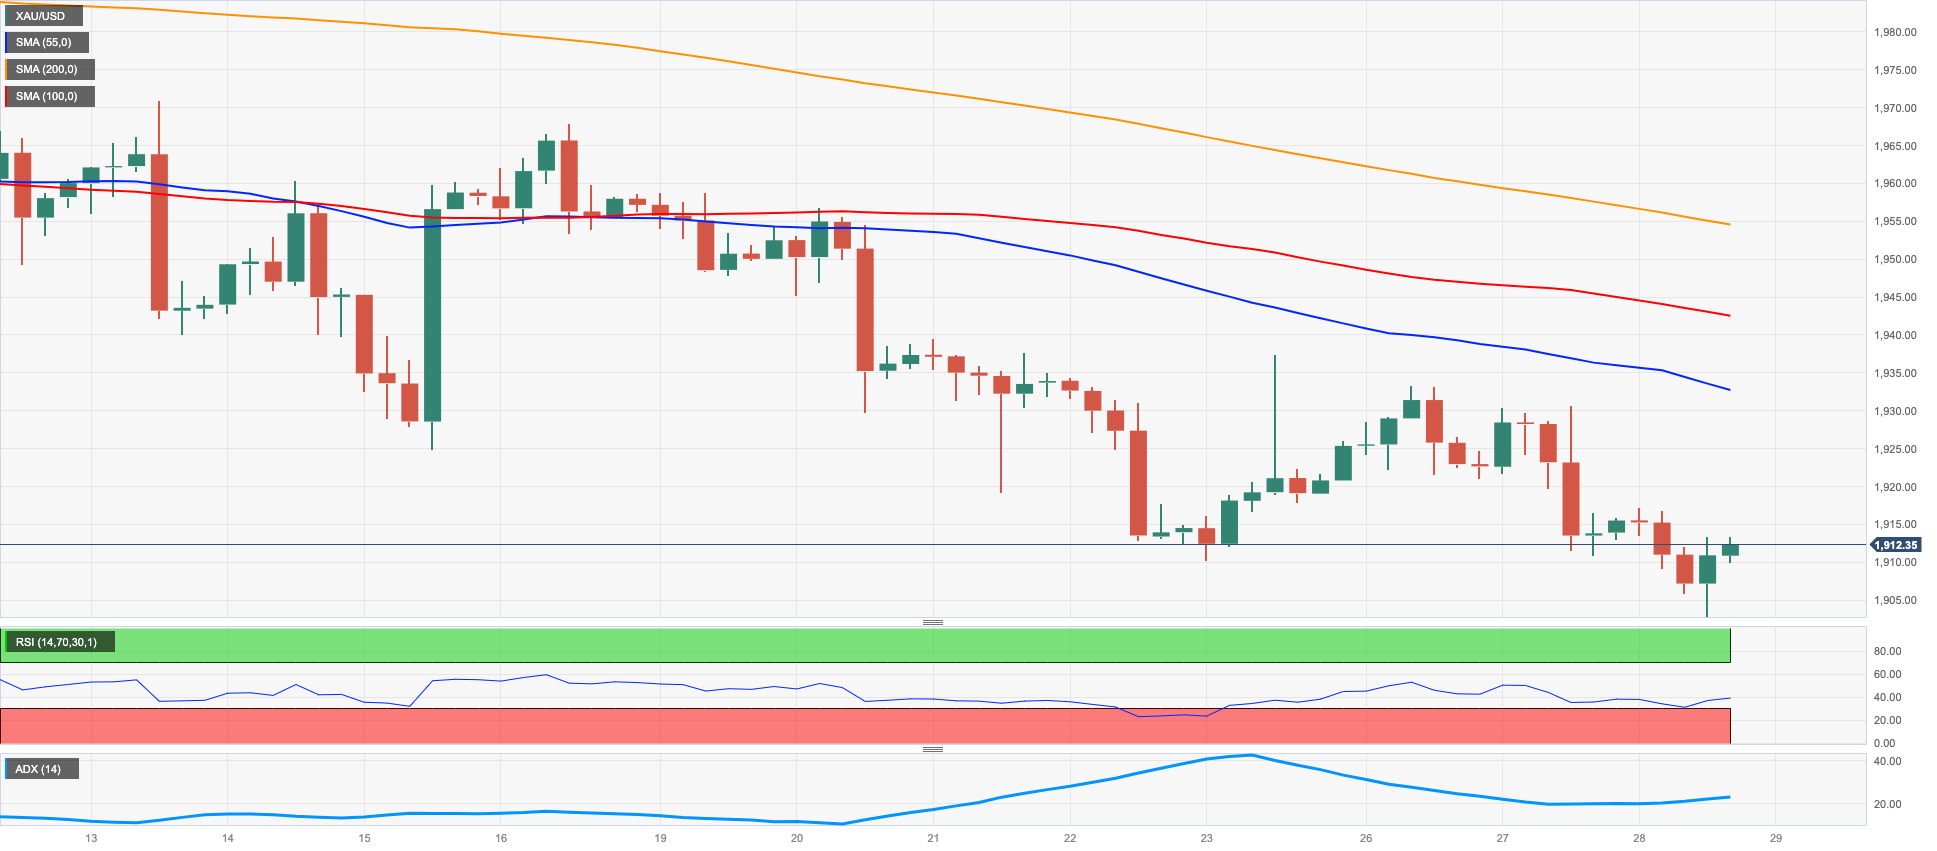
On Wednesday, the price of gold experienced a retreat, reaching new three-month lows just a few cents away from the $1900 per troy ounce mark.
This marked the second consecutive daily decline, which coincided with a strong rebound in the value of the US dollar. However, the downward pressure on the precious metal was somewhat mitigated by the decrease in US yields across various maturities.
During this time, there is a significant focus on bullion as major central banks continue their tightening campaigns in an effort to address persistently high inflation on both sides of the Atlantic.
Recently, gold broke below a multi-week consolidation range, and immediate support levels are now evident at the June low of $1902 (June 28). Furthermore, if the crucial round level of $1900 is breached, there is a possibility of a retracement towards the key 200-day SMA at $1855, ahead of the 2023 low of $1804 (February 28) and the critical threshold of $1800 per troy ounce. On the flip side, the initial obstacle lies at the June peak of $1983 (June 2), seconded by the significant milestone of $2000. Beyond this point, there are no major resistance levels until the 2023 peak of $2067 (May 4), preceding the 2022 high of $2070 (March 8), and ultimately the all-time record of $2075 on August 7, 2020.
Resistance levels: $1937 $1956 $1983 (4H chart)
Support levels: $1902 $1885 $1809 (4H chart)
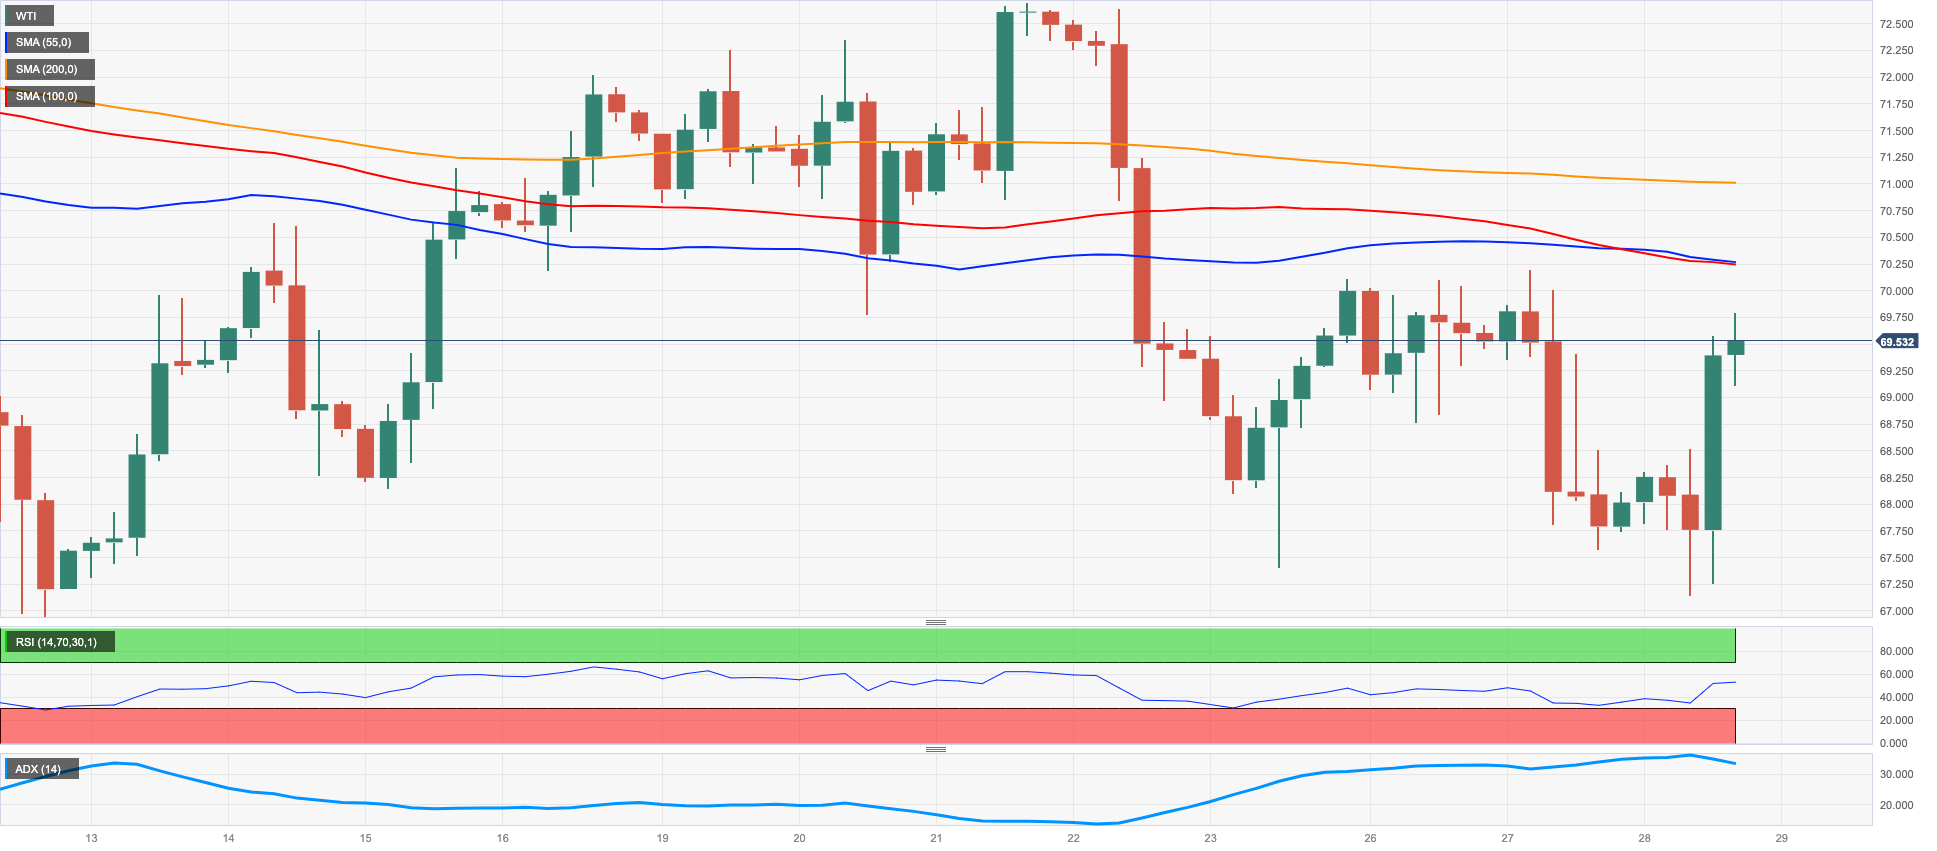
CRUDE WTI
Prices of WTI made significant gains and approached the key $70.00 mark per barrel, following an early drop to weekly lows in the $67.00 zone.
Traders have temporarily set aside concerns over demand and oversupply in the oil market in response to the larger-than-expected drop in US crude oil inventories during the week ended on June 23, as reported by the EIA's weekly report.
On this, the agency reported that US crude oil inventories unexpectedly dropped by 9.603M barrels, while supplies at Cushing increased by 1.209M barrels, Weekly Distillate Stocks went up by 0.124M barrels, and gasoline stockpiles rose by 0.603M barrels.
The upbeat mood following the EIA's report was said to have helped investors set aside recession fears amidst the already telegraphed resumption of the tightening cycle by the Fed and the projected 25 bps rate hike by the ECB next month.
Looking forward, the immediate downside for WTI is at the June low of $66.86 (June 13), followed by the 2023 low of $63.61 (May 4), the December 2021 low of $62.46 (December 2), and the critical level of $60.00 per barrel. Just the opposite, prices are poised to test the June high of $74.92 (June 5), bolstered by the vicinity of the transitory 100-day SMA at $74.12. Further higher, the 200-day SMA at $77.71 appears, followed by the weekly high of $79.14 (April 24) and the important barrier of $80.00 per barrel. The latter's breakout reveals a rise to the 2023 high of $83.49 (April 12), ahead of the November 2022 top of $93.73 (November 7).
Resistance levels: $70.11 $72.68 $74.92 (4H chart)
Support levels: $67.01 $66.77 $63.71 (4H chart)
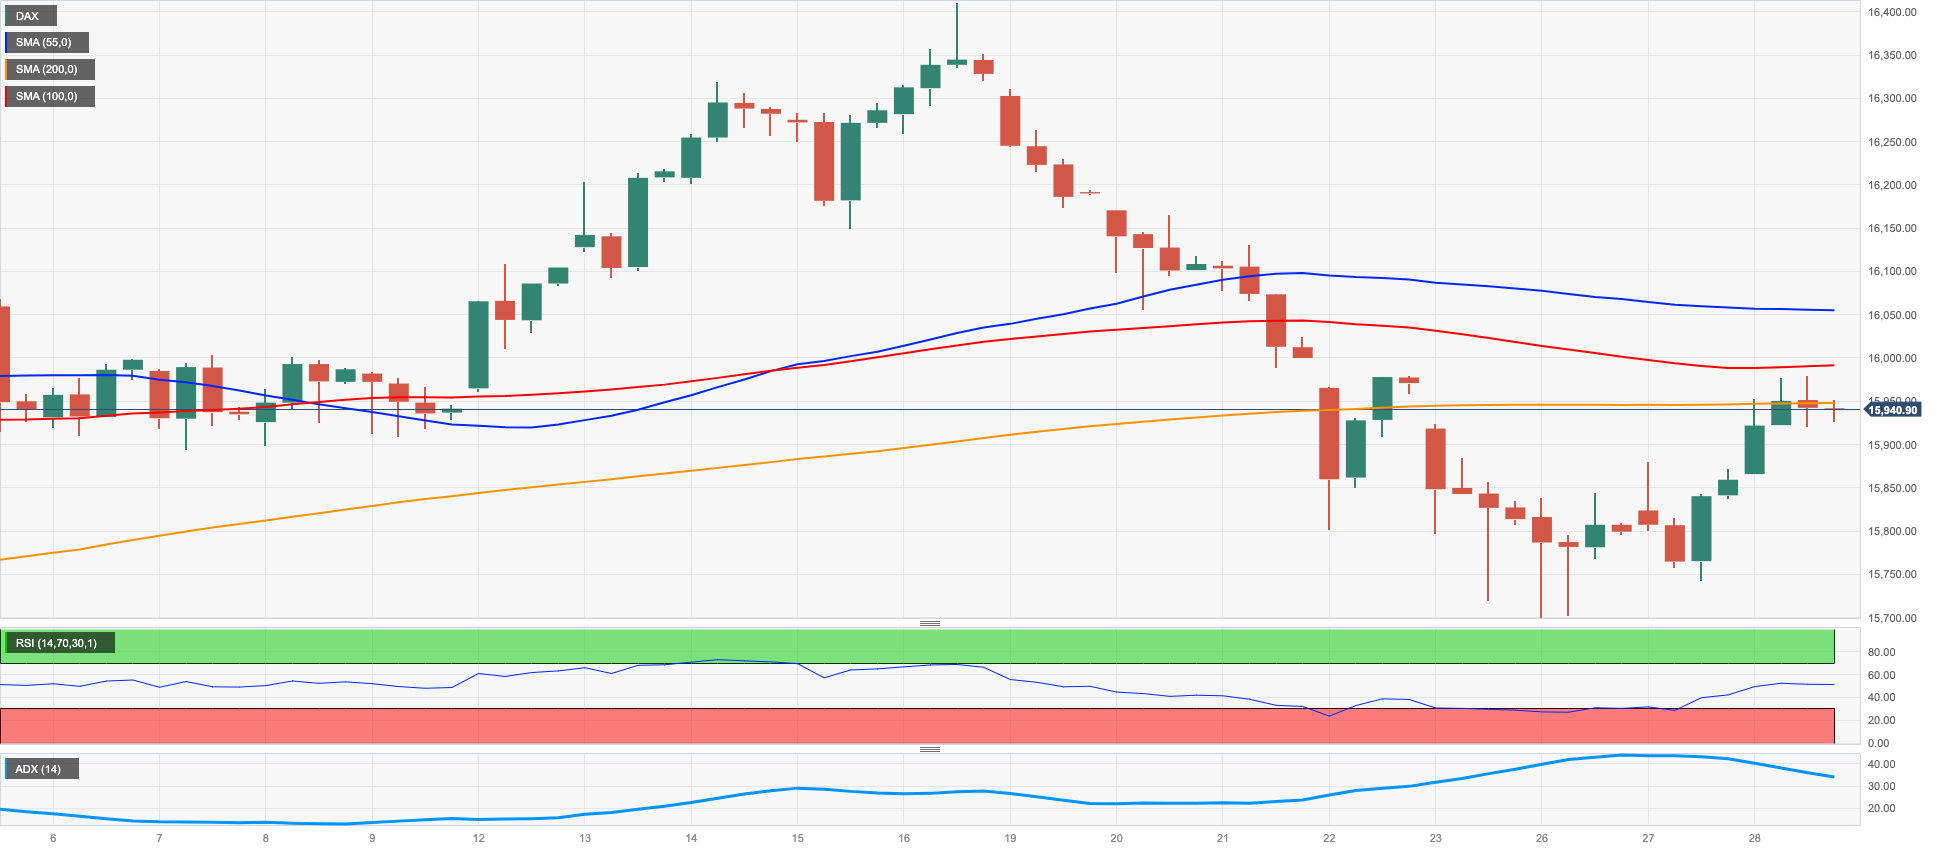
GER40
European stocks closed Wednesday's session on a strong note, with the German reference DAX40 managing to add to Tuesday's gains and approach the key hurdle at 16000.
Further upside in the index was driven by a broad-based recovery in stock markets across the old continent, despite the persistent hawkish narrative from ECB officials and the anticipated 25 bps rate hike by the central bank at its July event.
In domestic news, the Consumer Confidence tracked by GfK worsened slightly to -25.4 for the month of July (from 24.4).
Around the money market, the 10-year bund yields have reversed Tuesday's gains and returned to the 2.30% region.
Further gains in the DAX40 are expected to revisit the all-time high of 16427 (June 16). The other way around, the index should meet initial contention at the weekly low of 15713 (June 26) prior to the provisional 100-day SMA at 15679 and the May low of 15629 (May 31). Further losses may lead to a revisit of the April low at 15482 (April 5), ahead of minor support at 14809 (March 24) and the significant 200-day SMA at 14757 ahead of the March low at 14458 (March 20). The daily RSI rebounded and trespassed the 48 level.
Best Performers: Siemens Energy AG, Sartorius AG VZO, Rheinmetall AG
Worst Performers: Zalando SE, Covestro, Siemens AG
Resistance levels: 15994 16427 17000? (4H chart)
Support levels: 15851 15713 15629 (4H chart)
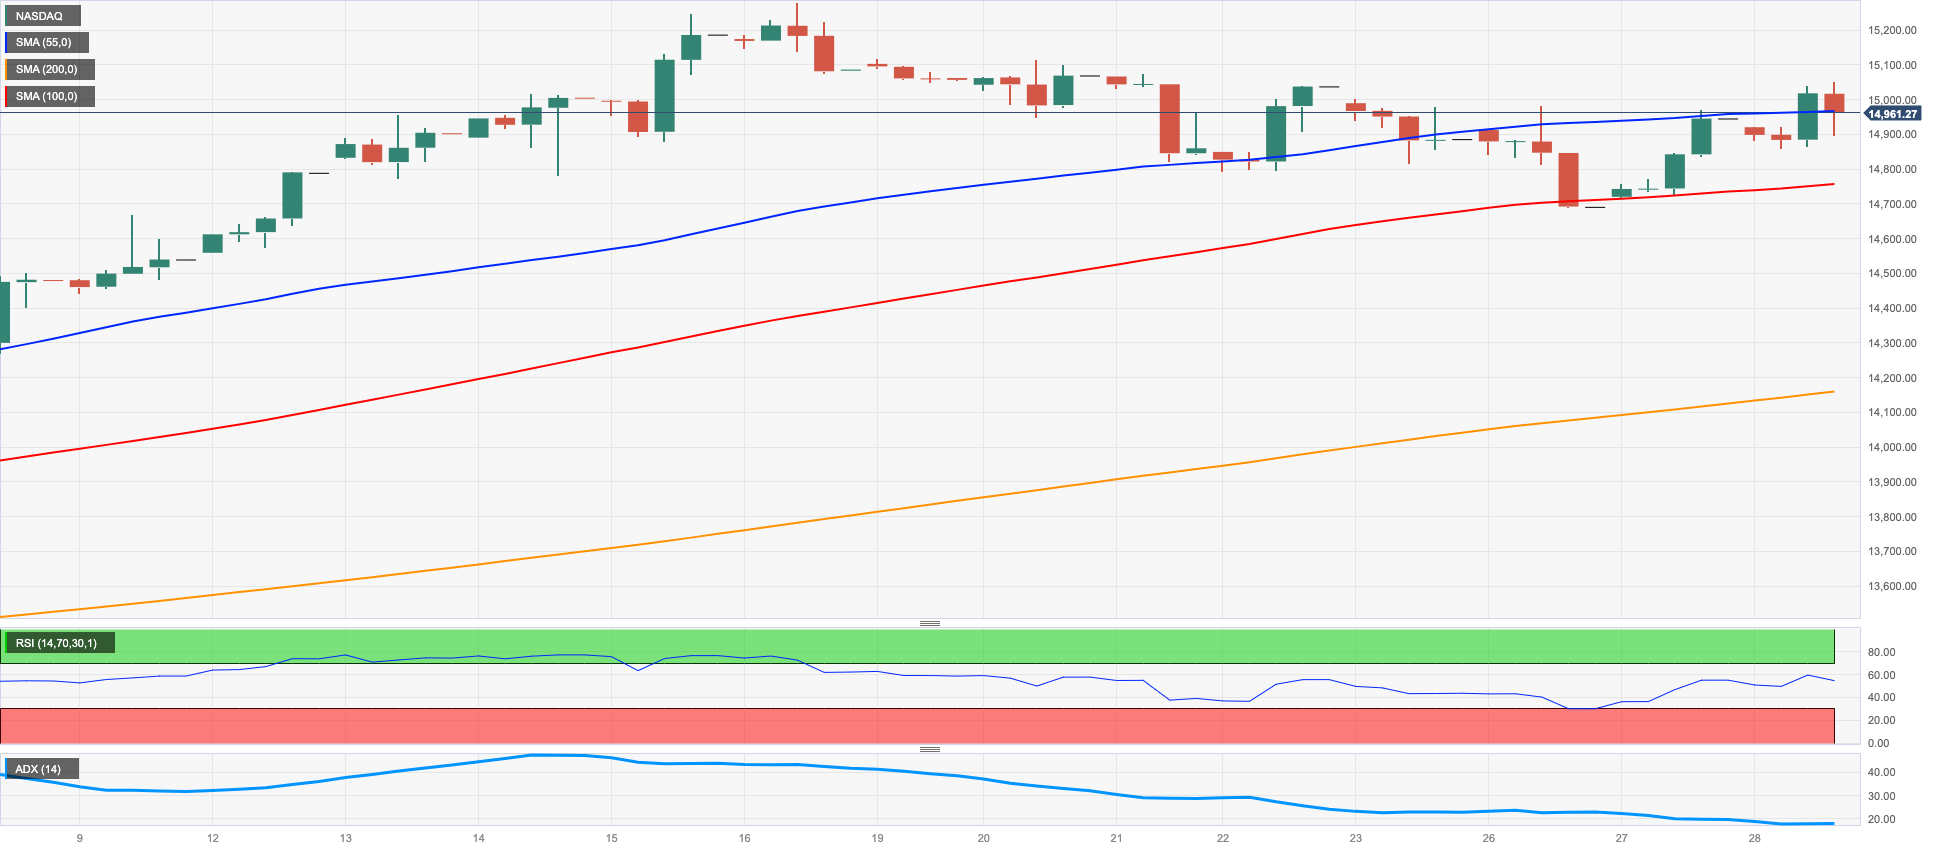
NASDAQ
The US tech sector outperformed its US peers, as the Nasdaq 100 achieved the second daily gain in a row, extending the bounce off Monday's lows near the 14700 zone and regaining the vicinity of the key 15000 barrier.
Further upside in the index was reportedly driven by solid performances from megacaps Apple (which hit an all-time high), Microsoft, Amazon, and Alphabet, among others, which helped to alleviate concerns over further Fed rate hikes in the coming months.
If bulls regain control, the Nasdaq 100 faces the immediate hurdle at the 2023 high of 15284 (June 16), ahead of the round level of 16000. Instead, initial contention appears at the weekly lows of 14687 (June 26) and 14283 (June 7), prior to the interim 55-day SMA at 13840, and then another weekly low of 13520 (May 24). A more significant pullback could revisit the May low of 12938 (May 4), ahead of the April low of 12724 (April 25), the 200-day SMA at 12336, and the March low of 11695 (March 13). The daily RSI climbed further and flirted with the 62 yardstick.
Top Gainers: Lucid Group, Netflix, Datadog
Top Losers: JD.com Inc Adr, American Electric Power, Exelon
Resistance levels: 15051 15284 16017 (4H chart)
Support levels: 14687 14283 13520 (4H chart)
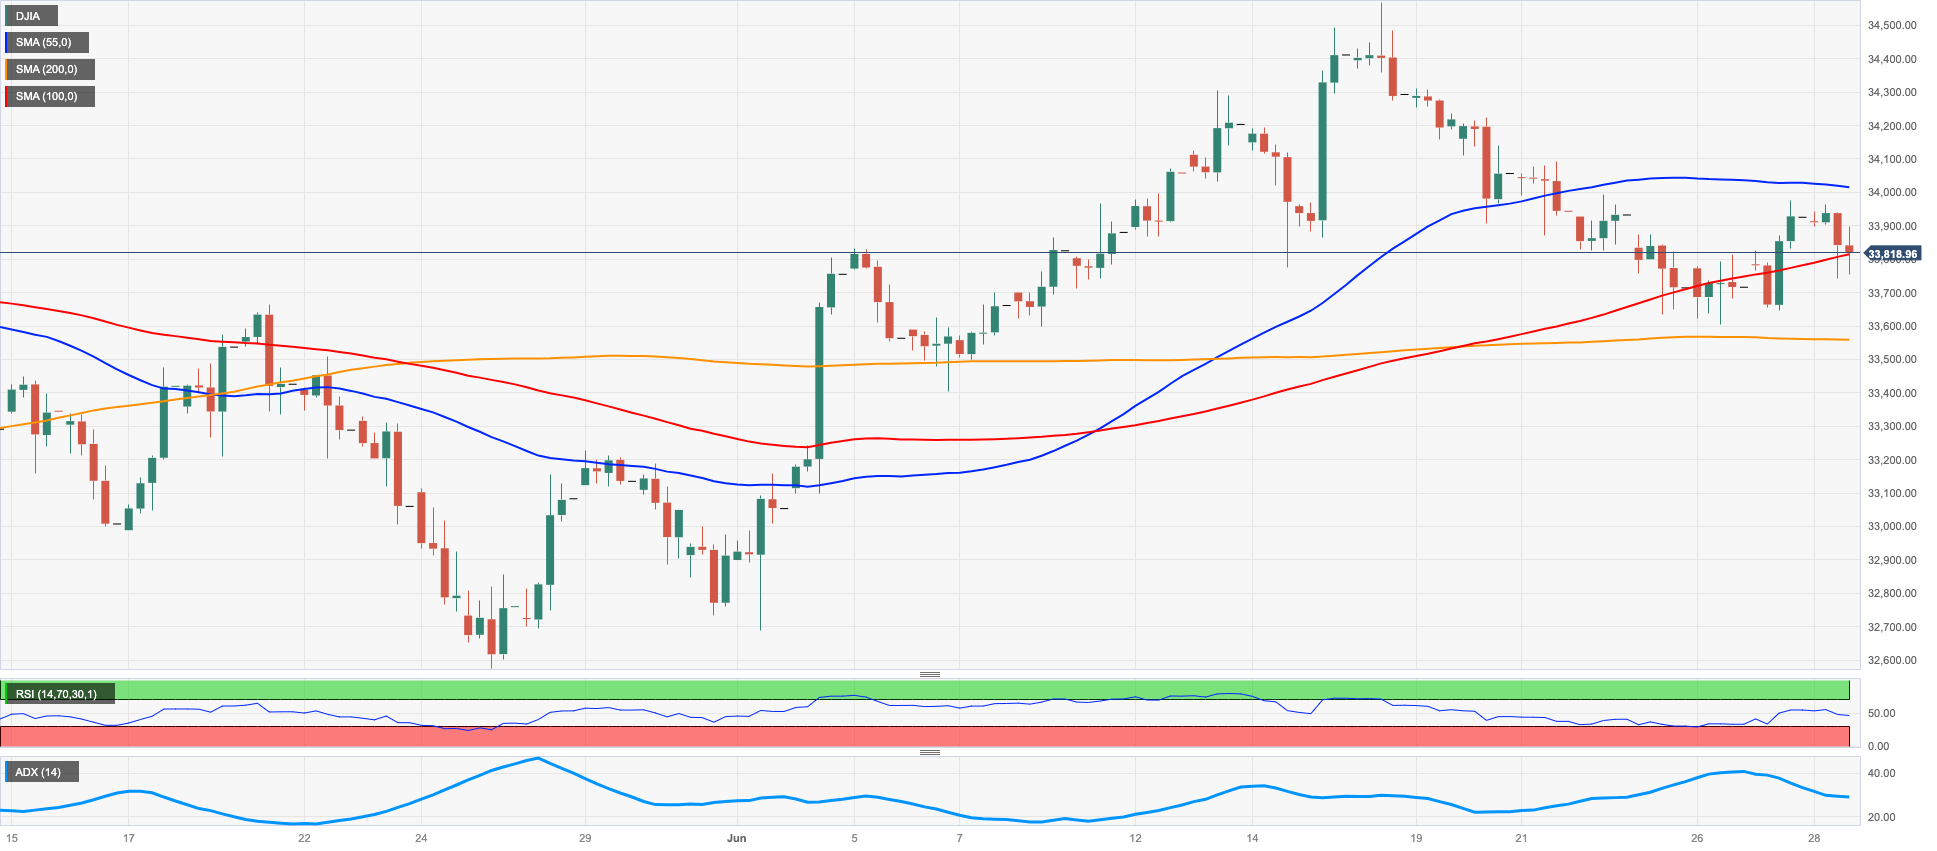
DOW JONES
Following concerns regarding a potential economic slowdown due to further tightening measures by the Federal Reserve and other major central banks in the coming months, US equities, as measured by the Dow Jones, resumed their downward movement, partially reducing the gains made on Tuesday.
Investors also took into consideration Chair Powell's statements at the ECB Forum, where he downplayed the likelihood of a recession while indicating that interest rates could rise for two consecutive sessions if deemed necessary.
All in all, the Dow Jones dropped 0.39% to 33793, the S&P500 deflated 0.16% to 4370 , and the tech-focused Nasdaq Composite gained 0.14% to 13575.
Despite recent gains, the Dow Jones continues to face pressure. Immediate support is found at the weekly low of 33610 (June 26), seconded by the temporary 100-day SMA at 33355 and the significant 200-day SMA at 32888. Down from here, potential support levels include the May low of 32586 (May 25), the 2023 low of 31429 (March 15) and the 2022 low of 28660 (October 13). By contrast, the next notable resistance level remains at the 2023 peak of 34588 (June 16) prior to the December 2022 high at 34712 (December 13) and the April 2022 top at 35492 (April 21). The daily RSI eased to the proximity of 51.
Top Performers: Salesforce Inc, Chevron, Walmart
Worst Performers: Travelers, Home Depot, Intel
Resistance levels: 33975 34588 34712 (4H chart)
Support levels: 33610 33351 32586 (4H chart)
MACROECONOMIC EVENTS

All Information & Updates provided by:

All information relating to the financial markets available on this page has been prepared and issued by FXStreet (Forexstreet SL, Spain, Reg: B62498233) on the basis of publicly available information and all information believed to be reliable and does not conflict with Kuwaiti local laws, and all necessary care has been taken to before the company to ensure that the facts mentioned are correct from the source.
NCM Investment nor any of its directors or employees shall in any way be held responsible for the contents of this news, and the information contained on this page is intended only to provide clients with publicly available information and should not be construed as investment advice, report or analysis and/or constitute an offer or invitation to buy or sell financial instruments of any kind.
RISK WARNING: Forex and CFDs are highly risky leveraged products, as losses can exceed deposits. Please ensure you understand all the risks and take independent advice if necessary. NCM will segregate the clients based on the criteria of the regulator and its bylaws. NCM does not provide any advisory service; the material published does not constitute advice or a recommendation for a transaction in any financial instrument. NCM accepts no responsibility for any use of the content presented and any consequences of that use. Anyone acting on the information provided does so at their own risk.