
- Contact Us:
-

-

-

-


Daily Market Updates
30 Jun 2023
USDJPY
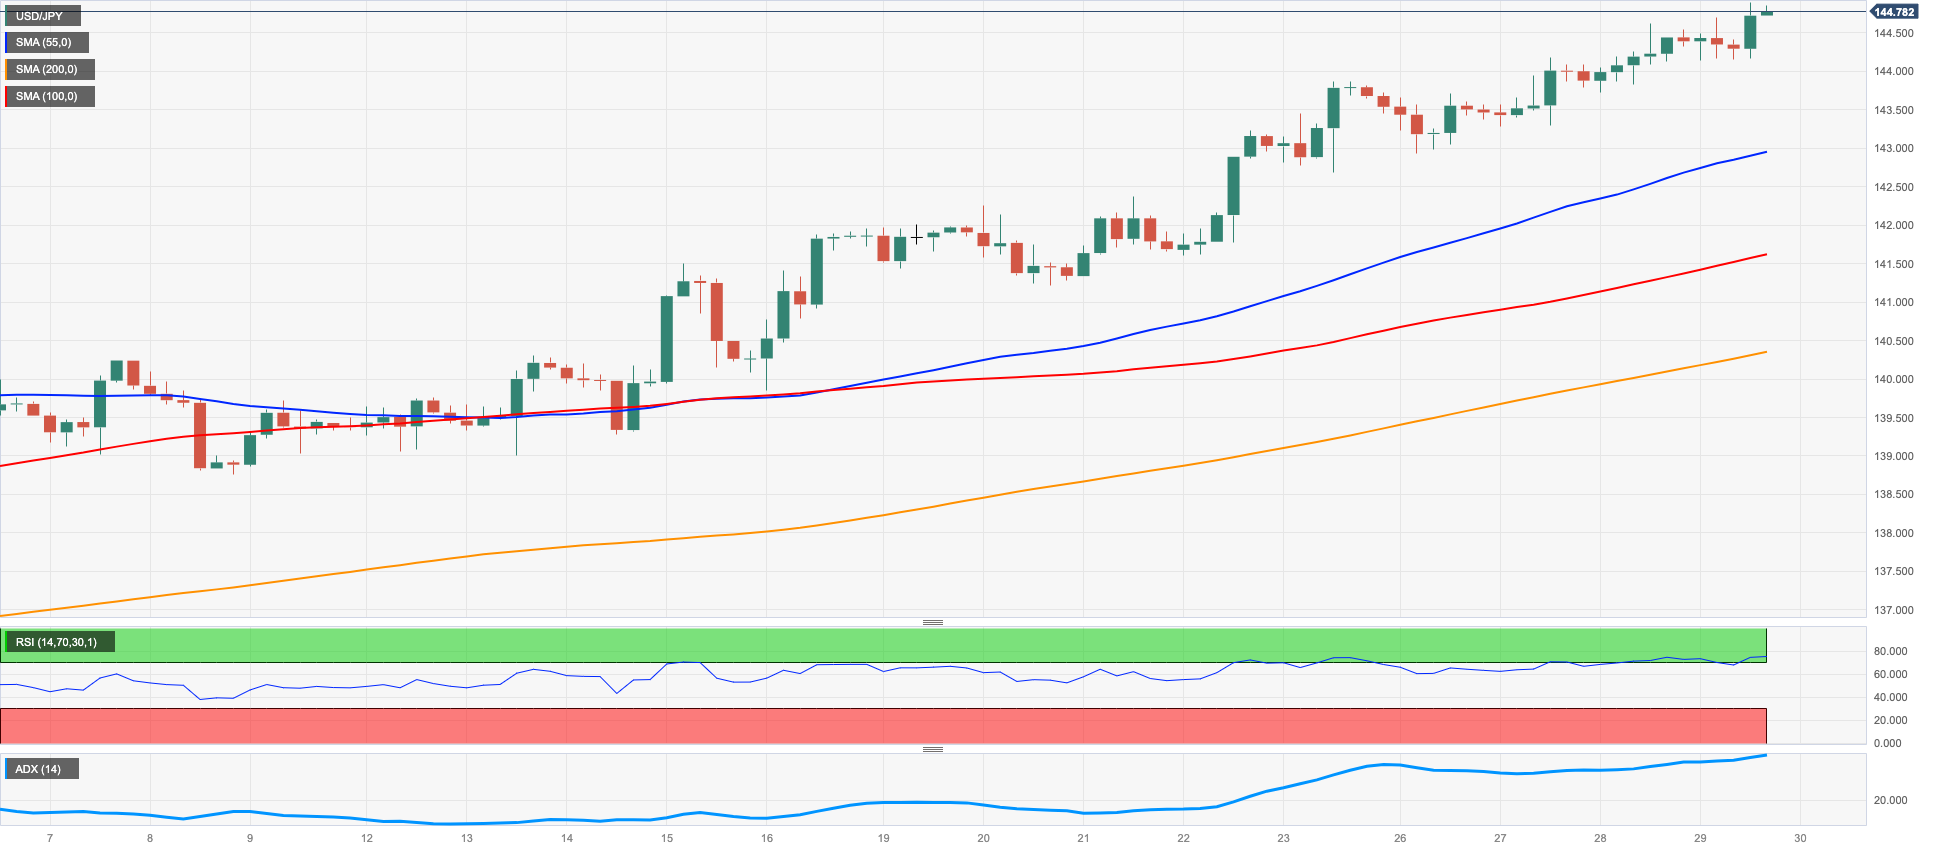
The rally in USD/JPY remains everything but abated, and this time it printed a new 2023 peak at 144.89 on Thursday.
Indeed, the swelling policy divergence between the Federal Reserve and the Bank of Japan (BoJ) continued to bolster the uptrend in the pair, which seems to have temporarily run out of steam just pips away from the key 145.00 hurdle.
Spot clinched the third consecutive daily gain and remained well in place to close the third week in a row in positive territory on the back of the marked rebound in the greenback and the equally robust bound in US yields across the curve, all in response to the extra-hawkish narrative from Chair Powell at recent events.
From the BoJ, Deputy Governor Himino argued that he did not see signs of risk indicating that Japan would encounter excessively high inflation but emphasized the need to consider various factors. He acknowledged that recent increases in Japan's consumer inflation were considerably more moderate compared to the United States and Europe, but stronger than initially anticipated. He mentioned that while the pass-through effect of import price hikes was expanding, additional factors such as labour shortages and robust domestic demand might also contribute to the rise in inflation. Himino emphasized the importance of the Bank of Japan (BoJ) adopting a flexible policy approach, while expressing that the current optimal strategy was to maintain an ultra-easy monetary policy.
In Japan, the JGB 10-year yields extended the consolidation theme in the area below 0.40%.
In the Japanese docket, Foreign Bond Investment rose by ¥155.6B in the week to June 24 and Retail Sales expanded 5.7% in the year to May, surpassing initial estimates.
It is expected that the USD/JPY will continue to perform well. Several key resistance levels have been identified, including the 2023 high of 144.89 (June 29), the peak from October 2022 at 151.94 (October 22), and the psychological level of 152.00. On the downside, the immediate support level is observed at the June low of 138.42 (June 1), followed by further support levels at the interim 55-day SMA of 138.19, and the crucial 200-day SMA of 137.21. If the USD/JPY falls further, the transitory 100-day SMA of 136.12, the weekly low of 133.01 (April 26), and the minor support level of 132.01 (April 13) are likely to provide additional support. Below these levels, the April low of 130.62 (April 5) and key support at 130.00 are expected. The daily RSI has remained in the overbought territory past 76.
Resistance levels: 144.89 146.79 148.45 (4H chart)
Support levels: 142.64 141.21 139.85 (4H chart)
GBPUSD
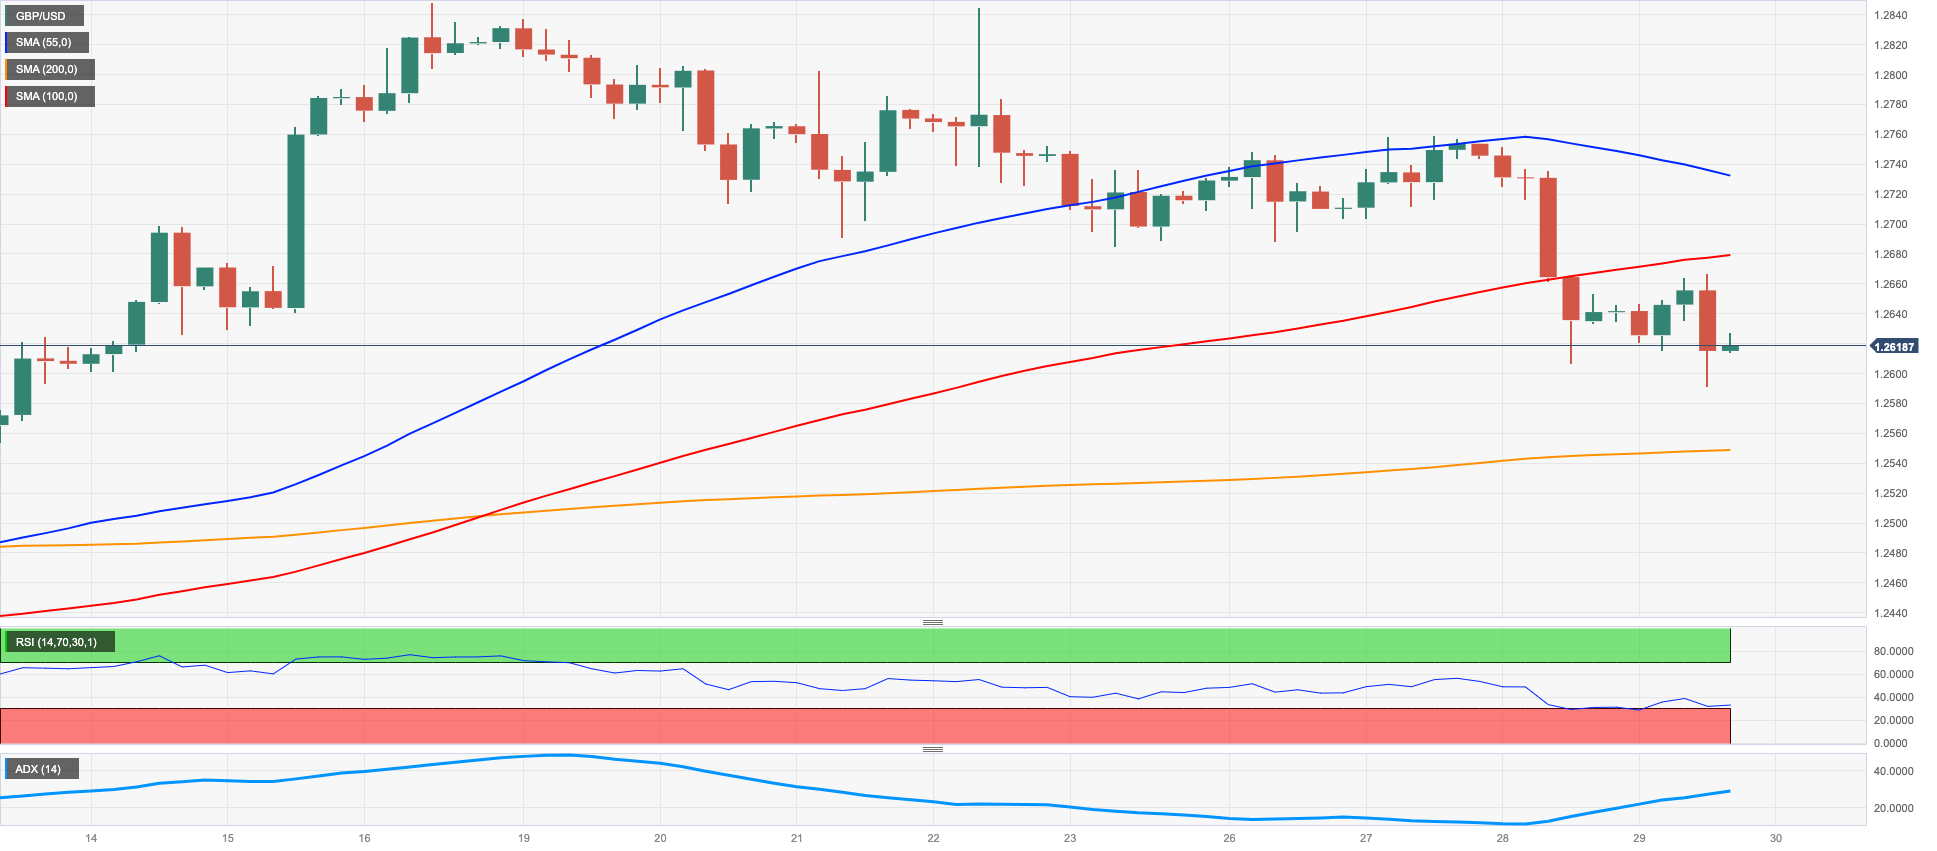
GBP/USD clinched the second consecutive daily pullback and retreated to the sub-1.2600 region to print 2-week lows on Thursday. Cable, however, seems to have met some decent contention around 1.2590, an area also coincident with the 100-week SMA.
Once again, the firm performance of the greenback kept the price action in the risk complex subdued and sponsored another negative session in the British pound.
In the UK, Mortgage Approvals increased by 50.524K in May, and Mortgage Lending shrank by £0.092B in the same period.
GBP/USD faces immediate contention at the weekly low of 1.2590 (June 29), followed by the 1.2570 region, which is where the trendline from 2021 to 2023 is located. After that, there is the interim 55-day SMA at 1.2531 and the June low of 1.2368 (June 5). The temporary 100-day SMA at 1.2371 is expected to provide support beyond that, followed by the May low at 1.2308 (May 25) and the April low at 1.2274 (April 3). The crucial 200-day SMA at 1.2100 comes next. Conversely, if the pair manages to surpass the 2023 high of 1.2848 (June 16), it could potentially test the 200-week SMA at 1.2876 before reaching the psychological level of 1.3000. The daily RSI deflated to the key 50 zone.
Resistance levels: 1.2751 1.2848 1.3089 (4H chart)
Support levels: 1.2590 1.2547 1.2486 (4H chart)
AUDUSD
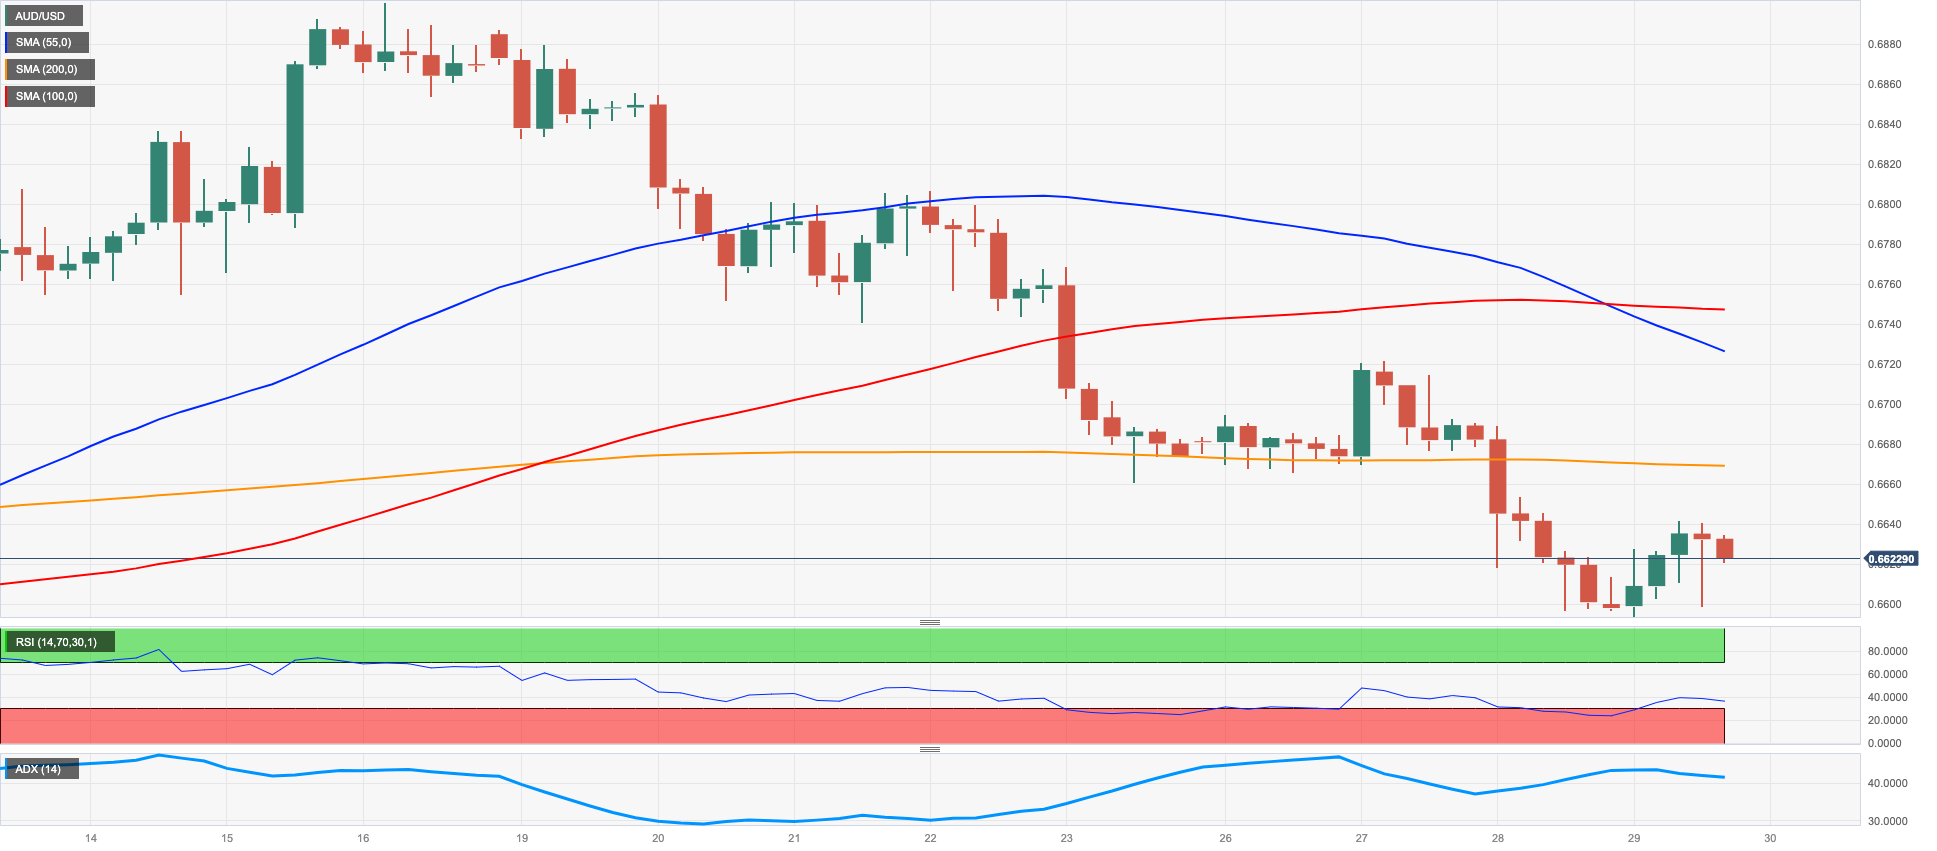
AUD/USD managed to regain composure and partially reverse Wednesday’s strong pullback, regaining upside traction soon after piercing the 0.6600 support during early trade on Thursday.
The recovery in the Aussie dollar came in contrast to further strength in the greenback, while it also ignored the broad-based selling pressure in the commodity complex, where copper prices extended the weekly leg lower and iron ore advanced marginally.
Collaborating with the bid bias around the Australian currency emerged the better-than-expected results from Retail Sales, which expanded at a monthly 0.7% in May.
Despite the daily bounce, AUD/USD still risks a deeper retracement. That said, immediate contention emerges at the weekly low of 0.6595 (June 29) prior to 0.6573 (78.6% Fibonacci retracement level of the June rally) and the 2023 low of 0.6458 (May 31). Down from here comes the November 2022 low at 0.6272 (November 3) seconded by the 2022 low of 0.6169 (October 13). Instead, occasional bullish moves should meet resistance at the weekly top of 0.6720 (June 27) before 0.6801 (23.6% Fibonacci retracement level of the June rally) and the June peak of 0.6899 (June 16). Beyond that lies the critical level of 0.7000, the weekly top of 0.7029 (February 14), and the 2023 peak of 0.7157 (February 2). The day-to-day RSI bounced to the vicinity of 43.
Resistance levels: 0.6640 0.6669 0.6720 (4H chart)
Support levels: 0.6595 0.6579 0.6458 (4H chart)
GOLD
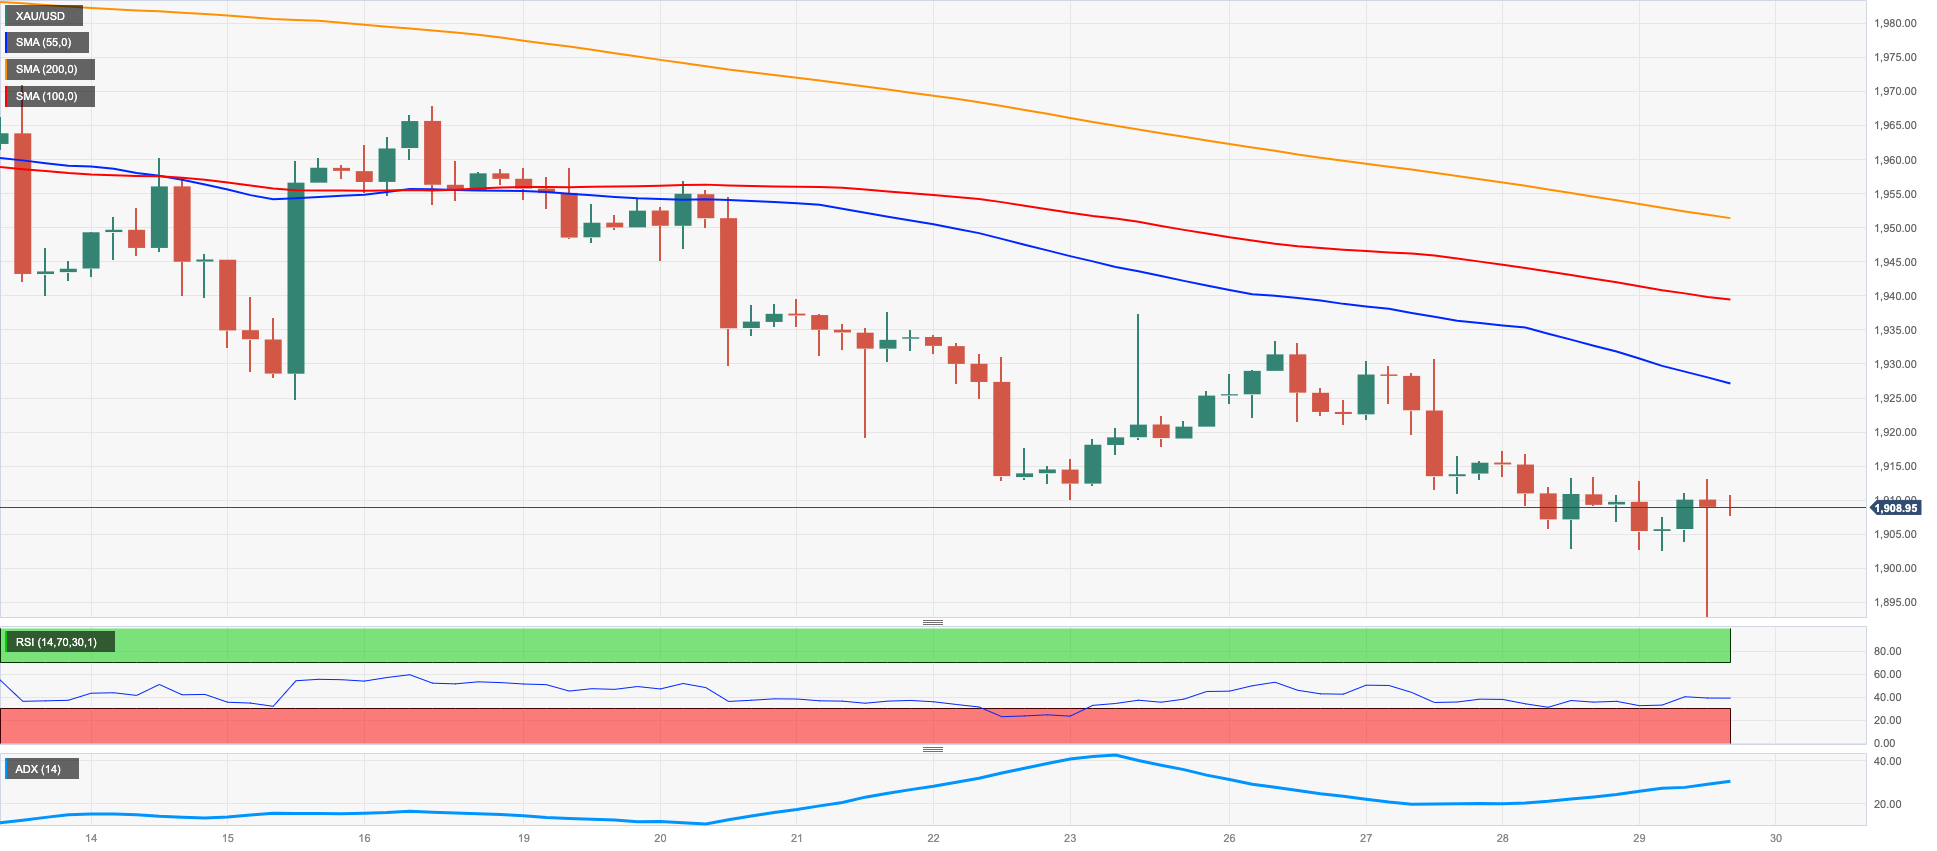
Prospects for further tightening by the Federal Reserve and other major central banks initially weighed on the precious metal and dragged prices below the $1900 mark per troy ounce for the first time since early March on Thursday.
However, bullion managed to regain some balance and retake the key $1900 mark and beyond despite the firmer tone in the greenback and the pronounced uptick in US yields across the curve.
Moving forward, the yellow metal is expected to face rising headwinds from the central banks’ intentions to keep the tightening cycle well and sound in their battle to tackle stubbornly elevated inflation.
Gold prices remain well under pressure so far this month. Against that, immediate support is now seen around the June low of $1893 (June 29) prior to the key 200-day SMA at $1856 and the 2023 low of $1804 (February 28), which precedes the essential threshold of $1800 per troy ounce. On the flip side, the first impediment is the interim 100-day and 55-day SMAs at $1943 and $1973, respectively, seconded by the June top of $1983 (June 2) and the crucial milestone of $2000. There are no big resistance levels beyond this point until the 2023 peak of $2067 (May 4), which precedes the 2022 high of $2070 (March 8), and eventually the all-time top of $2075 on August 7, 2020.
Resistance levels: $1937 $1953 $1983 (4H chart)
Support levels: $1893 $1885 $1809 (4H chart)
CRUDE WTI
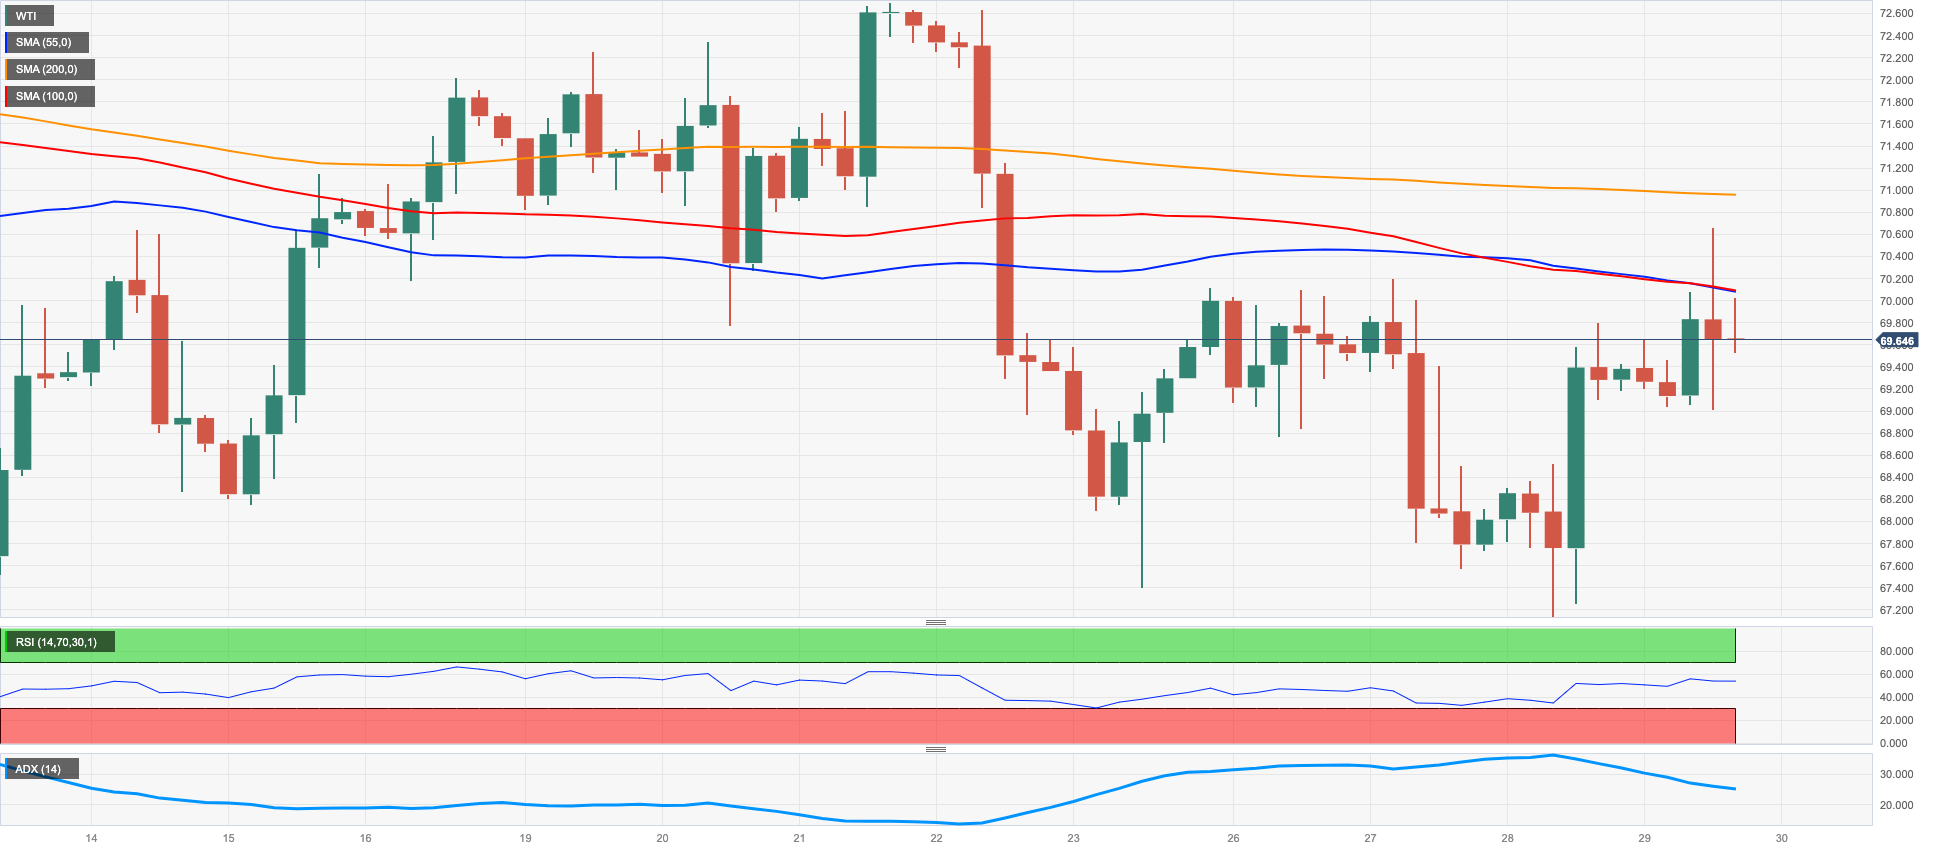
After gaining on Wednesday, WTI prices rose above the important threshold of $70.00 per barrel on Thursday. Despite this, traders were unable to solidify the breakout beyond that significant level, and as a result, the commodity retreated somewhat.
In the meantime, crude oil managed to leave behind concerns stemming from the prospects for extra tightening by the Fed and other major central banks in a context where inflation remains elevated and still far away from the central banks’ target.
Further support for WTI came from Wednesday’s significant drop in US crude oil inventories, as per the weekly report by the EIA.
Later in the week, driller Baker Hughes will report on the US oil rig count for the week ending June 30.
The immediate downtrend for WTI is at the June low of $66.86 (June 13), followed by the 2023 low of $63.61 (May 4), the December 2021 low of $62.46 (December 2) and the critical level of $60.00 per barrel. Having said that, prices are poised to test the June high of $74.92 (June 5), supported by the proximity of the temporary 100-day SMA at $74.04. Further up, the 200-day SMA emerges at $77.63, seconded by the weekly top at $79.14 (24 April) and the important barrier at $80.00 per barrel. The breakout above the latter suggests a rise to the 2023 high at $83.49 (12 April) before reaching the November 2022 peak at $93.73 (7 November).
Resistance levels: $70.85 $72.68 $74.92 (4H chart)
Support levels: $67.01 $66.77 $63.71 (4H chart)
GER40
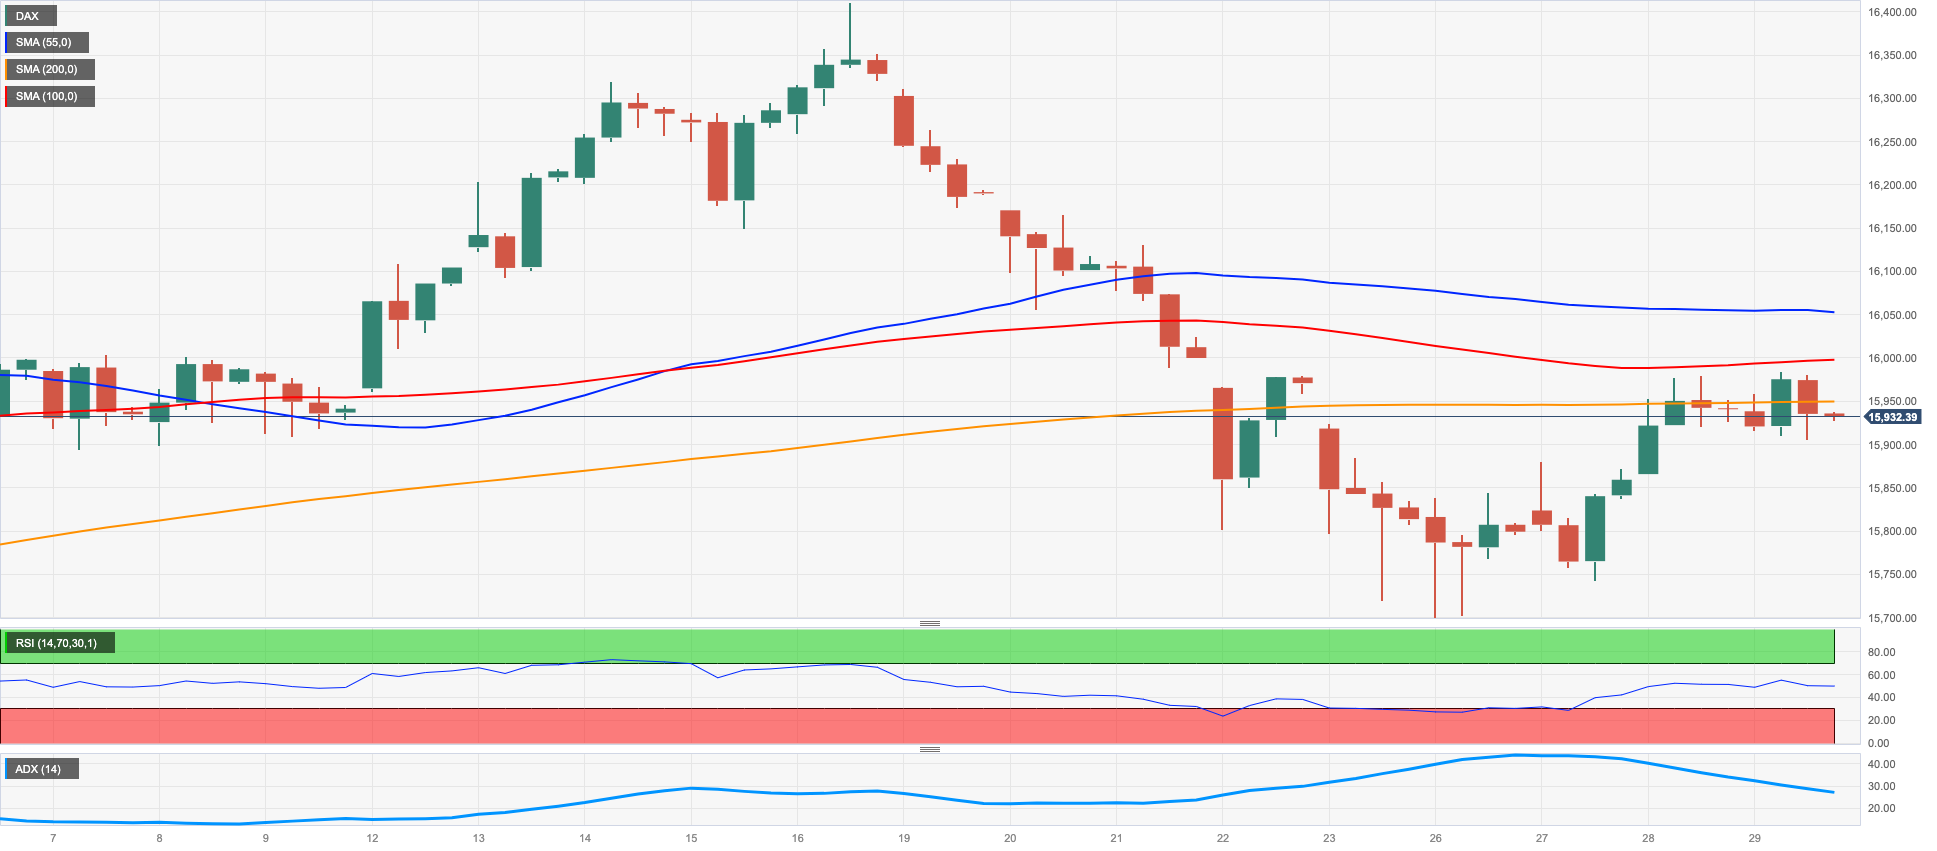
Following two daily gains in a row, German equities gauged by the DAX40 ended Thursday’s session with marginal losses and around Wednesday’s closing levels, still below the 16000 mark.
The inconclusive price action in the index came in response to increasing cautiousness in light of recent hawkish comments from central bankers’, who reiterated that extra tightening remains well on the table amidst the current environment of elevated inflation on both sides of the ocean.
Supporting the above, preliminary inflation figures in Germany saw the CPI rise 6.4% in the year to June, up from May’s 6.1% gain.
In the German debt market, 10-year bund yields rose to weekly peaks past the 2.40% mark.
Further rises in the DAX40 are forecast, with the index returning to its all-time high of 16427 (June 16). In the opposite direction, the index should encounter early resistance around the weekly low of 15713 (June 26), before the interim 100-day SMA at 15685 and the May low of 15629 (May 31). Further losses may result in a return to the April low of 15482 (April 5), followed by minor support at 14809 (March 24) and the key 200-day SMA at 14773, before the March low of 14458 (March 20). The daily RSI looked stable around 48.
Best Performers: Dr Ing hc F Porsche Prf, Commerzbank, Infineon
Worst Performers: Vonovia, Covestro, Brenntag AG
Resistance levels: 15998 16427 17000? (4H chart)
Support levels: 15864 15713 15629 (4H chart)
NASDAQ
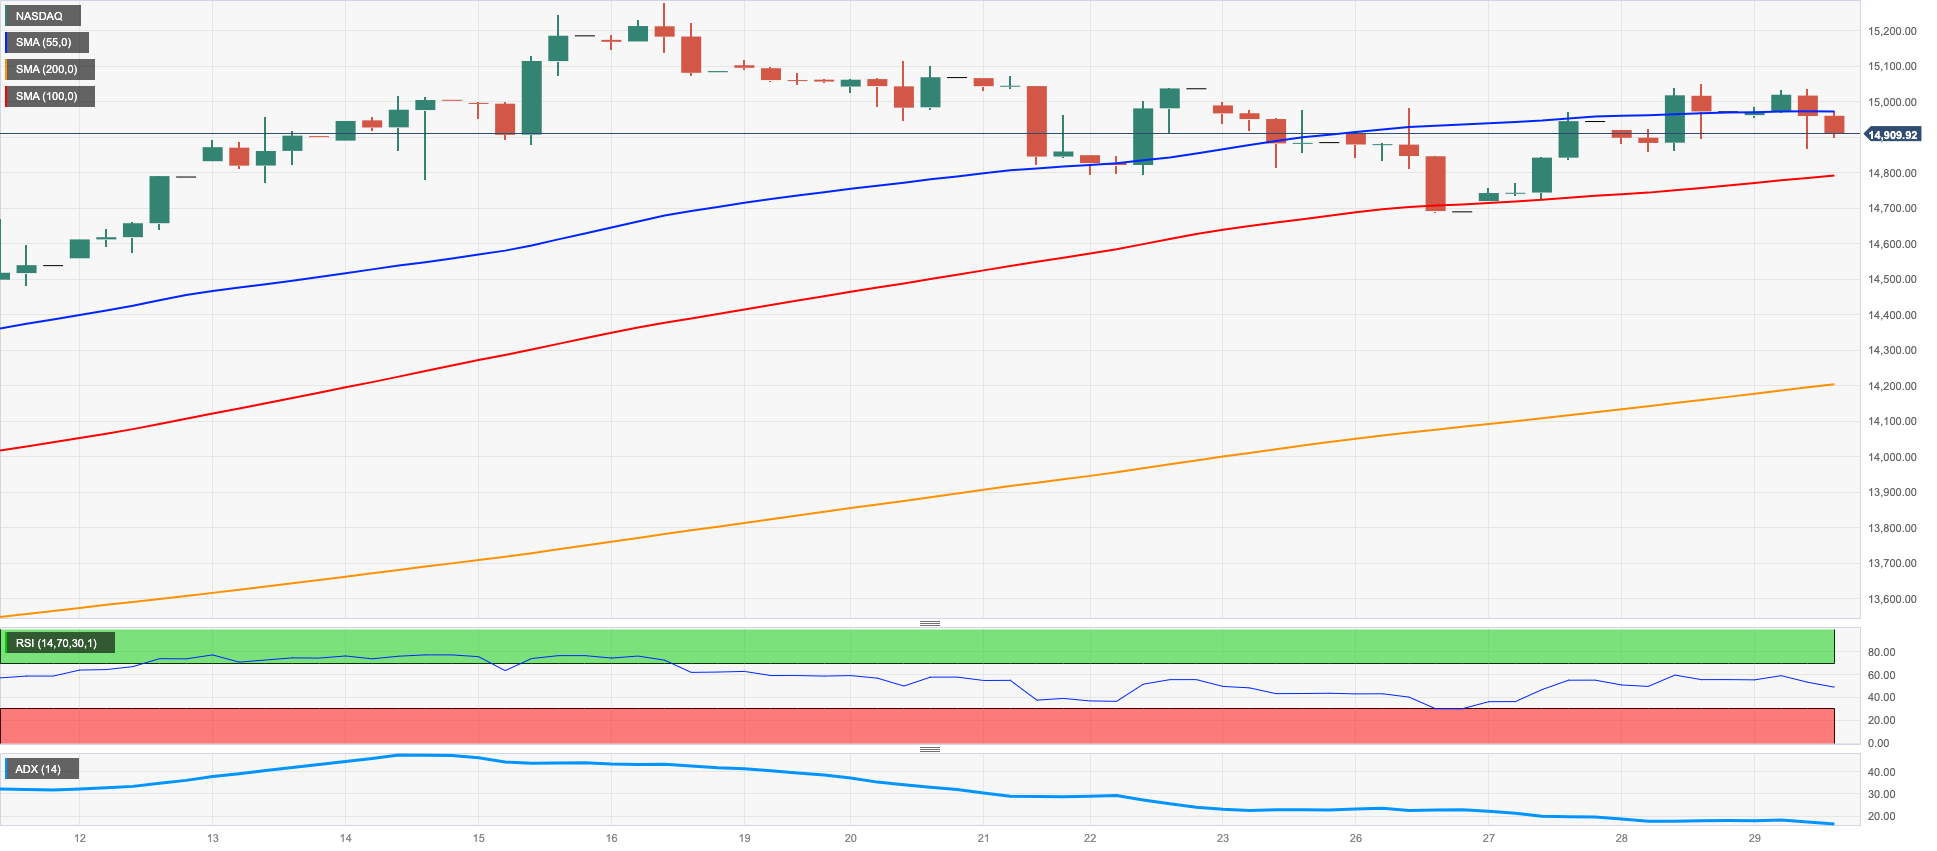
Tech stocks tracked by the reference Nasdaq 100 reversed two consecutive daily advances and charted humble losses on Thursday, revisiting at the same time the sub-15000 region.
Higher US yields coupled with the stronger greenback and poor performances from megacaps Amazon and Microsoft seemed to have been enough to keep the selling pressure in place on Thursday.
In the event that the bulls regain control, the Nasdaq 100 will encounter an immediate obstacle at the 2023 high of 15284 (June 16) before reaching the round level of 16000. Just the opposite, the first level of support is expected at the weekly lows of 14687 (June 26) and 14283 (June 7), followed by the provisional 55-day SMA at 13876, and then another weekly low of 13520 (May 24). A more substantial pullback could result in a revisit to the May low of 12938 (May 4), followed by the April low of 12724 (April 25), the 200-day SMA at 12347, and the March low of 11695 (dated March 13). The daily RSI eased to the proximity of the 61 area.
Top Gainers: Lucid Group, PACCAR, Workday
Top Losers: Micron, Airbnb, Atlassian Corp Plc
Resistance levels: 15051 15284 16017 (4H chart)
Support levels: 14687 14283 13520 (4H chart)
DOW JONES
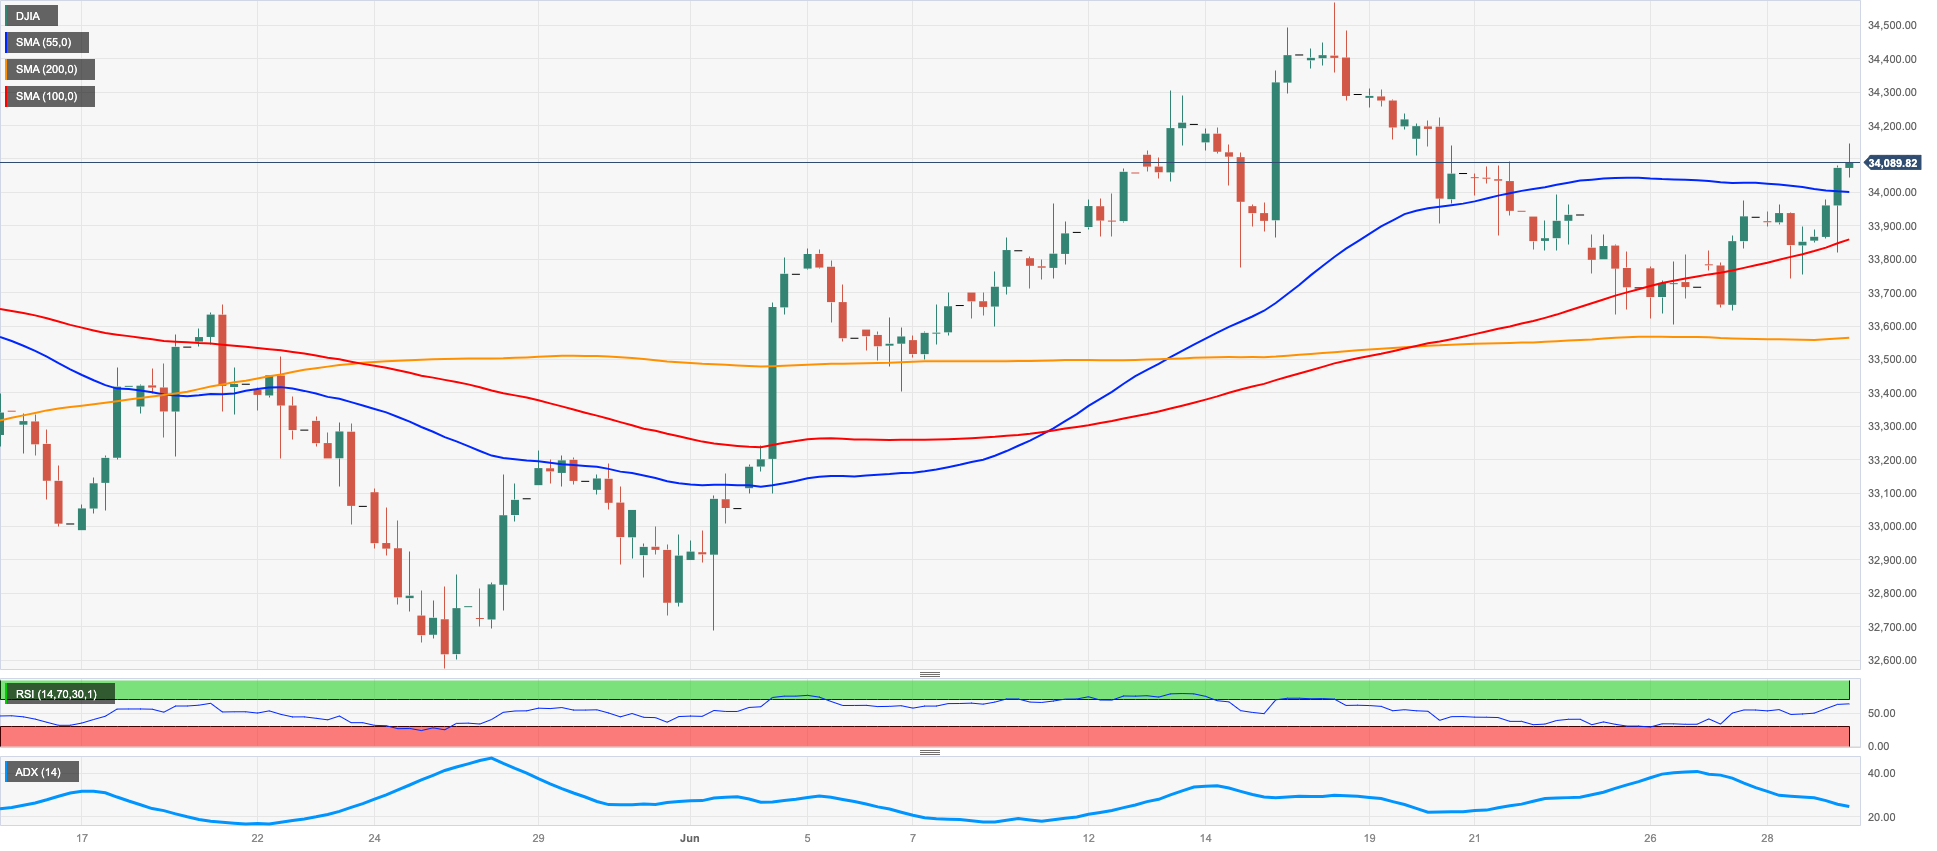
US equities tracked by the Dow Jones rose past the 34000 mark to clinch fresh multi-session tops on Thursday.
The uptick in the benchmark index came mainly on the back of the solid results from the Fed’s stress test published late on Wednesday.
According to the Fed, all 23 of the US banks that were part of the annual stress test were able to withstand a severe recession scenario and still provide loans to both individuals and corporations. Despite the group projecting losses of $541 billion, the banks were able to maintain minimum capital levels while continuing to support the economy by providing credit during the hypothetical recession.
That said, rising optimism in the banking sector appears to have been enough to keep the upbeat mood among investors and set aside concerns over the most likely resumption of the tightening campaign by the Fed and its overseas peers.
On the whole, the Dow Jones gained 0.70% to 34091, the S&P500 rose 0.35% to 4392 , and the tech-heavy Nasdaq Composite dropped 0.03% to 13589.
A more serious recovery in the Dow Jones now needs to clear the 2023 peak of 34588 (June 16) prior to the December 2022 high at 34712 (December 13) and the April 2022 top at 35492 (April 21). The other way around, the weekly low of 33610 (June 26) emerges as the initial support seconded by the interim 100-day SMA at 33357 and the significant 200-day SMA at 32897. Down from here, potential support levels include the May low of 32586 (May 25), the 2023 low of 31429 (March 15) and the 2022 low of 28660 (October 13). The daily RSI climbed past the 57 yardstick.
Top Performers: Goldman Sachs, JPMorgan, Visa A
Worst Performers: Intel, Walgreen Boots, Walmart
Resistance levels: 34147 34588 34712 (4H chart)
Support levels: 33610 33352 32586 (4H chart)
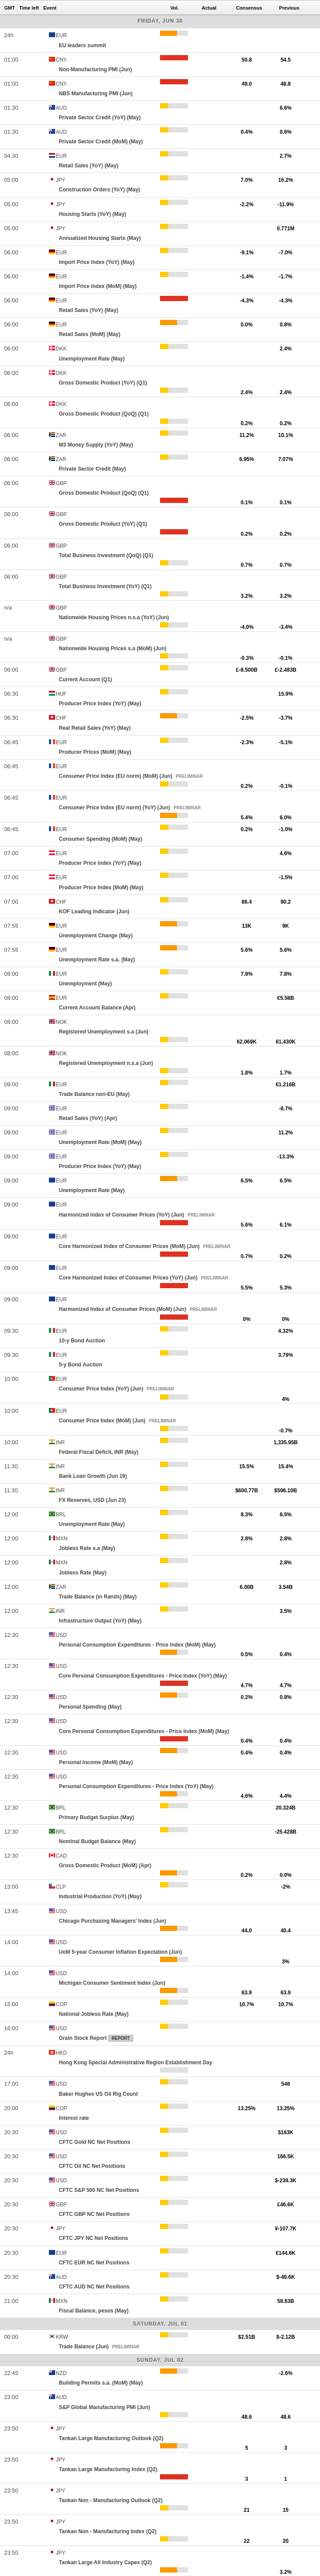
MACROECONOMIC EVENTS
All Information & Updates provided by:

All information relating to the financial markets available on this page has been prepared and issued by FXStreet (Forexstreet SL, Spain, Reg: B62498233) on the basis of publicly available information and all information believed to be reliable and does not conflict with Kuwaiti local laws, and all necessary care has been taken to before the company to ensure that the facts mentioned are correct from the source.
NCM Investment nor any of its directors or employees shall in any way be held responsible for the contents of this news, and the information contained on this page is intended only to provide clients with publicly available information and should not be construed as investment advice, report or analysis and/or constitute an offer or invitation to buy or sell financial instruments of any kind.
RISK WARNING: Forex and CFDs are highly risky leveraged products, as losses can exceed deposits. Please ensure you understand all the risks and take independent advice if necessary. NCM will segregate the clients based on the criteria of the regulator and its bylaws. NCM does not provide any advisory service; the material published does not constitute advice or a recommendation for a transaction in any financial instrument. NCM accepts no responsibility for any use of the content presented and any consequences of that use. Anyone acting on the information provided does so at their own risk.