
- Contact Us:
-

-

-

-


Daily Market Updates
03 Jul 2023
USDJPY
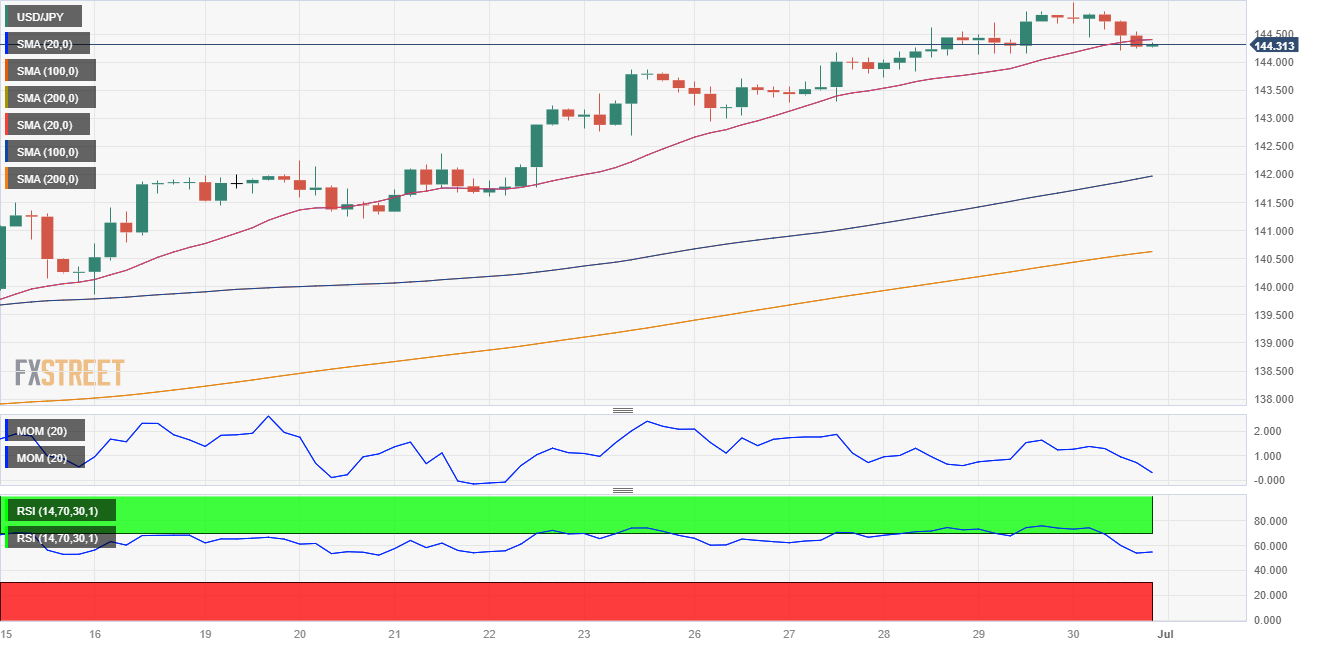
Broad US Dollar weakness pushed USD/JPY into the red on Friday, although the pair retained substantial weekly gains, settling at 144.27. The pair topped 145.06 on the last day of June, its highest since November 2022.
Japan unveiled Tokyo’s inflation figures, which showed that the Consumer Price Index rose by 3.1% YoY in June, below the market’s expectations. The core reading, which excludes volatile food and energy prices, rose by 3.8%, also below the market forecast and in line with easing global price pressures. On a negative note, Industrial Production fell by 1.6% MoM in May, worse than anticipated. Nevertheless, the figures fueled speculation the Bank of Japan is getting closer to phasing out its massive stimulus this year.
Another factor exterminating the fate of USD/JPY is government bond yields. US Treasury yields finished the week with gains, with the 2-year note offering 4.90% and the 10-year note yielding 3.84%. Firmer yields usually underpin the pair.
Given the pair’s strength, local authorities have aired their concerns. Japanese Finance Minister Shunichi Suzuki said FX should “move stably reflecting fundamentals” and added they are closely watching FX moves with a “great sense of urgency.” Japan Chief Cabinet Secretary Hirokazu Matsuno repeated the message later in the day, adding authorities could take appropriate steps on excessive FX moves.
USD/JPY’s latest slide seems a mere correction, as the pair is extremely overbought, according to the daily chart. Nevertheless, there are no signs of an interim top, with bulls still leading the way in the mid-term. The pair has a critical resistance around the 145.00 area, with little relevant once above it until 151.94, October 2022 pak. The corrective decline could continue towards the 142.50 region without affecting the dominant bullish trend, with technical readings in the 4-hour chart supporting such a slide as technical indicators pierced their mid-lines, while USD/JPY settled below its 20 SMA. Still, the longer moving averages maintain their upward strength far below the current level, confirming the wider bullish perspective.
Resistance levels:145.06 146.79 148.45 (4H chart)
Support levels: 144.30 142.50 141.21 (4H chart)
GBPUSD
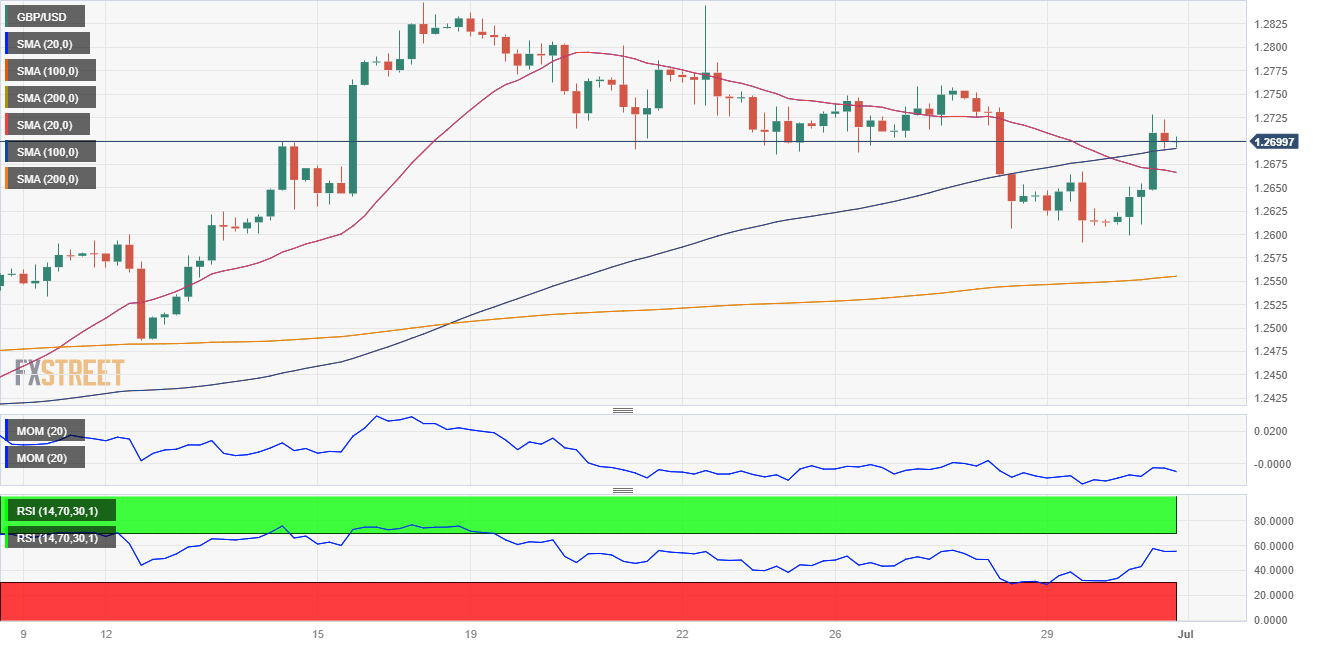
GBP/USD fell through 1.2600 on Friday but changed course ahead of the weekly close. The pair added over 100 pips during the American session to finally settle just below the 1.2700 threshold.
The United Kingdom released the final estimate of the Q1 Gross Domestic Product, which showed the economy grew by 0.1%, as previously estimated. The Annual GDP expanded by 0.2% in the three months to March, matching the market’s expectations. Additionally, the Q1 Current Account arrived at £-10.757B, compared with the previous quarter’s £-2.483B, while Total Business Investment in the same period came in at 3.3% QoQ and 5.8% YoY.
The US Dollar rotated south after softer-than-anticipated United States inflation figures, as the numbers cooled expectations of an aggressive US Federal Reserve. Financial markets expect two more 25 bps rate hikes in the upcoming months, following the central bank’s decision to stay on hold in June.
Technically GBP/USD continues to find support in the 1.2590 area, followed by the 1.2570 region, where it has an ascendant trend line coming from 2021. The daily chart shows that the risk remains skewed to the upside, with the pair holding above a bullish 20 SMA, which advances above the longer ones. At the same time, technical indicators retain their upward strength within positive levels, in line with additional USD weakness. Bulls maintain control in the near term as long as the pair holds above the 100 SMA in the 1.2370 area, with room to extend gains towards the 2023 yearly high at 1.2848.
Resistance levels: 1.2751 1.2848 1.3089 (4H chart)
Support levels: 1.2590 1.2547 1.2486 (4H chart)
AUDUSD
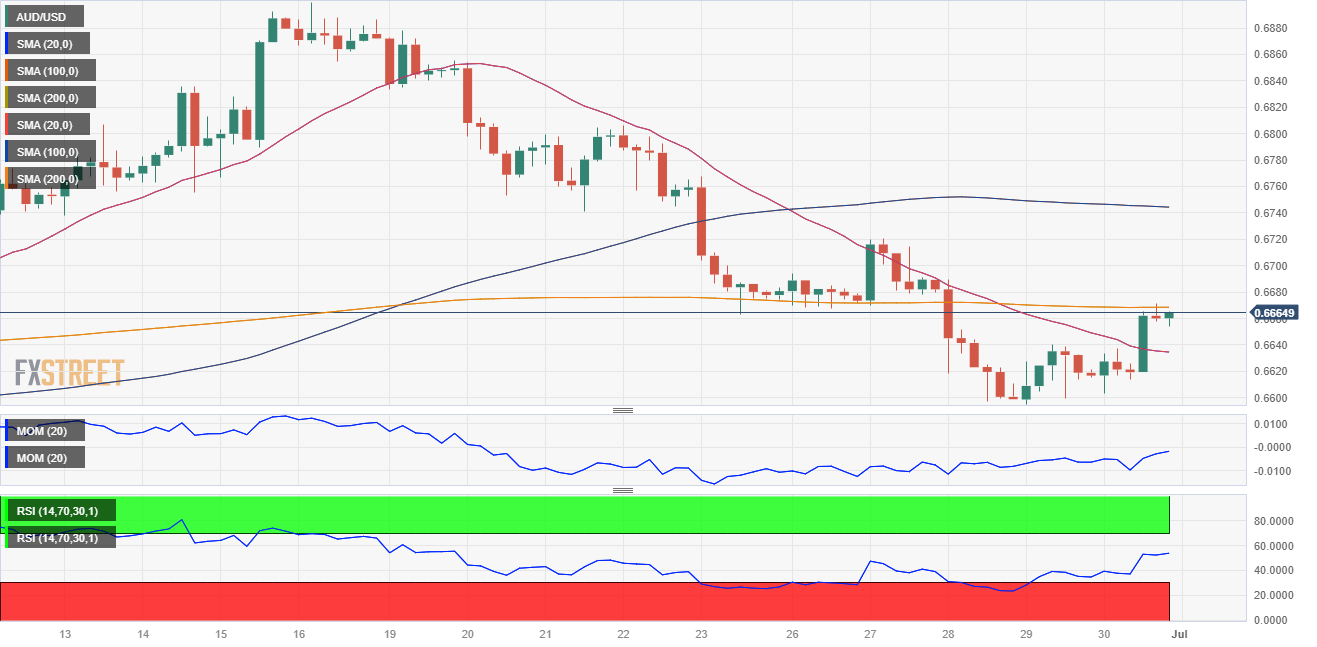
The AUD/USD pair extended its recovery ahead of the weekly close and trades at 0.6654, as broad US Dollar weakness helped the pair to recover some of the ground lost last week.
The Aussie found support in encouraging Chinese data, as the June NBS Manufacturing PMI printed at 49, slightly below the previous 48.8, while the Non-Manufacturing PMI resulted in 53.2, down from the previous 54.5, although better than the 50.8 expected. Concerns about China’s economic growth maintained financial markets on the back foot throughout the first half of the week, although hopes the United States will avoid a recession coupled with signs of Chinese growth cooled fears.
Worth adding that Australian Private Sector Credit increased by 6.2% YoY in May. Next Monday, the country will release the June S&P Global Manufacturing PMI, which is expected to be confirmed at 48.6.
Chances of additional gains in AUD/USD seem limited. The daily chart shows that the pair develops below all its moving averages, while technical indicators barely recovered from near oversold readings, holding within negative levels.
Immediate support can be found at the weekly low of 0.6595 (June 29) before 0.6573 (78.6% Fibonacci retracement level of the June rally) and the 2023 low of 0.6458 (May 31). Down from here comes the November 2022 low at 0.6272 (November 3), seconded by the 2022 low of 0.6169 (October 13). Instead, occasional bullish moves should meet resistance at the weekly top of 0.6720 (June 27) before 0.6801 (23.6% Fibonacci retracement level of the June rally) and the June peak of 0.6899 (June 16). Beyond that lies the critical level of 0.7000, the weekly top of 0.7029 (February 14), and the 2023 peak of 0.7157 (February 2).
Resistance levels: 0.6669 0.6720 0.6801(4H chart)
Support levels: 0.6595 0.6579 0.6458 (4H chart)
GOLD
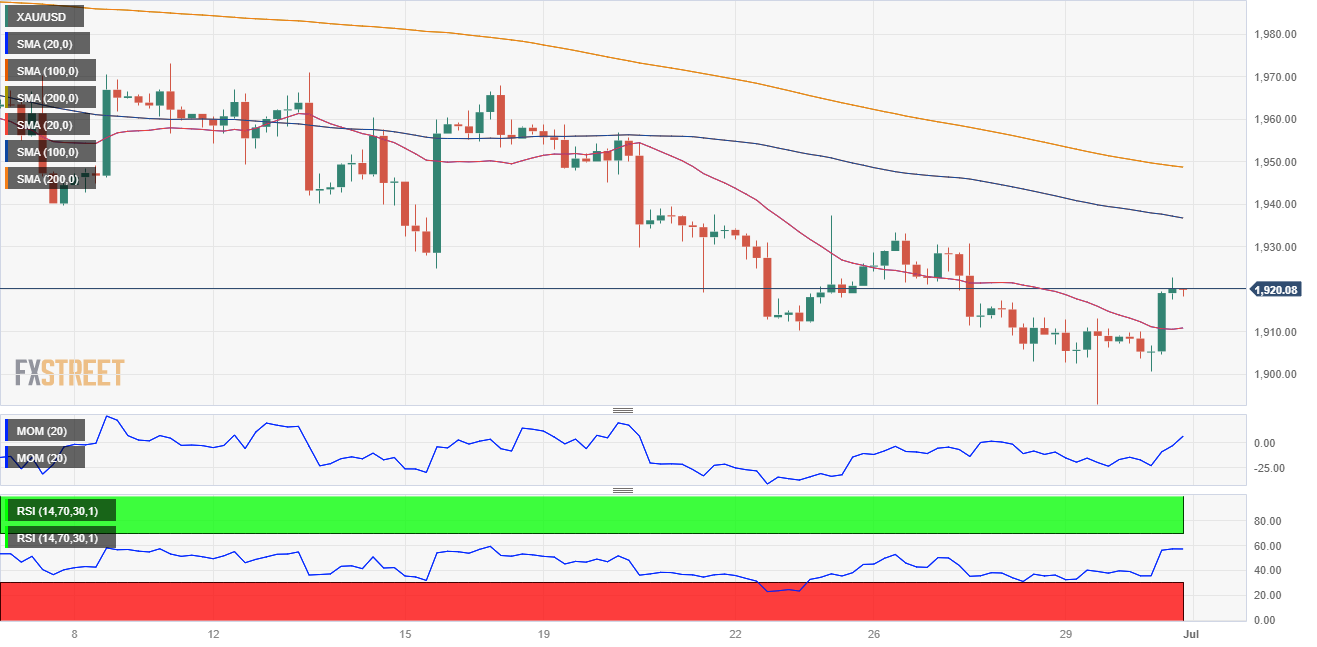
XAU/USD trimmed most of its weekly losses on Friday amid investors dropping the Greenback, with the pair closing at $1,919.27 a troy ounce. Gains were tepid as investors moved into high-yielding assets, dismissing Gold’s safety.
Optimism surged following signs of easing global price pressures and continued growth among major economies, spooking the ghost of steep recessions coming up.
That said, the bullish case for Gold is still out of the picture. The bright metal could advance on broad US Dollar weakness, but gains will likely remain limited amid risk appetite.
From a technical perspective, the daily chart shows that bears are still in control, with technical indicators hovering directionless within negative levels as the pair develops below its 20 and 100 SMAs. Against that, strong support is now seen around the June low of $1893 (June 29) before the key 200-day SMA at $1856 and the 2023 low of $1804 (February 28), which precedes the essential threshold of $1800 per troy ounce. On the flip side, the first impediment is the interim 100-day and 55-day SMAs at $1943 and $1973, respectively, seconded by the June top of $1983 (June 2) and the crucial milestone of $2000. There are no big resistance levels beyond this point until the 2023 peak of $2067 (May 4), which precedes the 2022 high of $2070 (March 8), and eventually the all-time top of $2075 on August 7, 2020.
Resistance levels: $1937 $1953 $1983 (4H chart)
Support levels: $1893 $1885 $1809 (4H chart)
CRUDE WTI
West Texas Intermediate (WTI) retained its positive momentum and advanced for a third consecutive day, currently changing hands at $70.42 a barrel. A USD Dollar sell-off and a drop in American stockpiles provided modest impetus to the commodity.
Baker Hughes reported that the number of active US rigs drilling for oil fell by 1 to 545 last week. The total active US rig count, which includes those drilling for natural gas, declined by 8 to stand at 674, according to the same report, resulting in a third consecutive weekly decline in active drilling rigs.
The black gold has been confined to a tight $8 range since early May, and there are no signs it could leave it anytime soon, as financial markets are finally seeing some stability on easing concerns about a global setback.
WTI is technically neutral according to the daily chart, although with increased chances of a bearish extension in the near future. At the time being, WTI hovers around a mildly bearish 20 SMA while below the longer ones, which also aim south. In the meantime, technical indicators are around their midlines without clear directional strength. The black gold could find support at the $70 threshold, followed by the June low of $66.86 (June 13). Next comes the 2023 low of $63.61 (May 4), the December 2021 low of $62.46 (December 2) and the critical level of $60.00 per barrel. Conversely, additional momentum could see the price test the June high of $74.92 (June 5), supported by the proximity of the temporary 100-day SMA at $74.04. Further up, the 200-day SMA emerges at $77.63, seconded by the weekly top at $79.14 (24 April) and the important barrier at $80.00 per barrel. The breakout above the latter suggests a rise to the 2023 high at $83.49 (12 April) before reaching the November 2022 peak at $93.73 (7 November).
Resistance levels: $70.00 $66.86 $63.61 (4H chart)
Support levels: 72.70 $74.92 $77.63 (4H chart)

GER40
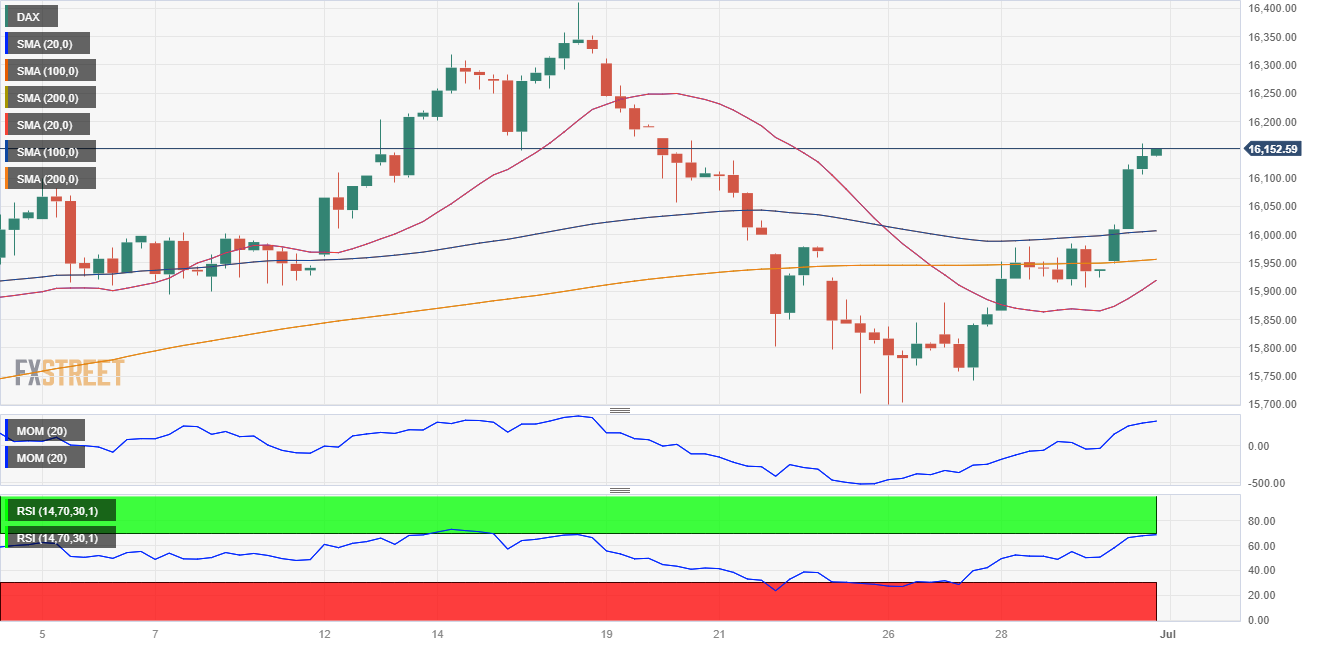
The German DAX resumed its advance on Friday, adding 1.26% or 201 points to settle at 16,147.90. The DAX found support in the positive mood that flooded financial markets following better-than-anticipated European and American inflation figures.
The German Harmonized Index of Consumer Prices, released earlier in the week, rose by 6.8% YoY in June compared to 6.3% in May and analysts' estimate of 6.7%, spurring concerns and driving the index lower on Thursday. Nevertheless, the Eurozone HICP decreased sharply in the same period to 5.5% from the previous 6.1%, triggering relief rallies among global stocks.
The DAX recovery is set to continue according to technical readings in the daily chart, as the index regained ground above a bullish 20 SMA, while the longer moving averages continue to advance far below the shorter one. The upward momentum is also supported by the RSI, which heads firmly higher at around 59.
The index is on its way to retesting its all-time high of 16427 (June 16), while further gains should see a test of the 17000 threshold. In the opposite direction, the index should encounter early resistance around the weekly low of 15713 (June 26) before the interim 100-day SMA at 15685 and the May low of 15629 (May 31). Further losses may result in a return to the April low of 15482 (April 5), followed by minor support at 14809 (March 24) and the key 200-day SMA at 14773 before the March low of 14458 (March 20).
Best Performers: Sartorius AG, Infineon Technologies, Siemens Energy
Worst Performers: RWE AG, Deutsche Telekom, Bayer
Resistance levels: 16427 17000 17350 (4H chart)
Support levels: 15864 15713 15629 (4H chart)
NASDAQ
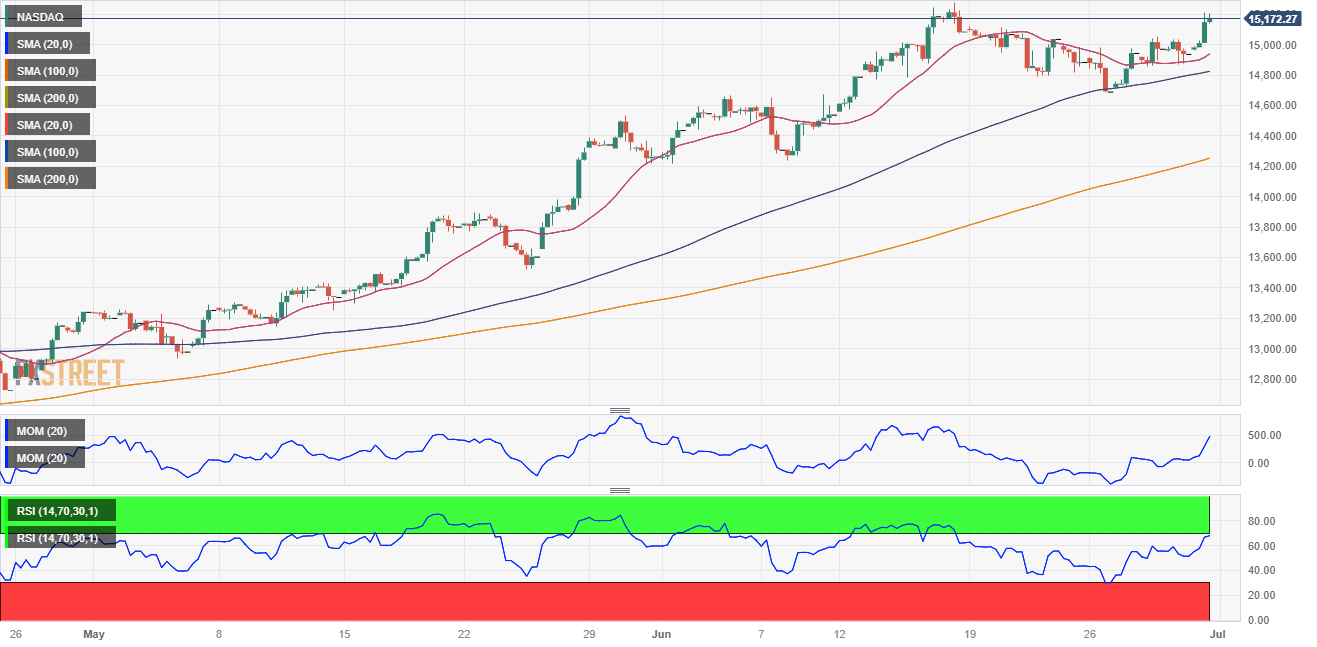
The Nasdaq Composite added roughly 200 points on Friday to close at 14,787.92, posting its best-ever first half-of-year performance on record. Technology-related shares led the way higher, with the index adding nearly $5 trillion in the six months to June, despite mounting bubble concerns.
Speculative interest seems now more concerned with being left behind rather than with a potential recession that seems less likely as time goes by. Easing United States inflation clearly points in the right direction, as it means the end of the monetary tightening cycle is around the corner, even though the Federal Reserve hinted at potentially two more rate hikes this year.
The Nasdaq is bullish and on its way to beating this year's high. The daily chart shows that the index moved further above a bullish 20 SMA while the longer moving averages advance far below the shorter one. Technical indicators, in the meantime, resume their advances with plenty of room before reaching overbought conditions. The Nasdaq has immediate resistance at the 2023 high of 15284 (June 16) before aiming for the round level of 16000. Just the opposite, the first level of support is expected at the weekly lows of 14687 (June 26) and 14283 (June 7), followed by the provisional 55-day SMA at 13876 and then another weekly low of 13520 (May 24). A more substantial pullback could result in a revisit to the May low of 12938 (May 4), followed by the April low of 12724 (April 25), the 200-day SMA at 12347, and the March low of 11695 (dated March 13).
Top Gainers: Dollar Tree, PepsiCo, AstraZeneca
Top Losers: Amazon, Vertex Pharmaceuticals, Applied Materials
Resistance levels: 15284 16017 16480 (4H chart)
Support levels: 15051 14687 14283 (4H chart)
DOW JONES
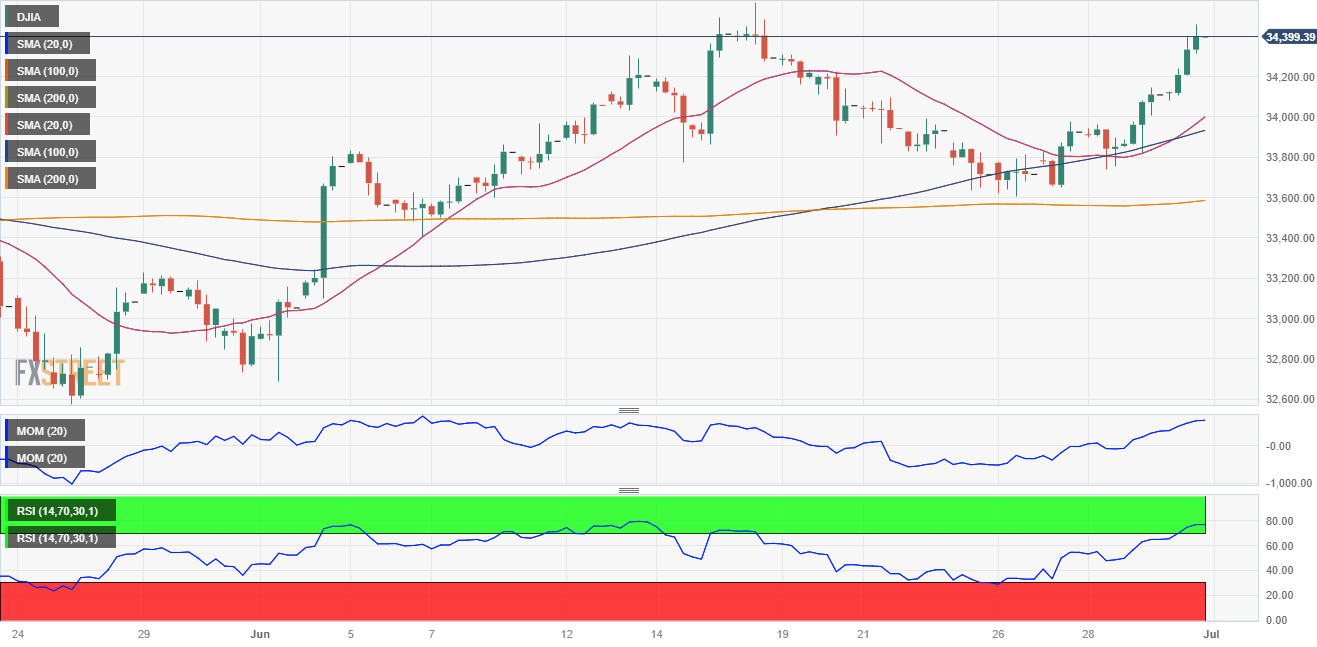
The Dow Jones Industrial Average finished June at 34,407.60, adding 285 points on Friday and roughly 2% monthly. The DJIA traded as high as 34502, but profit-taking ahead of the close pushed it 100 points lower ahead of the close.
US indexes finished the first half of the year with substantial gains, as market players welcomed easing US inflation and lifted their bets, led by mega-cap techs. Apple became the first company to hit $3 trillion in valuation, pushing the sector firmly up amid the rise of artificial intelligence.
Bulls are willing to push the index higher, according to technical readings in the daily chart. The Dow develops well above bullish moving averages, with the 20 SMA firmly advancing above the longer ones. The Momentum indicator stands directionless within neutral levels, although the RSI aims firmly north at around 62, anticipating a bullish continuation.
The Dow Jones is en route to clear the 2023 peak of 34588 (June 16) prior to the December 2022 high at 34712 (December 13) and the April 2022 top at 35492 (April 21). The other way around, the weekly low of 33610 (June 26) emerges as the initial support seconded by the interim 100-day SMA at 33357 and the significant 200-day SMA at 32897. Down from here, potential support levels include the May low of 32586 (May 25), the 2023 low of 31429 (March 15) and the 2022 low of 28660 (October 13).
Best Performers: Visa, Microsoft, Apple
Worst Performers: Nike, Boeing, Goldman Sachs, IBM
Resistance levels: 34588 34712 35492 (4H chart)
Support levels: 33610 33352 32586 (4H chart)
MACROECONOMIC EVENTS

All Information & Updates provided by:

All information relating to the financial markets available on this page has been prepared and issued by FXStreet (Forexstreet SL, Spain, Reg: B62498233) on the basis of publicly available information and all information believed to be reliable and does not conflict with Kuwaiti local laws, and all necessary care has been taken to before the company to ensure that the facts mentioned are correct from the source.
NCM Investment nor any of its directors or employees shall in any way be held responsible for the contents of this news, and the information contained on this page is intended only to provide clients with publicly available information and should not be construed as investment advice, report or analysis and/or constitute an offer or invitation to buy or sell financial instruments of any kind.
RISK WARNING: Forex and CFDs are highly risky leveraged products, as losses can exceed deposits. Please ensure you understand all the risks and take independent advice if necessary. NCM will segregate the clients based on the criteria of the regulator and its bylaws. NCM does not provide any advisory service; the material published does not constitute advice or a recommendation for a transaction in any financial instrument. NCM accepts no responsibility for any use of the content presented and any consequences of that use. Anyone acting on the information provided does so at their own risk.