
- Contact Us:
-

-

-

-


Daily Market Updates
04 Jul 2023
USDJPY
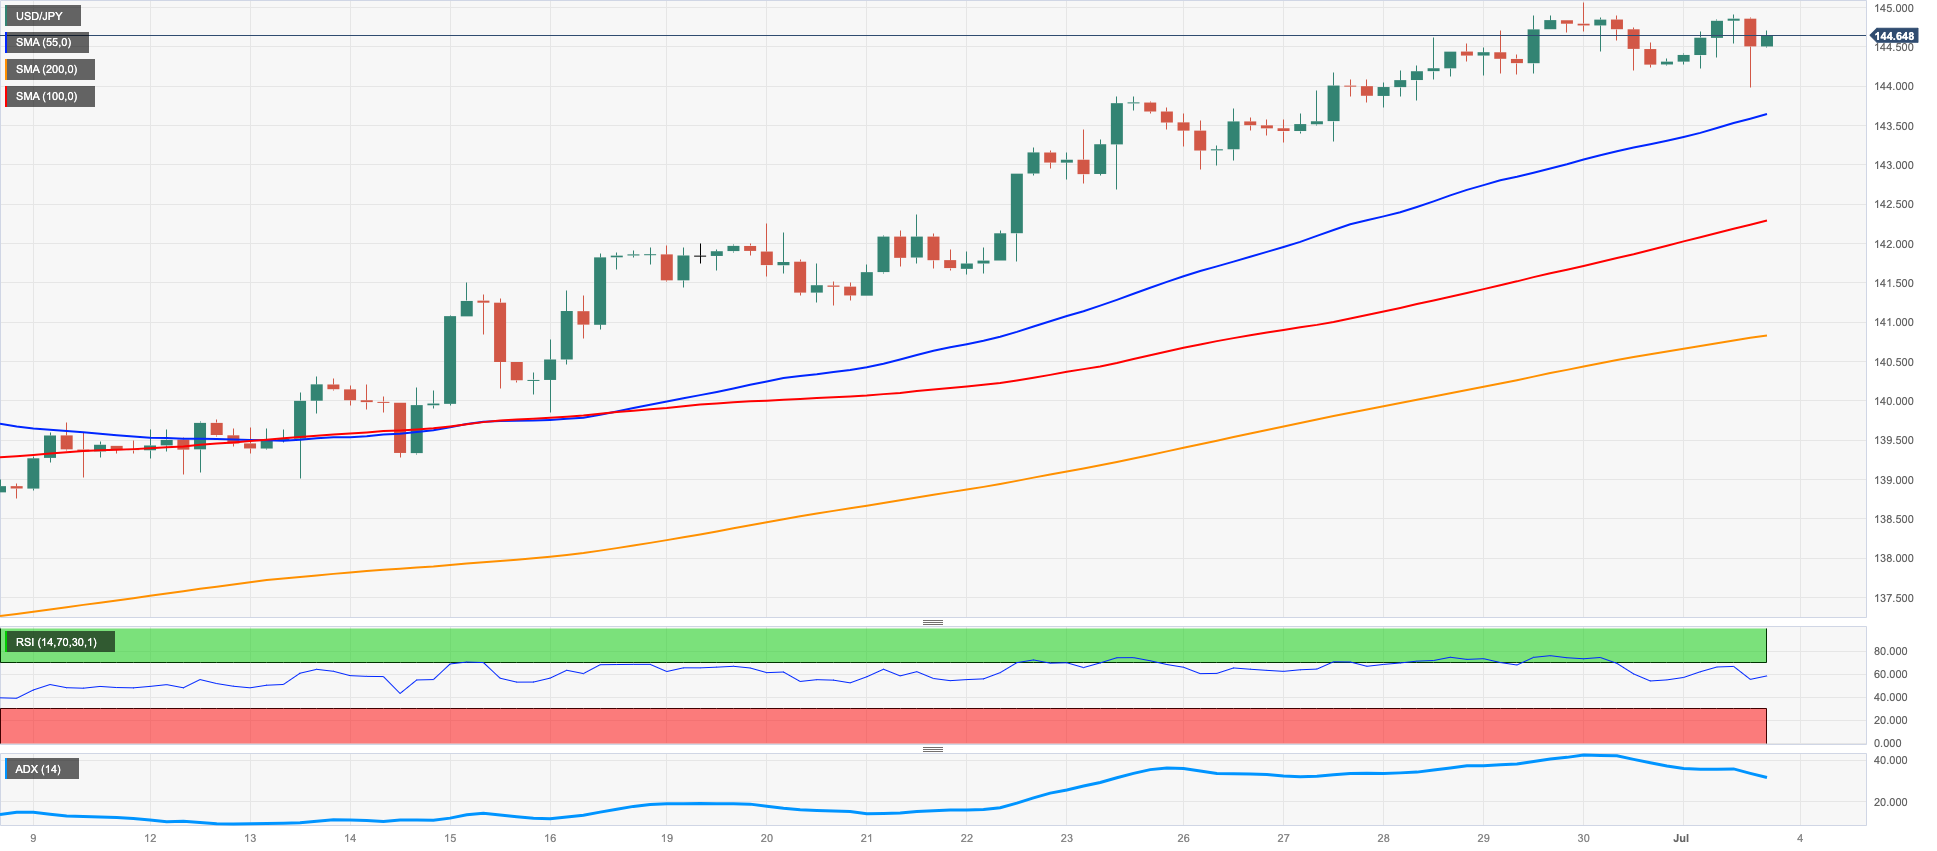
USD/JPY resumed the uptrend and quickly left behind Friday’s downtick. It is worth noting that the pair came under pressure last Friday soon after hitting new tops for the current year in the area just above the 145.00 yardstick.
Monday’s decent gains came on the back of the tepid bounce in the greenback and the small advance in US yields across the curve, which managed to set aside the knee-jerk in the wake of disheartening print from the US ISM Manufacturing PMI for the month of June.
Moving forward, the persistent policy divergence between the Federal Reserve and the Bank of Japan (BoJ) is expected to continue supporting the pair for the time being.
In Japan, the Tankan survey for Q2 exceeded expectations in all of its components, with the Large All Industry Capex rising 13.4%, the Large Manufacturers Index improving to 5, the Large Manufacturing Outlook rising to 9, and the Large Non-Manufacturing Index advancing to 23.
So far, the USD/JPY is likely to continue its strong performance, with numerous major resistance levels highlighted, including the 2023 high of 145.07 (June 30), the October 2022 top of 151.94 (octo 21), and the psychological threshold of 152.00. On the flip side, the immediate support level is at the June low of 138.42, with additional support at the critical 200-day SMA of 137.22. If the USD/JPY falls further, the interim 100-day SMA of 136.38, the weekly low of 133.01, and the minor support level of 132.01 will likely provide additional support. Further south emerges the April low of 130.62 (April 5) prior to the critical support at 130.00. The daily RSI remained near 73, indicating that the market is still overbought.
Resistance levels: 145.07 146.79 148.45 (4H chart)
Support levels: 143.98 142.64 141.21 (4H chart)
GBPUSD
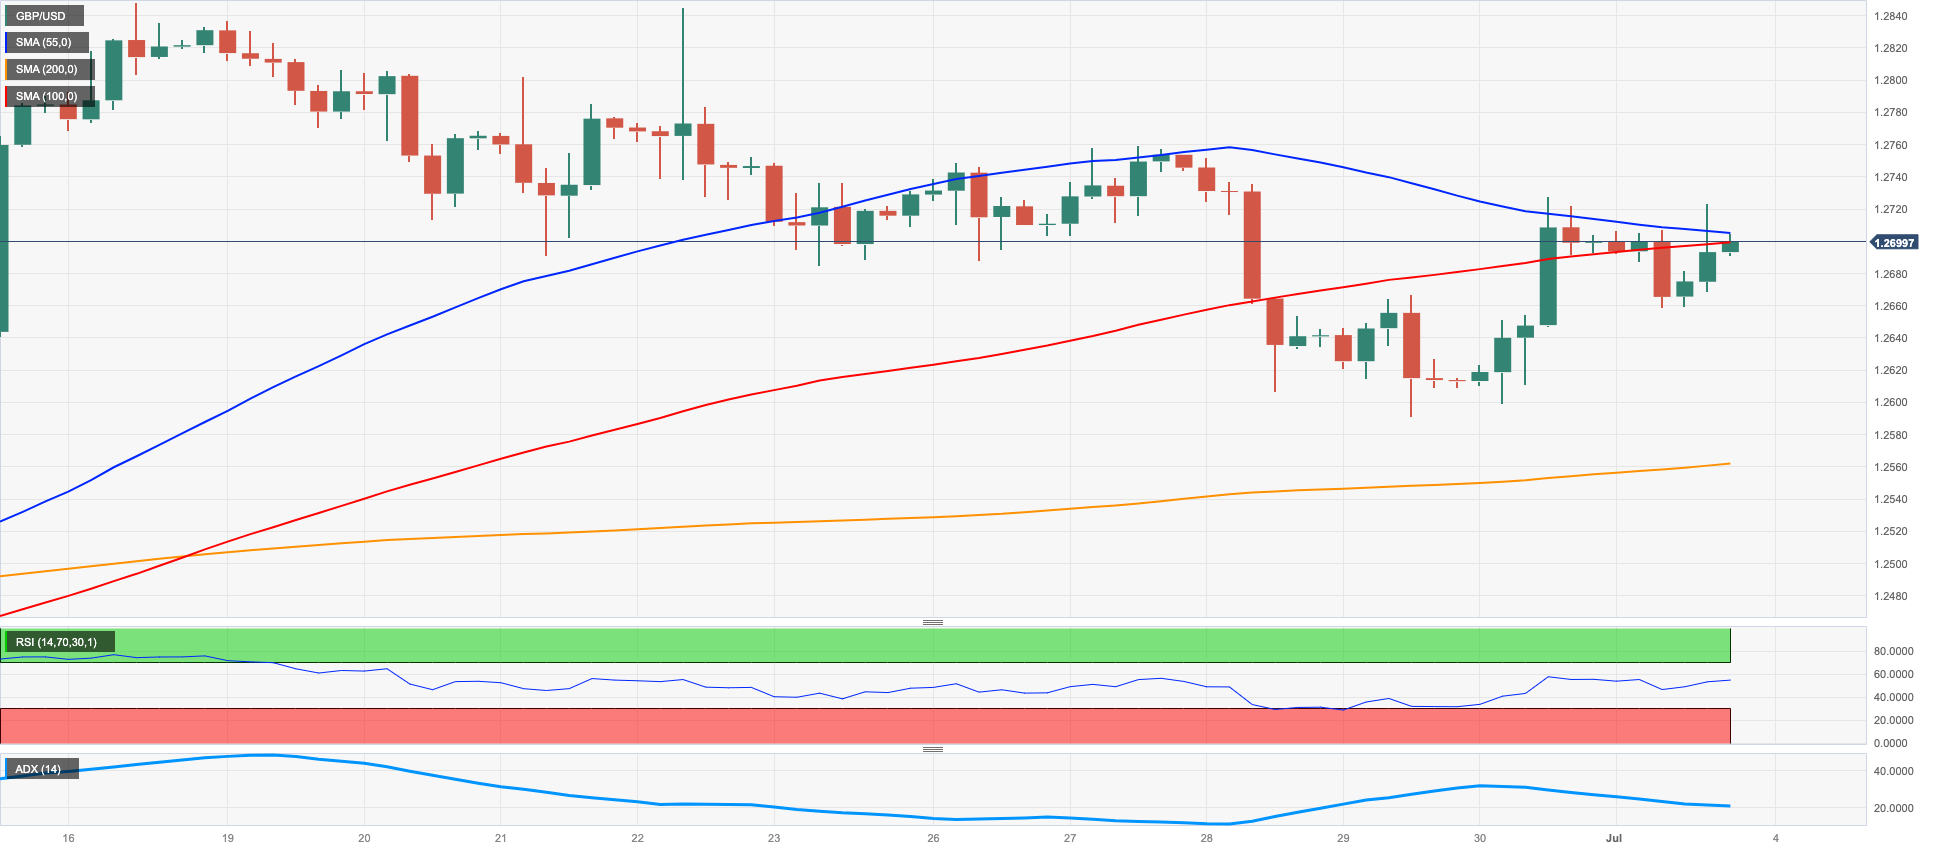
The GBP/USD continued to rise on Friday and broke through the 1.2700 barrier due to a loss of momentum in the US dollar.
The US dollar, as measured by the USD Index (DXY), initially gained but then gave up its gains in response to a weaker-than-expected ISM Manufacturing PMI in June. The absence of a clear direction in US yields across the board also contributed to the selling pressure on the dollar.
In the UK, the S&P Global/CIPS Manufacturing PMI, which is always significant, dropped to 46.5 in June according to the final readings, down from 47.1.
In terms of support and resistance levels for GBP/USD, the immediate support lies at the weekly low of 1.2590 (June 29), followed by the 1.2570 region where the trendline from 2021 to 2023 is situated. Additionally, the interim 55-day SMA at 1.2541 and the June low of 1.2368 (June 5) could provide support. Beyond that, the May low at 1.2308 (May 25) and the April low at 1.2274 (April 3) are expected to come into focus ahead of the crucial 200-day SMA at 1.2120. On the other hand, if the pair manages to surpass the 2023 high of 1.2848 (June 16), it may potentially test the 200-week SMA at 1.2879 before reaching the psychological level of 1.3000. The daily RSI appeared stable near 56.
Resistance levels: 1.2751 1.2848 1.3089 (4H chart)
Support levels: 1.2590 1.2557 1.2486 (4H chart)
AUDUSD
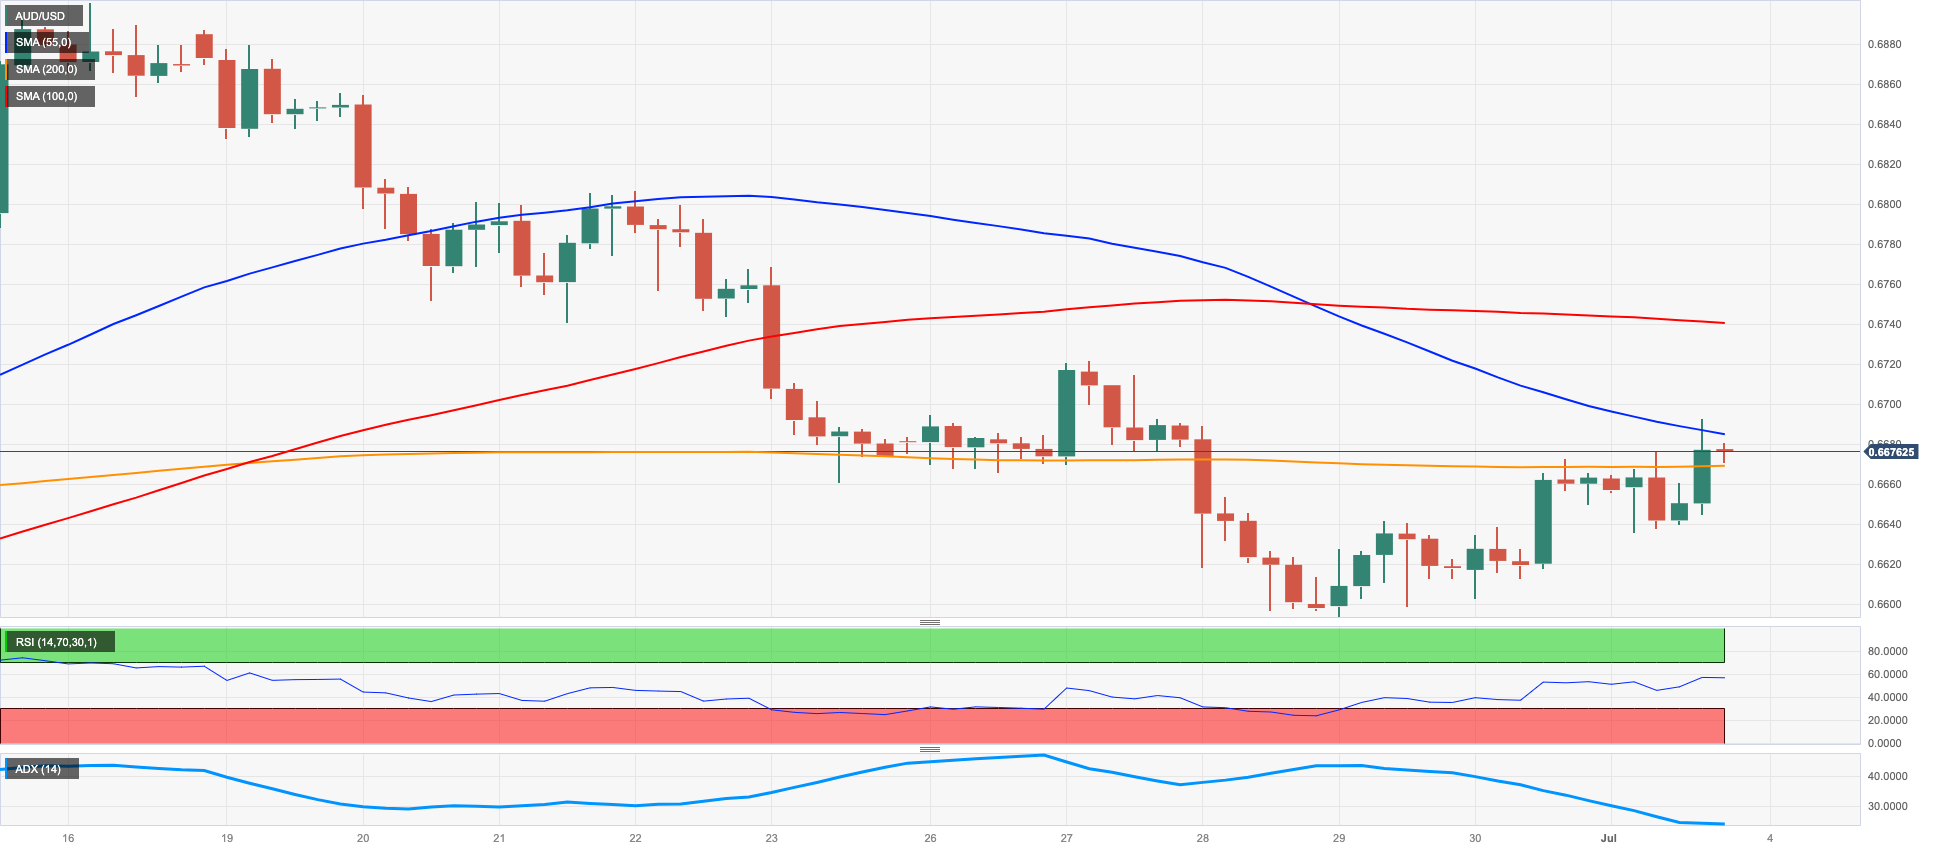
At the start of the week, the positive sentiment surrounding the Australian dollar remained strong.
In light of this, AUD/USD achieved its third consecutive daily gain and briefly approached the important 200-day SMA around the 0.6690 zone, marking the daily highs.
Despite the US dollar making modest gains, the upward movement in the AUD/USD pair was supported by solid results from the Chinese Caixin Manufacturing PMI in June, which came in at 50.5. However, the mixed performance in the commodity market seemed to limit the upside potential.
In Australia, the final reading of the Judo Bank Manufacturing PMI for June showed a slight decrease to 48.2. Additionally, flash Building Permits are expected to have increased by 20.6% month-on-month in May, while Home Loans rose by 4.0% during the same period. Investment Lending for Homes also experienced a monthly rise of 6.2% in May.
A more serious recovery needs AUD/USD to surpass the weekly top at 0.6720 (June 27) before reaching 0.6801 (23.6% Fibonacci retracement level of the June rally) and the June high of 0.6899 (June 16). Beyond that are the critical 0.7000 level, the weekly top of 0.7029 (February 14) and the 2023 peak of 0.7157 (February 2). Just the opposite, the breakdown of the weekly low of 0.6595 (June 29) could open the door to a deeper decline to, initially, 0.6573 (78.6% Fibonacci retracement level of the June rally) ahead of the 2023 low of 0.6458 (May 31). Down from here aligns the November 2022 low of 0.6272 (November 3) and the 2022 low of 0.6169 (October 13).
Resistance levels: 0.6691 0.6720 0.6806 (4H chart)
Support levels: 0.6595 0.6579 0.6458 (4H chart)
GOLD
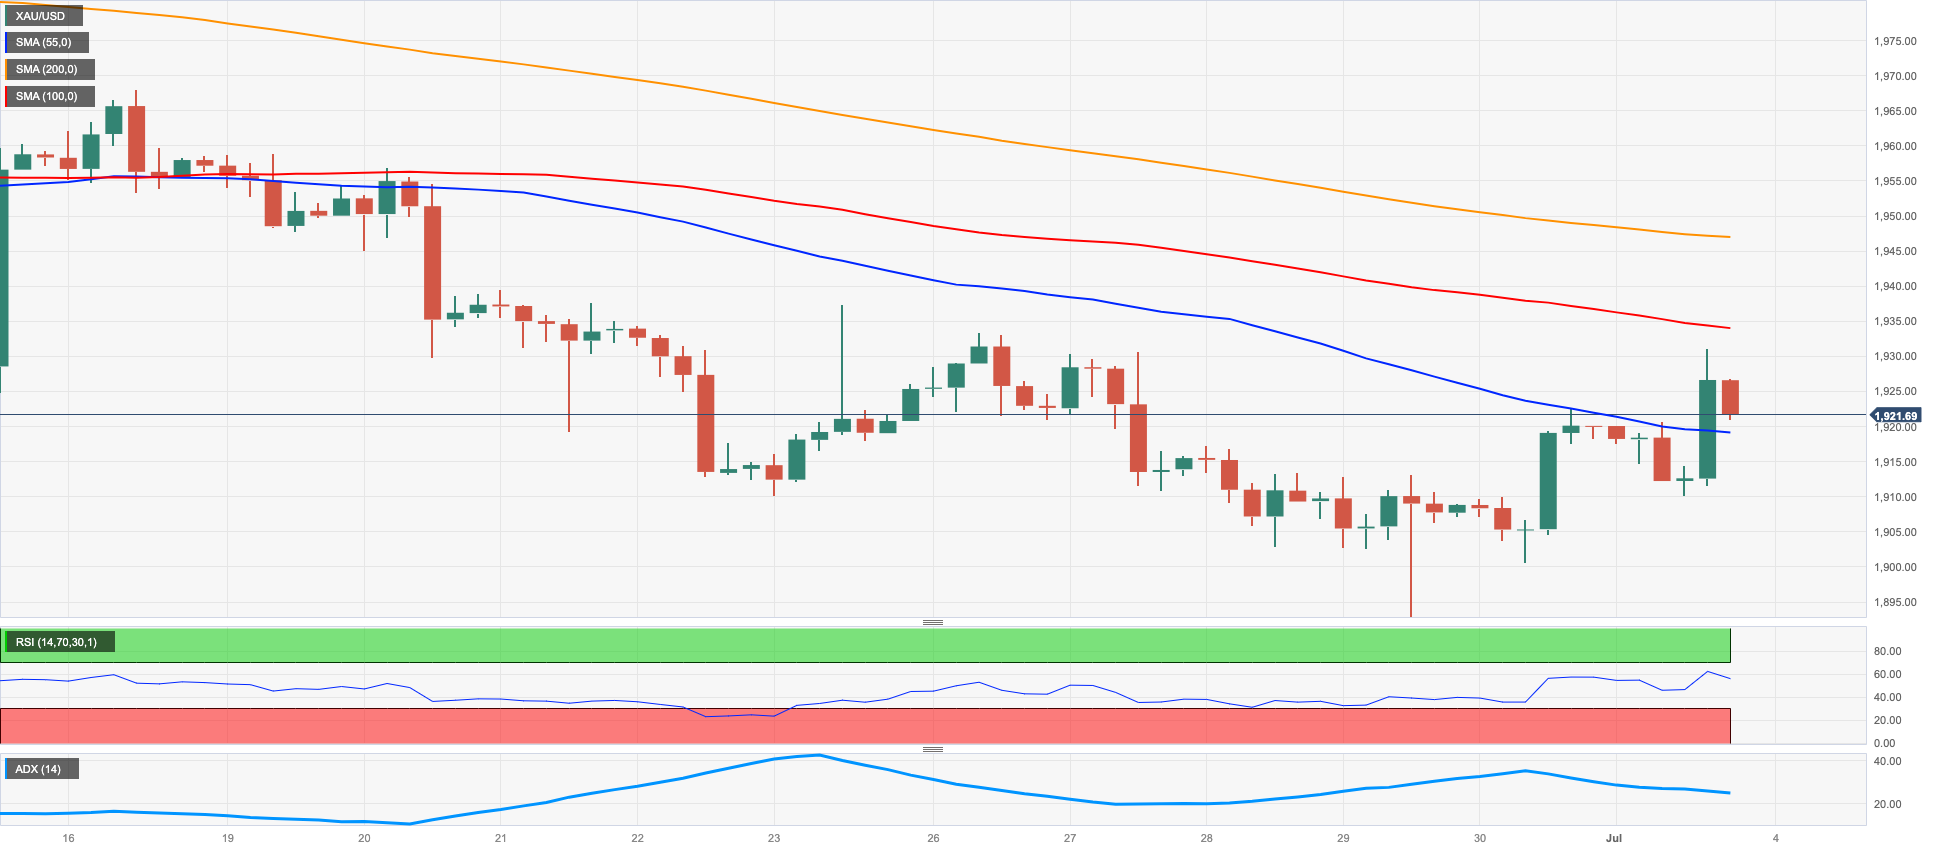
Gold prices continued their upward momentum on Monday, marking the third consecutive daily gain and surpassing the $1930 level, which represents multi-day highs. The fluctuating performance of the US dollar played a role in supporting these gains.
Furthermore, gold received additional impetus to bounce back from its recent multi-week lows below the $1900 level on June 29. This was attributed to the lack of a clear trend in US yields across the yield curve.
However, moving forward, gold is expected to face increasing challenges due to the intentions of central banks to maintain a tightening monetary policy in their efforts to address persistently high levels of inflation.
Gold prices keeps the recovery mode in place so far. That said, the first obstacle is the transitory 100-day and 55-day SMAs at $1945 and $1970, respectively, followed by the June top at $1983 (June 2) and the crucial milestone at $2000. Beyond that, there is no major resistance until the 2023 high of $2067 (May 4), which precedes the 2022 high of $2070 (March 8), and finally the all-time high of $2075 on August 7, 2020. By contrast, immediate support is provided by the June low of $1893 (June 29) ahead of the important 200-day line SMA at $1859 and the 2023 low of $1804 (February 28) ahead of the important $1800 threshold per troy ounce.
Resistance levels: $1931 $1948 $1983 (4H chart)
Support levels: $1893 $1885 $1809 (4H chart)
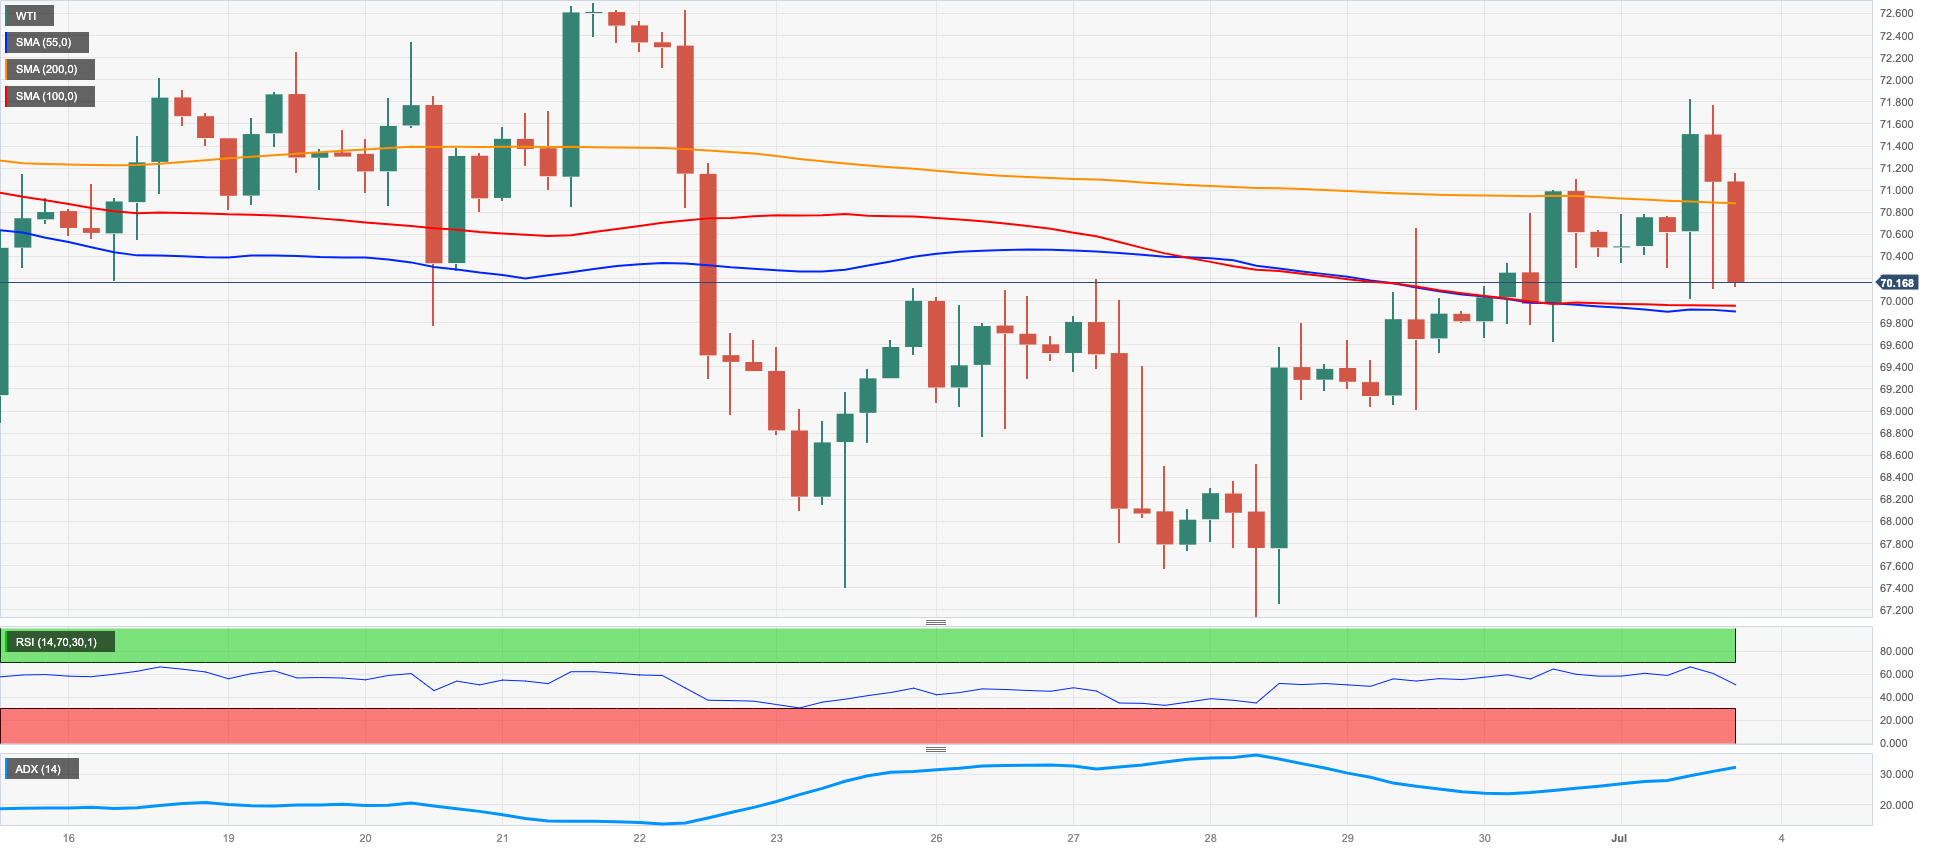
CRUDE WTI
The price of a barrel of West Texas Intermediate (WTI) halted three daily gains in a row on Monday. The commodity briefly reached new multi-day highs above the $71.00 mark, although it surrendered those gains and retreated to the $70.00 neighbourhood as the NA session drew to a close.
This initial increase in commodity prices was mainly due to Russia's announcement that it will reduce its oil exports by 500 kbpd in August, in addition to Saudi Arabia's decision to decrease its oil output by one million bpd during the same period.
The inconclusive price action in the US dollar ahead of the Independence Day holiday on Tuesday and cautiousness ahead of key releases in the US docket later in the week also added to the heavy trade around WTI.
Later in the session, the American Petroleum Institute (API) and the Energy Information Administration (EIA) will release their reports on US crude oil inventories for the week ending on June 30th, on Wednesday and Thursday, respectively.
Immediately to the upside in WTI comes the weekly high at $72.68 (June 21) followed by the June high of $74.92 (June 5). Further up, the 200-day SMA at $77.48 comes next seconded by the weekly top of $79.14 (24 April) and the significant barrier of $80.00 per barrel. The break above the latter predicts a climb to the 2023 high of $83.49 (April 12), followed by a rise to the November 2022 top of $93.73 (November 7). On the opposite side, WTI faces the next support at the June low of $66.86 (June 13) prior to the 2023 low of $63.61 (May 4), the December 2021 low of $62.46 (December 2), and the key level of $60.00 per barrel.
Resistance levels: $71.72 $72.68 $74.92 (4H chart)
Support levels: $67.01 $66.77 $63.71 (4H chart)
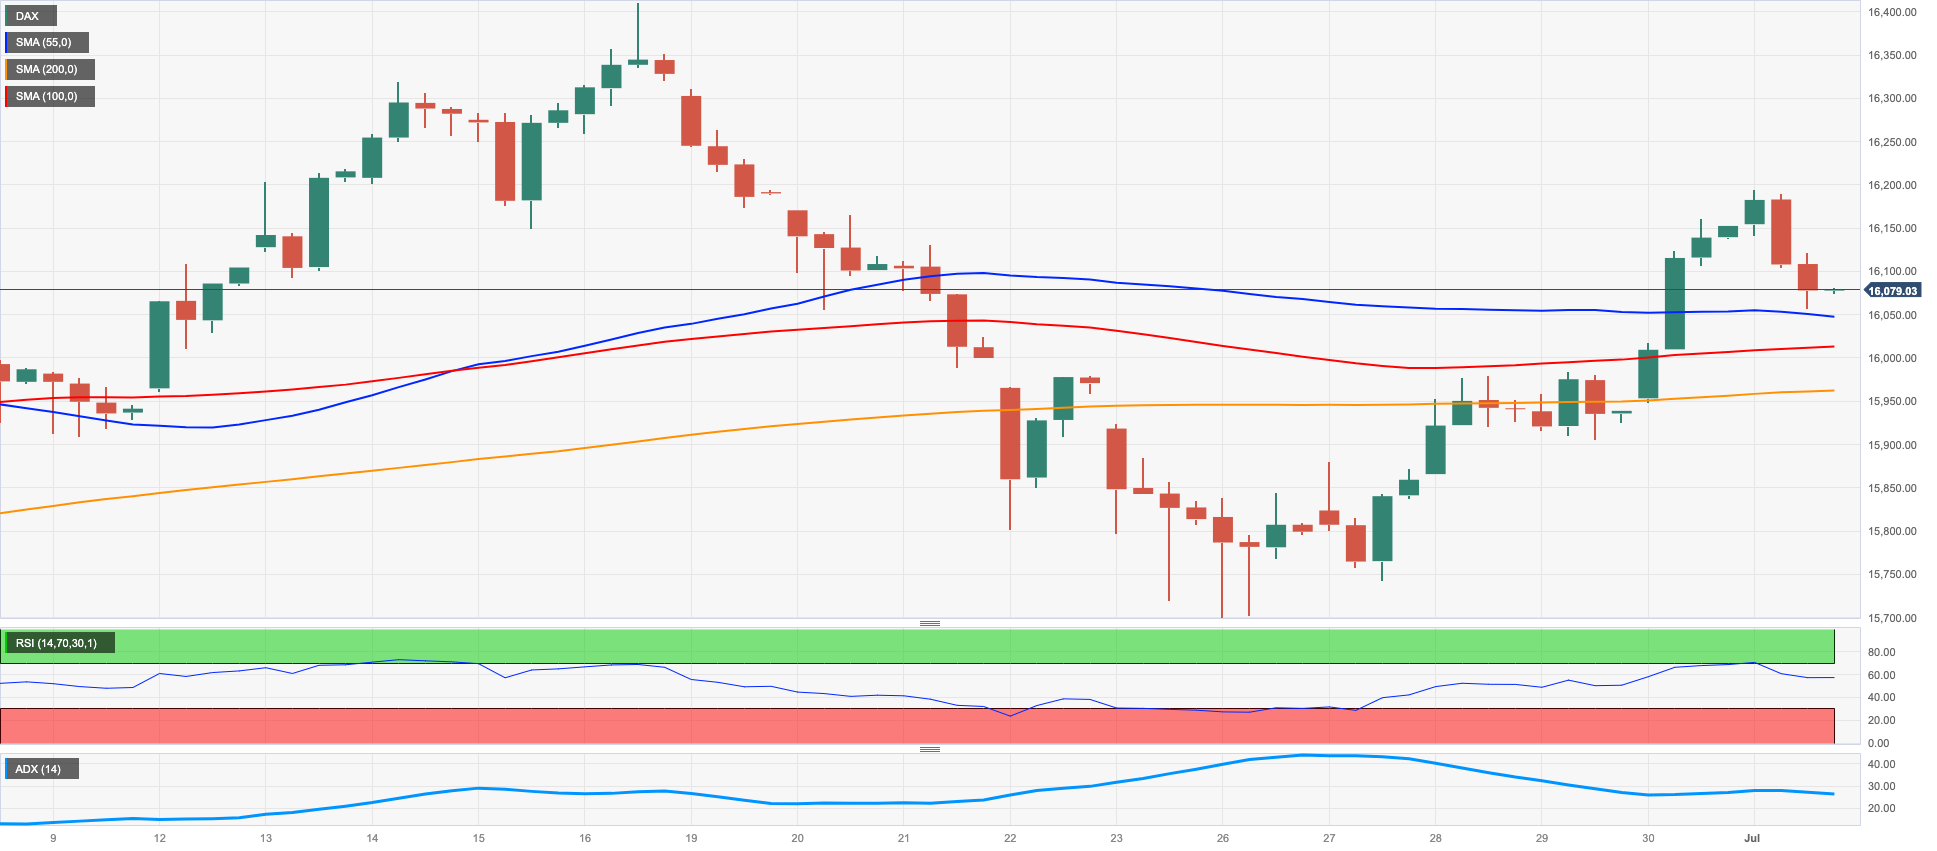
GER40
German stocks represented by the DAX40 index started the new trading month in a defensive manner, although they managed to close above the important 16000 level on Monday.
However, the index was unable to sustain its initial strength and later succumbed to selling pressure. This downward pressure was driven by growing caution among investors ahead of the release of the US jobs report on Friday.
Furthermore, investor sentiment was weighed down by the prospects of the European Central Bank (ECB) continuing its tightening campaign. It is widely expected that the ECB will raise rates by 25 bps in July.
In the domestic money market, the yield on 10-year German government bonds (bunds) experienced a slight increase and approached the 2.45% level.
Regarding economic data in Germany, the final reading of the Manufacturing PMI for June came in slightly lower than the preliminary readings, at 40.6 compared to 43.2.
The next up-barrier for the DAX40 emerges at the weekly high of 16209 (July 3) ahead of the all-time top of 16427 (June 16). If sellers regain control, the first target for the index would be the weekly low of 15713 (June 26), which appears supported by the interim 100-day SMA at 15700. Down from here comes the May low of 15629 (May 31) prior to the April low at 15482 (April 5), the minor support at 14809 (March 24) and the significant 200-day SMA at 14807. The next level would be the March low at 14458 (March 20). The daily RSI receded slightly to the 53 zone.
Best Performers: Vonovia, Fresenius SE, RWE AG ST
Worst Performers: Continental AG, Porsche, Siemens Ag
Resistance levels: 16209 16427 17000? (4H chart)
Support levels: 15895 15713 15629 (4H chart)
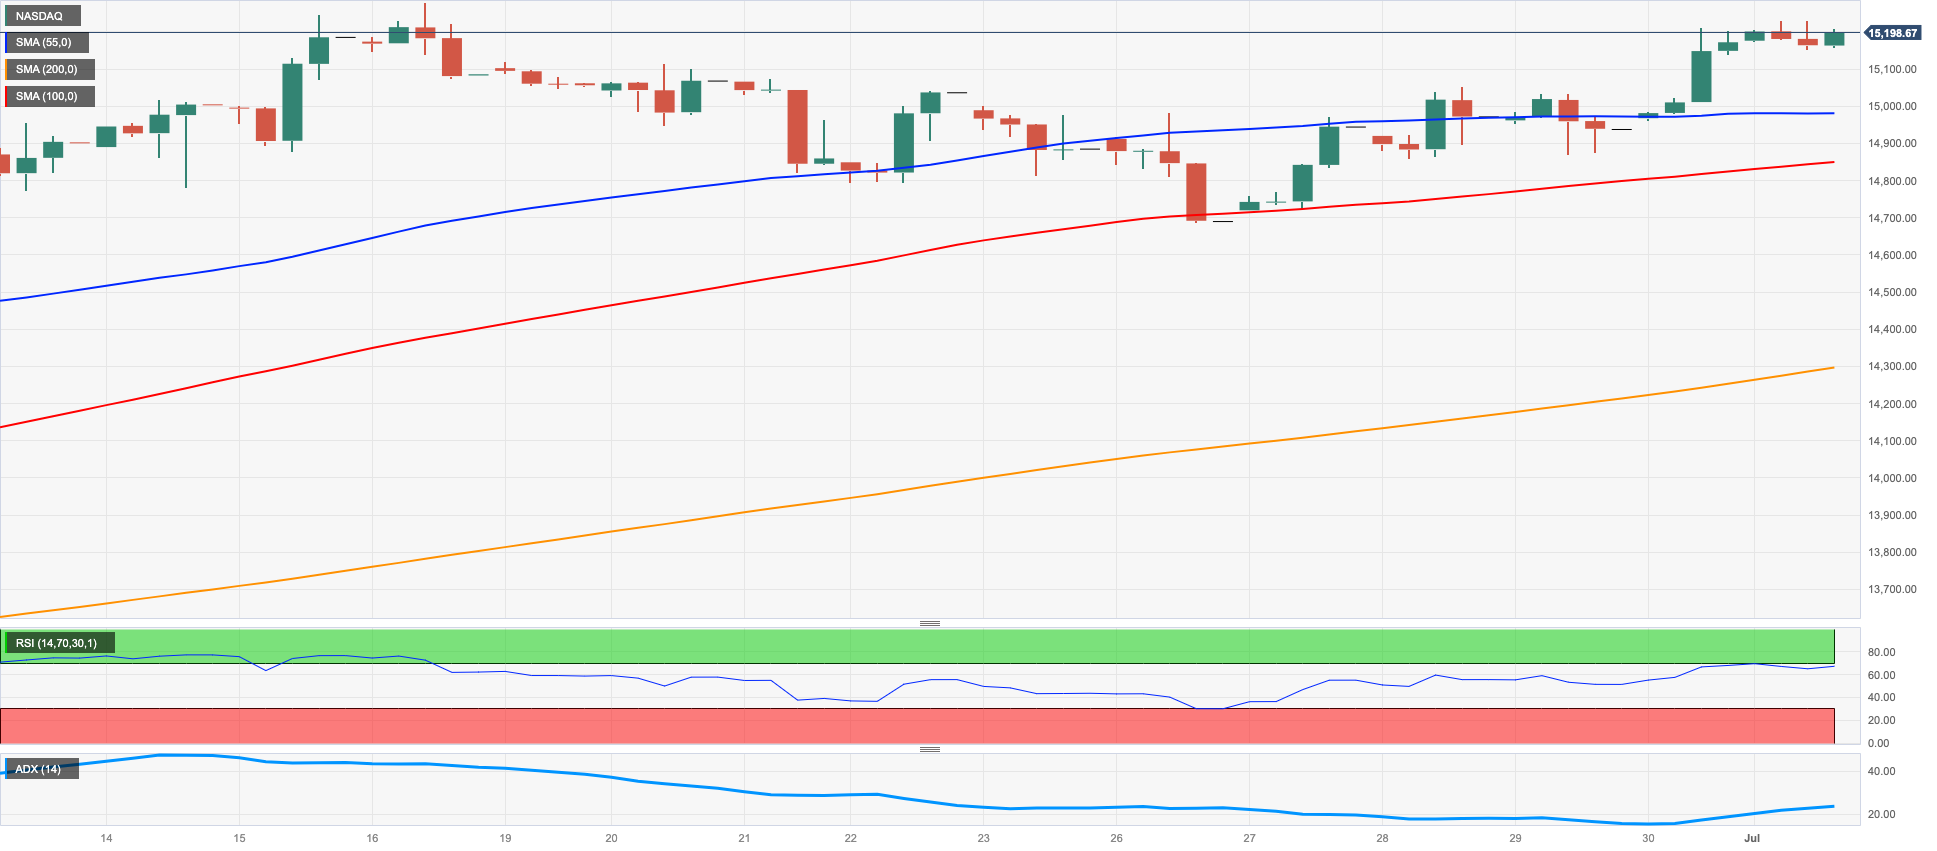
NASDAQ
At the start of the week, technology stocks represented by the Nasdaq 100 index reached multi-day highs around the 15200 level.
The upward movement in the index was driven by the strong performance of Tesla, as the electric vehicle manufacturer surprised investors with higher-than-anticipated vehicle deliveries in the April-June period.
The absence of a clear trend in the US dollar, along with relatively stable activity in US yields, also contributed to the decent gains in the index.
If bulls push harder, the Nasdaq 100 would face an immediate hurdle at the 2023 high of 15284 (June 16) before reaching the round level of 16000. On the other hand, there is an initial support at the weekly lows of 14687 (June 26) and 14283 (June 7), followed by the temporary 55-day SMA at 13957, and then another weekly low of 13520 (May 24). A more significant decline might result in a return to the May bottom of 12938 (May 4) ahead of the April low of 12724 (April 25), the 200-day SMA at 12378, and the March low of 11695 (March 13). The daily RSI improved marginally to the proximity of 67.
Top Gainers: Lucid Group, Tesla, Warner Bros Discovery
Top Losers: AstraZeneca ADR, Align, IDEXX Labs
Resistance levels: 15232 15284 16017 (4H chart)
Support levels: 14687 14283 13520 (4H chart)
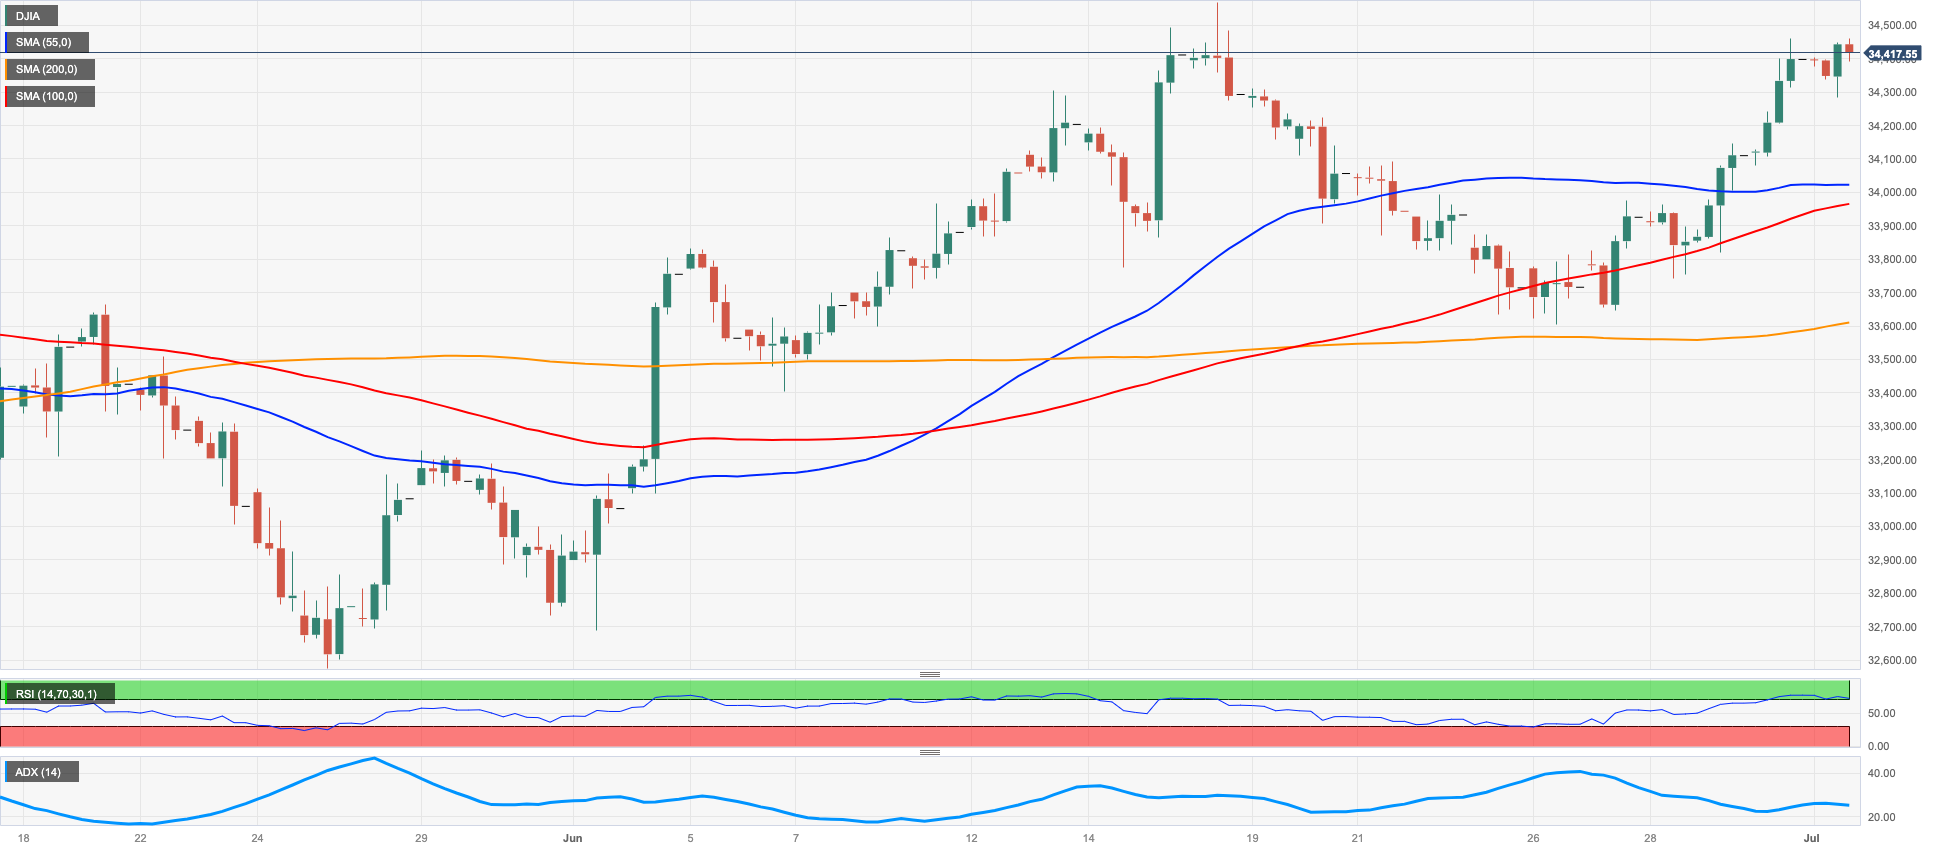
DOW JONES
On Monday, the Dow Jones stock index ended the session around the same levels as Friday's close, in the 34400 region.
The lack of a clear direction ahead of the Independence Day holiday on Tuesday, as well as cautiousness ahead of the release of the FOMC Minutes on Wednesday and the US jobs report for June on Friday, contributed to the low volatility at the beginning of the week.
All in all, the Dow Jones gained 0.03% to 34418, the S&P500 advanced 0.11% to 4455 , and the tech-focused Nasdaq Composite rose 0.21% to 13816.
Further gains in the Dow Jones must now clear the 2023 peak of 34588 (June 16) to allow for a test of the December 2022 high of 34712 (December 13) and the April 2022 top of 35492 (April 21). Instead, the weekly low of 33610 (June 26) appears as the initial support, followed by the interim 100-day SMA at 33366 and the crucial 200-day SMA at 32930. Potential support levels lower from here include the May low of 32586 (May 25), the 2023 low of 31429 (March 15), and the 2022 low of 28660 (October 13). The daily RSI appeared flat near 63.
Top Performers: Walgreen Boots, Walt Disney, Goldman Sachs
Worst Performers: J&J, Apple, Microsoft
Resistance levels: 34467 34588 34712 (4H chart)
Support levels: 33610 33362 32586 (4H chart)
MACROECONOMIC EVENTS

All Information & Updates provided by:

All information relating to the financial markets available on this page has been prepared and issued by FXStreet (Forexstreet SL, Spain, Reg: B62498233) on the basis of publicly available information and all information believed to be reliable and does not conflict with Kuwaiti local laws, and all necessary care has been taken to before the company to ensure that the facts mentioned are correct from the source.
NCM Investment nor any of its directors or employees shall in any way be held responsible for the contents of this news, and the information contained on this page is intended only to provide clients with publicly available information and should not be construed as investment advice, report or analysis and/or constitute an offer or invitation to buy or sell financial instruments of any kind.
RISK WARNING: Forex and CFDs are highly risky leveraged products, as losses can exceed deposits. Please ensure you understand all the risks and take independent advice if necessary. NCM will segregate the clients based on the criteria of the regulator and its bylaws. NCM does not provide any advisory service; the material published does not constitute advice or a recommendation for a transaction in any financial instrument. NCM accepts no responsibility for any use of the content presented and any consequences of that use. Anyone acting on the information provided does so at their own risk.