
- Contact Us:
-

-

-

-


Daily Market Updates
05 Jul 2023
USDJPY
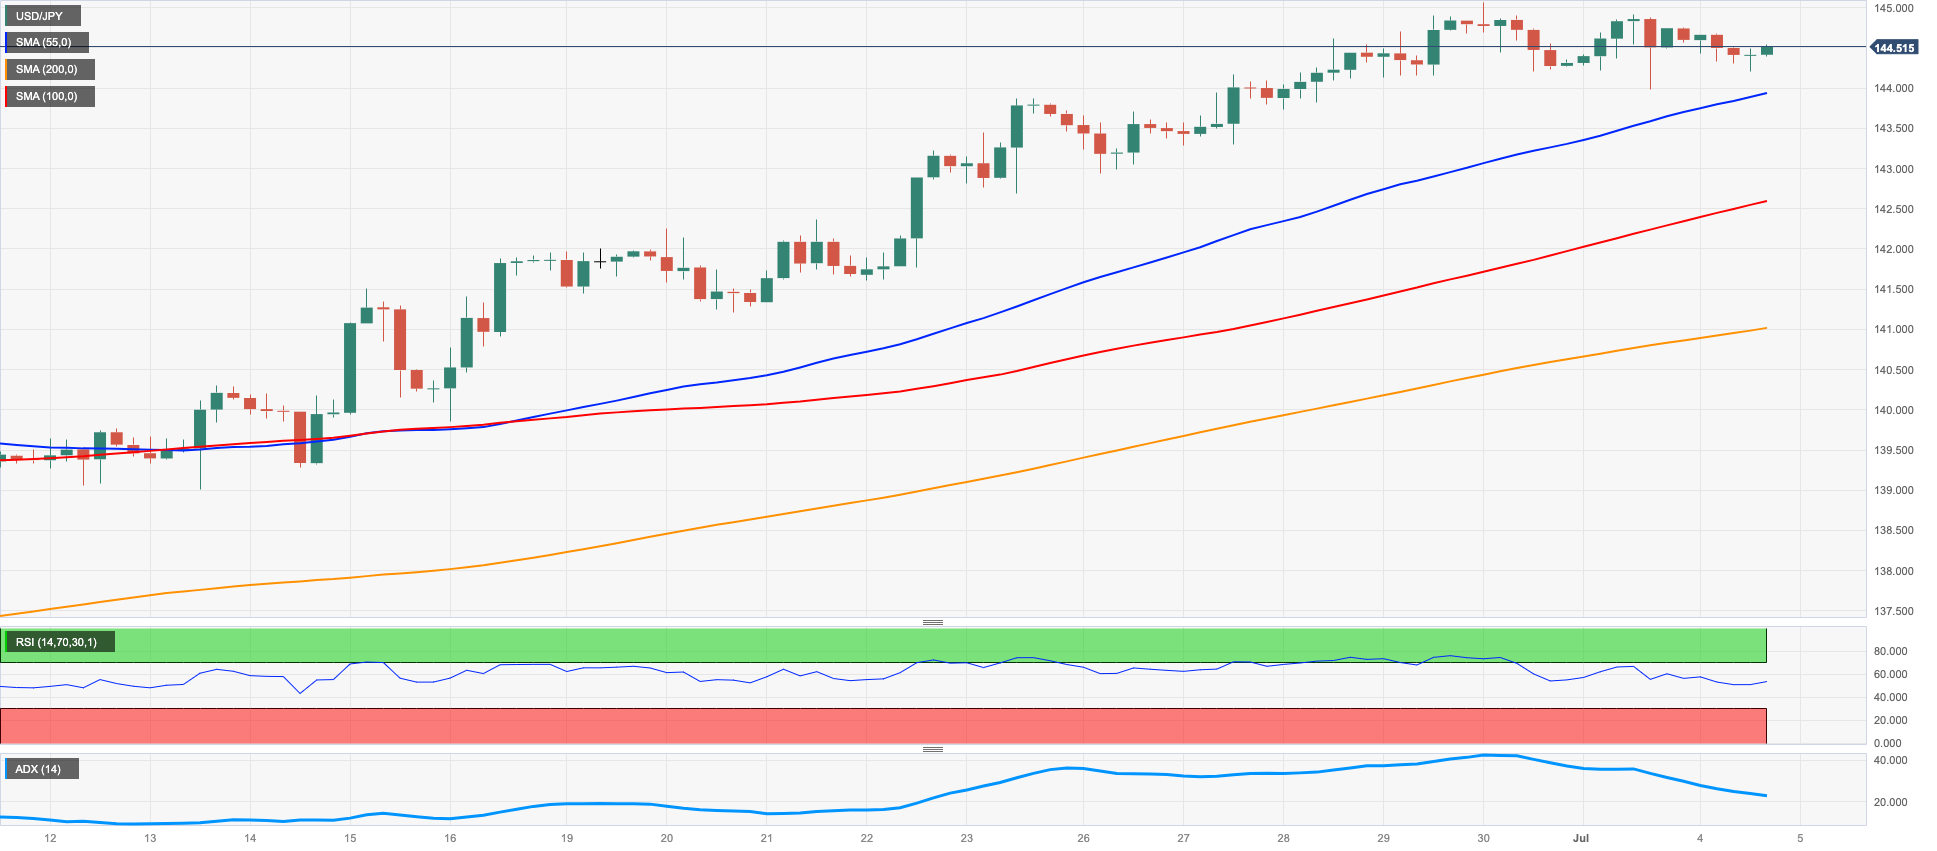
After gaining ground on Monday, USD/JPY experienced a slight decline on Tuesday, but still remained above the significant level of 144.00.
The uncertain movement of the dollar, along with the inactivity in the US bond markets and concerns about the possibility of Japanese government intervention in the FX markets, all contributed to the yen's strength against the buck.
The only notable event in Japan's economic calendar was a 10-year JGB auction, which yielded a rate of 0.428%.
So far, the USD/JPY is likely to continue its strong performance, highlighting numerous key resistance levels, including the 2023 high at 145.07 (June 30), the October 2022 top at 151.94 (October 21) and the round level of 152.00. On the flip side, immediate support is at the June low of 138.42 (June 1), with additional support at the critical 200-day SMA of 137.22. If the USD/JPY continues to fall, the 100-day SMA at 136.49, the weekly low at 133.01 and minor support at 132.01 (April 13) should provide additional support. Further south, the April low of 130.62 (April 5) emerges before reaching critical support at 130.00. The RSI on the daily chart dropped to the 70 region, indicating that the market remains overbought.
Resistance levels: 145.07 146.79 148.45 (4H chart)
Support levels: 143.98 142.64 141.21 (4H chart)
GBPUSD
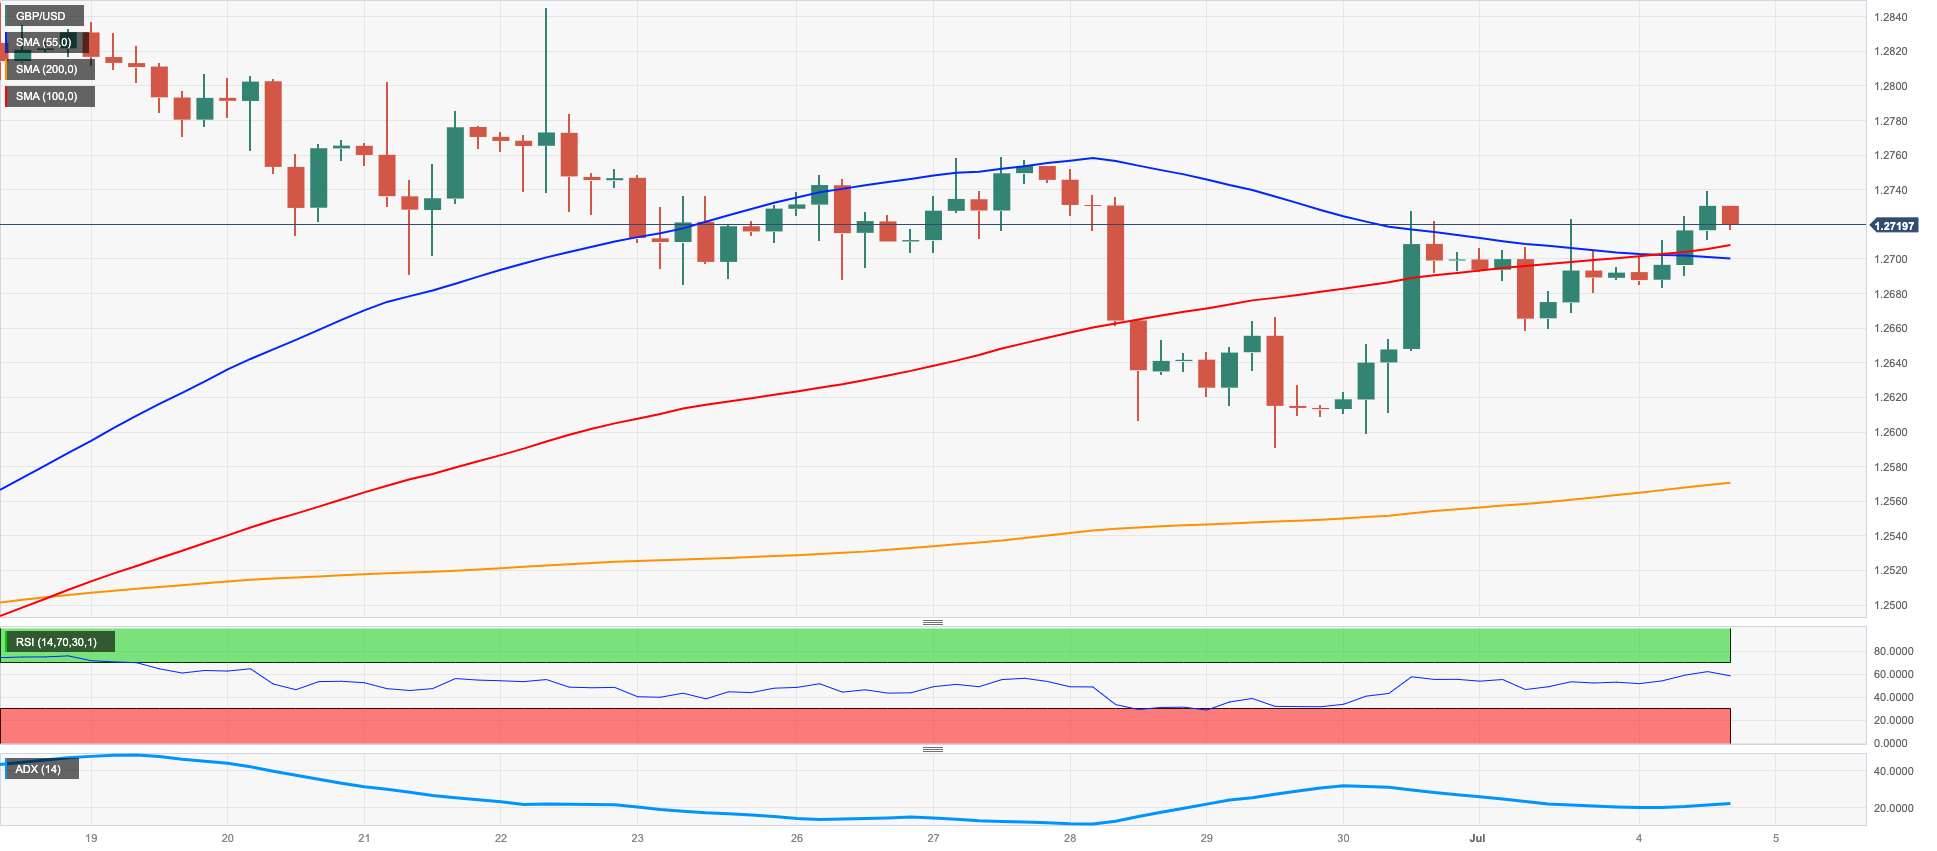
Despite the overall stagnant state of the markets, GBP/USD managed to gain momentum and reach its highest level in multiple sessions, specifically within the range of 1.2735/40 on Tuesday.
Interestingly, the British pound capitalized on the poor performance of the US dollar and quickly recovered from a pessimistic start earlier in the week, achieving decent gains above the 1.2700 resistance level.
Meanwhile, the British pound is receiving additional support due to persistently high inflation in the UK, which stood at 8.7% in the year leading up to May. This indicates that the BoE may need to further increase interest rates. Market projections suggest that the bank’s interest rate could potentially reach a peak of 6% within the next 6 to 12 months. This is in contrast to the expectations that both the Federal Reserve and the ECB will gradually decrease their policy rates during the same period, as reflected in the market's implied policy rates for the UK.
There were no significant events or releases on the UK calendar on Tuesday.
As for support and resistance levels for GBP/USD, the immediate support is at the weekly low of 1.2590 (June 29), ahead of the region around 1.2560, where the trend line from 2021 to 2023 is located. This area appears also reinforced by the interim 55-day SMA at 1.2547. South from here comes the June low of 1.2368 (June 5) prior to the May low at 1.2308 (May 25) and the April low at 1.2274 (April 3). The breach of the latter exposes the crucial 200-day SMA at 1.2130. On the other hand, if the pair manages to surpass the 2023 high at 1.2848 (June 16), it could potentially test the 200-week SMA at 1.2879 before reaching the psychological 1.3000 level. The daily RSI appears improved past the 58 yardstick.
Resistance levels: 1.2739 1.2751 1.2841 (4H chart)
Support levels: 1.2590 1.2564 1.2486 (4H chart)
AUDUSD
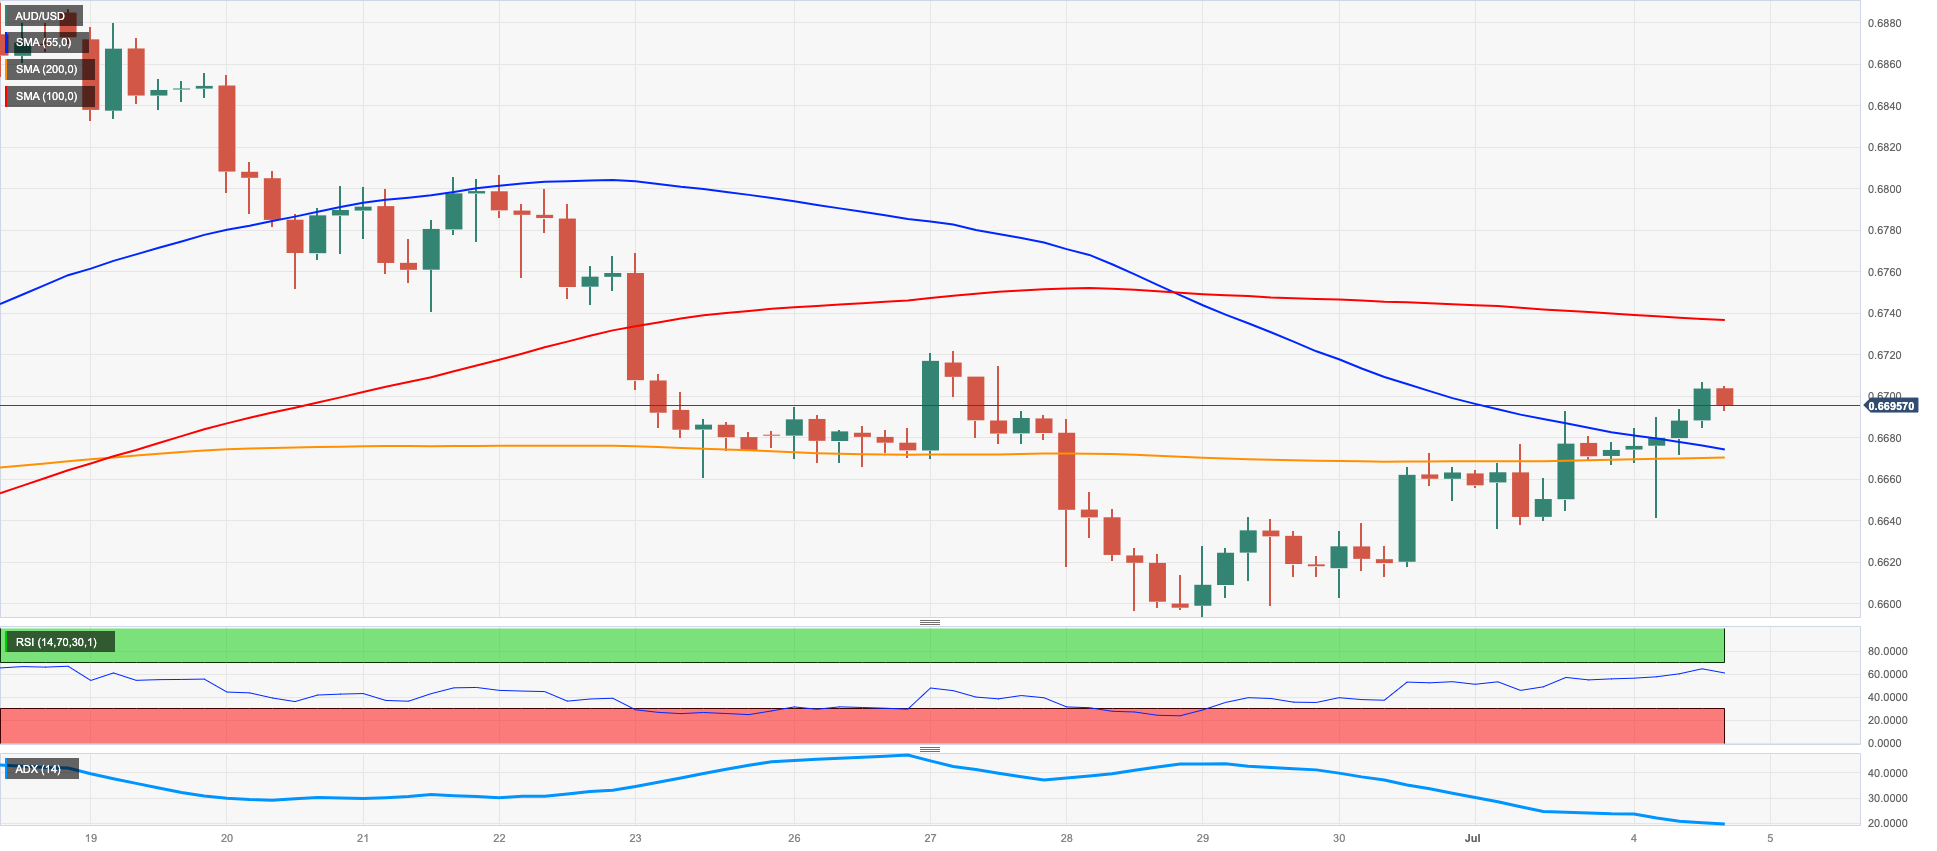
The Aussie dollar retained its positive momentum and continued its upward trend against the greenback for the fourth consecutive day on Tuesday. AUD/USD rose above the crucial 200-day SMA level of 0.6669 and surpassed the key 0.6700 benchmark to reach new multi-day highs.
The irresolute performance of the US dollar further supported the pair, which received an additional boost after the RBA decided to leave its OCR unchanged at 4.10% during its latest meeting.
This marks only the second time in the last 14 meetings that the central bank has chosen not to increase interest rates. The pause in rate hikes will allow the RBA to gather more information and assess the current state of the economy, while the policy rate remains the highest it has been in the past 11 years.
Governor P. Lowe also argued that the bank needs time to assess the impact of the four percentage points of rate hikes before deciding on any further actions. He acknowledged the possibility of additional tightening of monetary policy to ensure that inflation aligns with the target within a reasonable timeframe but emphasized that such measures would depend on the progress of the economy and inflation in the future.
A more substantial rebound requires the AUD/USD to overcome the weekly high of 0.6720 (June 27) before hitting the June top of 0.6899 (June 16). Beyond that, the key 0.7000 level, the weekly high of 0.7029 (February 14), and the 2023 peak of 0.7157 (February 2) are all important levels to watch. On the contrary, a collapse of the weekly low of 0.6595 (June 29) might lead to a further slide to the 2023 low of 0.6458 (May 31). From here, the weekly low of 0.6595 (June 29) is aligned, ahead of the November 2022 low of 0.6272 (November 3) and the October 2022 low of 0.6169 (October 13. The everyday RSI climbed to the 51 mark.
Resistance levels: 0.6705 0.6720 0.6806 (4H chart)
Support levels: 0.6668 0.6595 0.6579 (4H chart)
GOLD
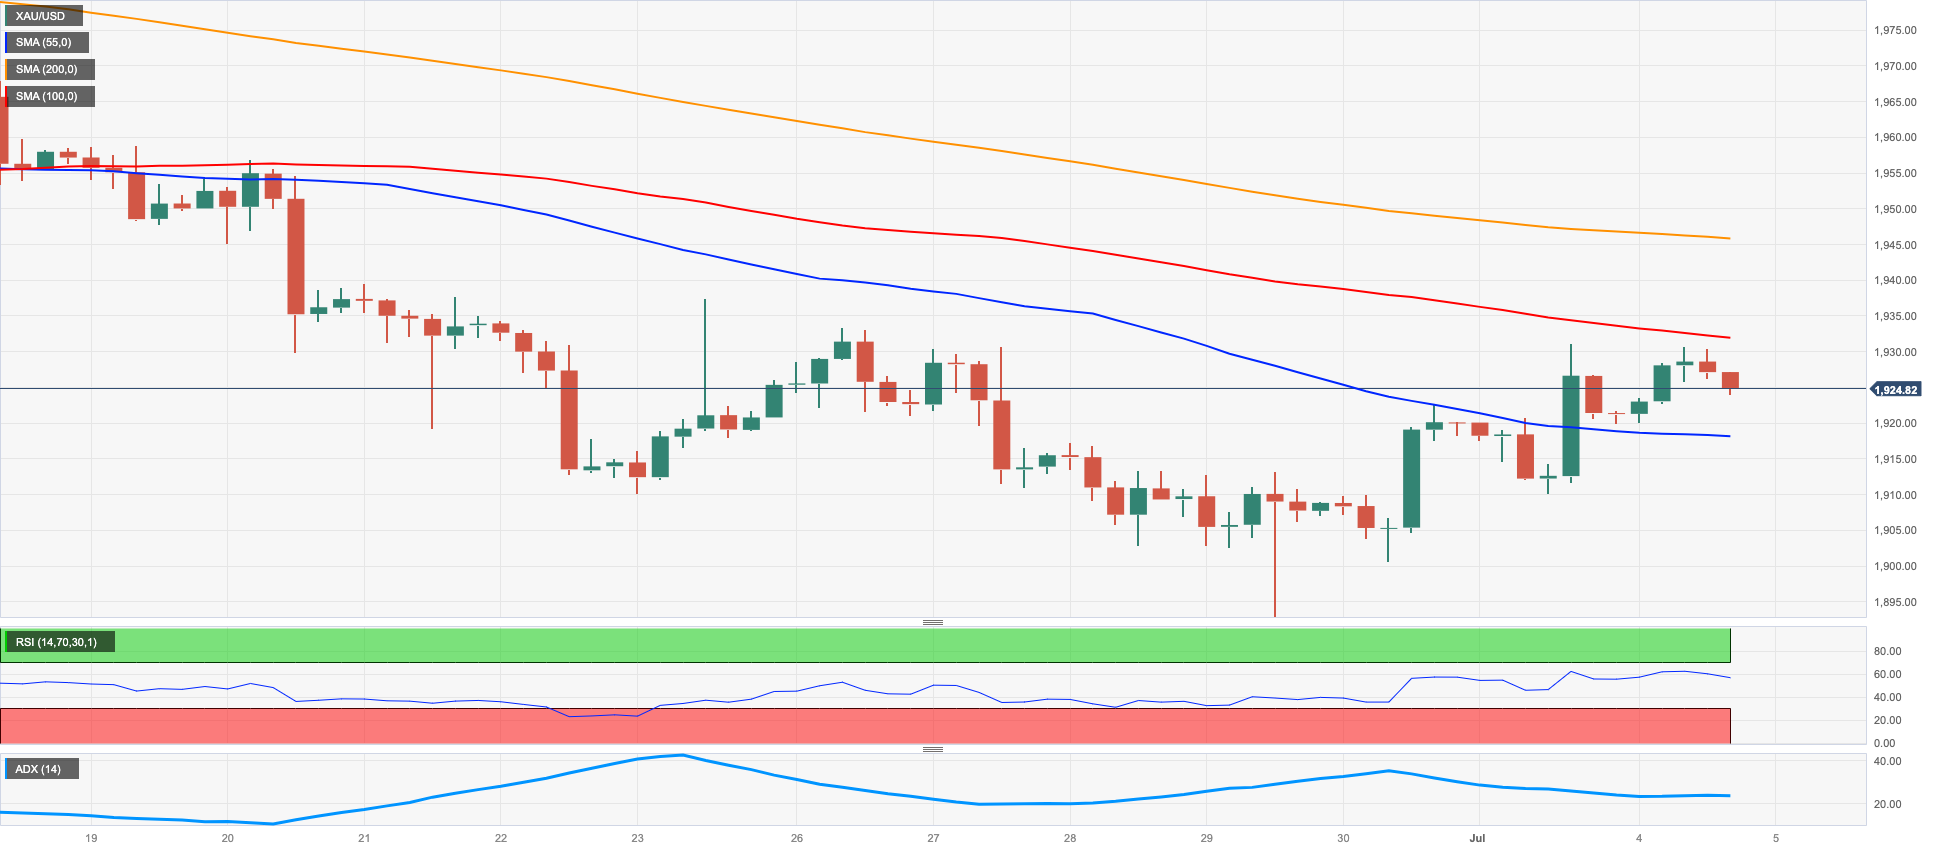
The price of gold per troy ounce continued to rise, reaching levels near the weekly highs around $1930 on Tuesday.
The fluctuating nature of the US dollar and the lack of activity in the US money market appear to have contributed to the strong performance of gold during the first half of the week, all in response to the US Independence Day holiday and Monday’s shortened trading session.
Looking ahead, gold is expected to encounter some challenges due to the release of the FOMC Minutes on Wednesday and the upcoming US labor market report towards the end of the week. This suggests that the path for gold may become more uncertain and volatile in the coming days.
So far, gold prices have kept the recovery going. However, the first impediment is the transitory 100-day and 55-day SMAs at $1945 and $1968, respectively, before the June top at $1983 (June 2) and the important $2000 mark. There is no significant resistance after that until the 2023 peak of $2067 (May 4), which precedes the 2022 top of $2070 (March 8), and ultimately the all-time high of $2075 on August 7, 2020. In contrast, the June low of $1893 (June 29) provides immediate support ahead of the crucial 200-day SMA at $1860 and the 2023 low of $1804 (February 28), all ahead of the important $1800 threshold.
Resistance levels: $1931 $1946 $1983 (4H chart)
Support levels: $1893 $1885 $1809 (4H chart)
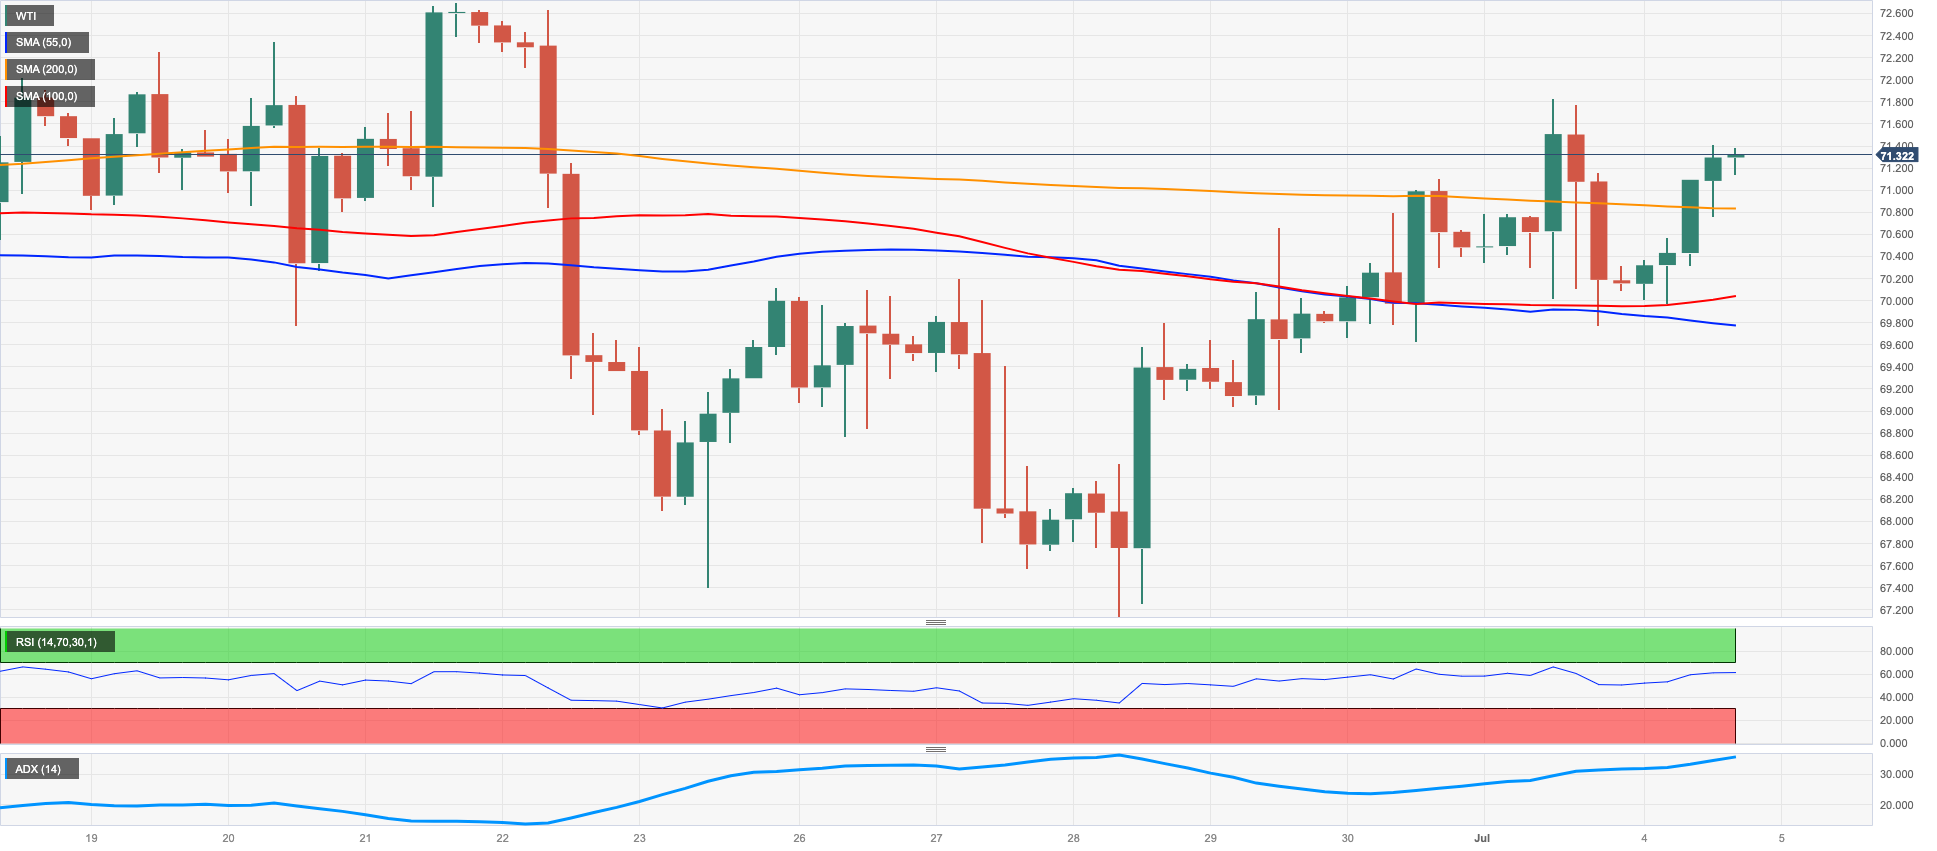
CRUDE WTI
WTI prices shrugged off Monday's decline and resumed their upward trajectory on turnaround Tuesday, surpassing the $71.00 per barrel mark once again.
Interestingly, traders' optimism remained relatively unchanged despite Monday's announcement that Saudi Arabia would extend its voluntary output reduction by one mbpd until August. Moreover, Russia and Algeria have also agreed to decrease their output and export levels by 500 kbpd and 20 kbpd, respectively, for the same month.
These developments appear to have offset concerns about a potential economic slowdown led by central banks, especially considering the dampened momentum of China's recovery following the pandemic.
Later in the session, the American Petroleum Institute (API) and the Energy Information Administration (EIA) are scheduled to release their reports on US crude oil inventories for the week ending on June 30th, on Wednesday and Thursday respectively.
WTI faces immediate resistance at the weekly high of $72.68 (June 21), prior to the June top of $74.92 (June 5). The 200-day SMA at $77.42 is followed by the weekly peak of $79.14 (April 24) and the important barrier of $80.00 per barrel. A break above the latter forecasts a rise to the April 2023 high of $83.49, before the November 2022 top of $93.73 (November 7). On the downside, the June low of $66.86 (June 13) comes first ahead of the 2023 low of $63.61 (May 4), the December 2021 low of $62.46 (December 2), and the crucial level of $60.00 per barrel.
Resistance levels: $71.72 $72.68 $74.92 (4H chart)
Support levels: $67.01 $66.77 $63.71 (4H chart)
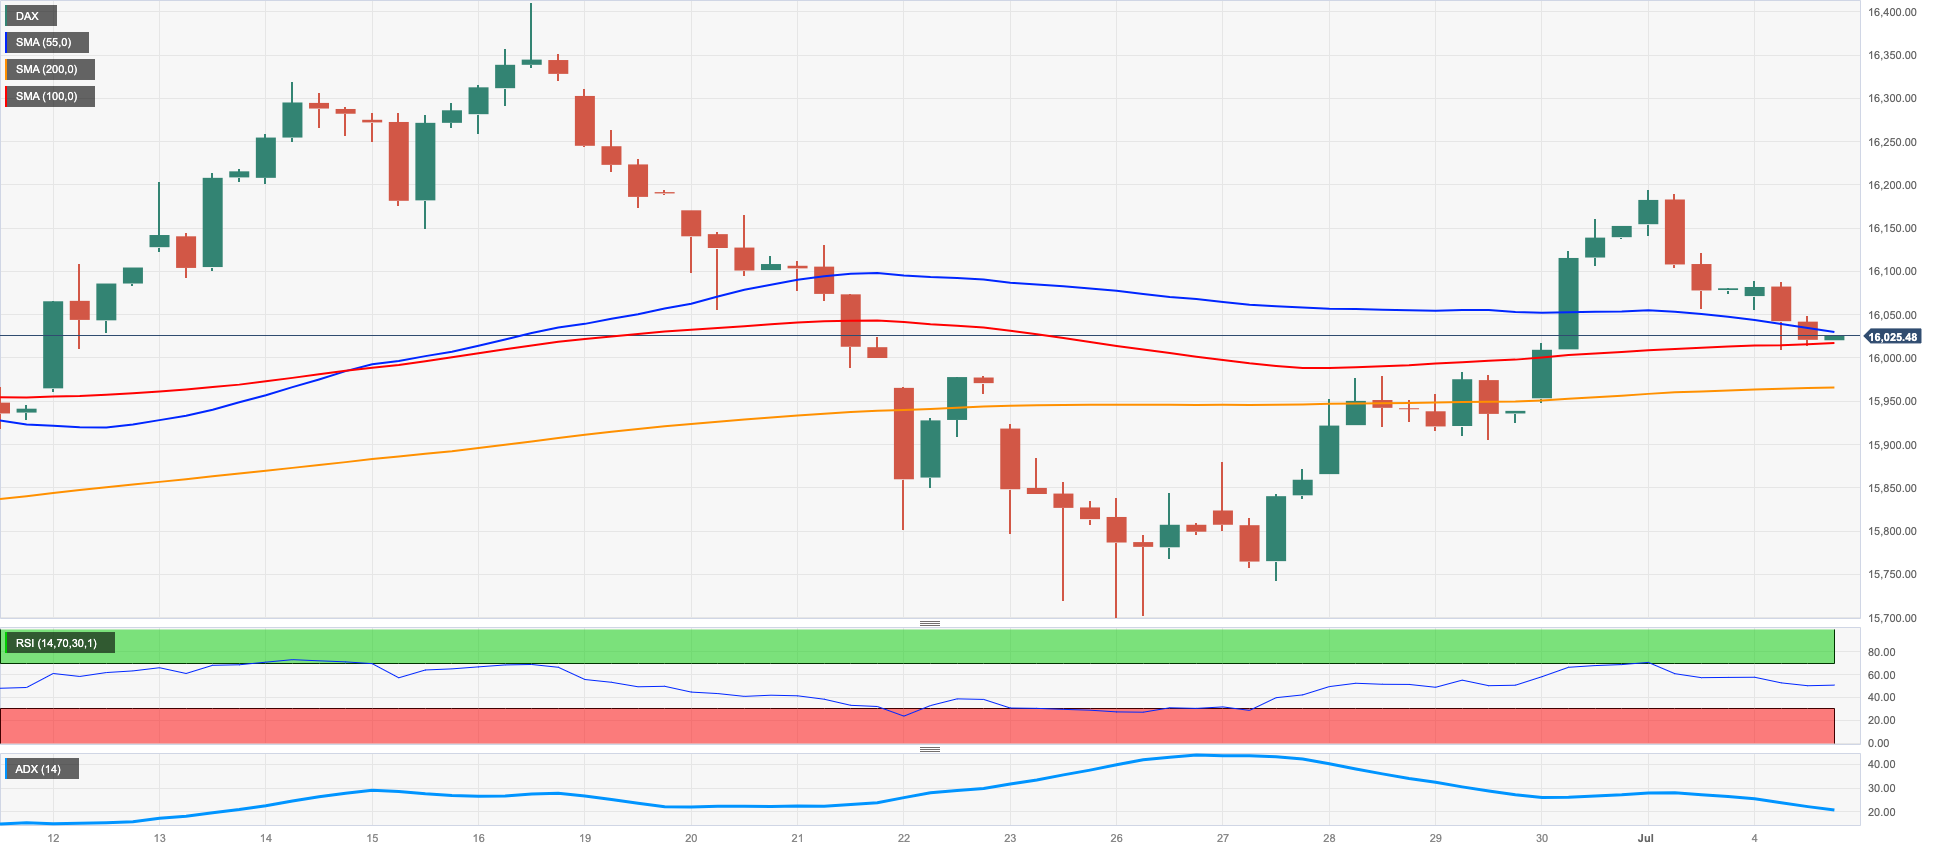
GER40
Germany's stock benchmark, the DAX40, continued its disappointing start to the week and experienced further declines on Tuesday. However, the index managed to hold above the crucial 16000 level.
The ongoing weakness in equities can be attributed to persistent speculation of the ECB implementing further tightening measures in July, alongside concerns of a potential recession and cautiousness ahead of the upcoming corporate earnings season.
In the domestic bond market, the yield on the 10-year German bund reached its highest levels in several days, approaching the significant 2.50% range.
Regarding Germany's trade balance, the latest figures for May revealed a surplus of €14.4B. While exports showed a marginal decline of 0.1% compared to the previous month, imports recorded a 1.7% increase MoM.
The weekly top of 16209 (July 3) is the next up-barrier for the DAX40, followed by the all-time high of 16427 (June 16). If sellers reclaim control, the index's first target would be the weekly low of 15713 (June 26), which seems to be supported by the interim 100-day SMA at 15705. The May low of 15629 (May 31) comes next, followed by the April low of 15482 (April 5), the minor support at 14809 (March 24), and the key 200-day SMA at 14823. The March low of 14458 (March 20) would be the next level. The daily RSI dropped to the boundaries of 51.
Best Performers: Vonovia, Deutsche Boerse, Adidas
Worst Performers: Covestro, MTU Aero, Siemens Energy AG
Resistance levels: 16209 16427 17000? (4H chart)
Support levels: 15908 15713 15629 (4H chart)
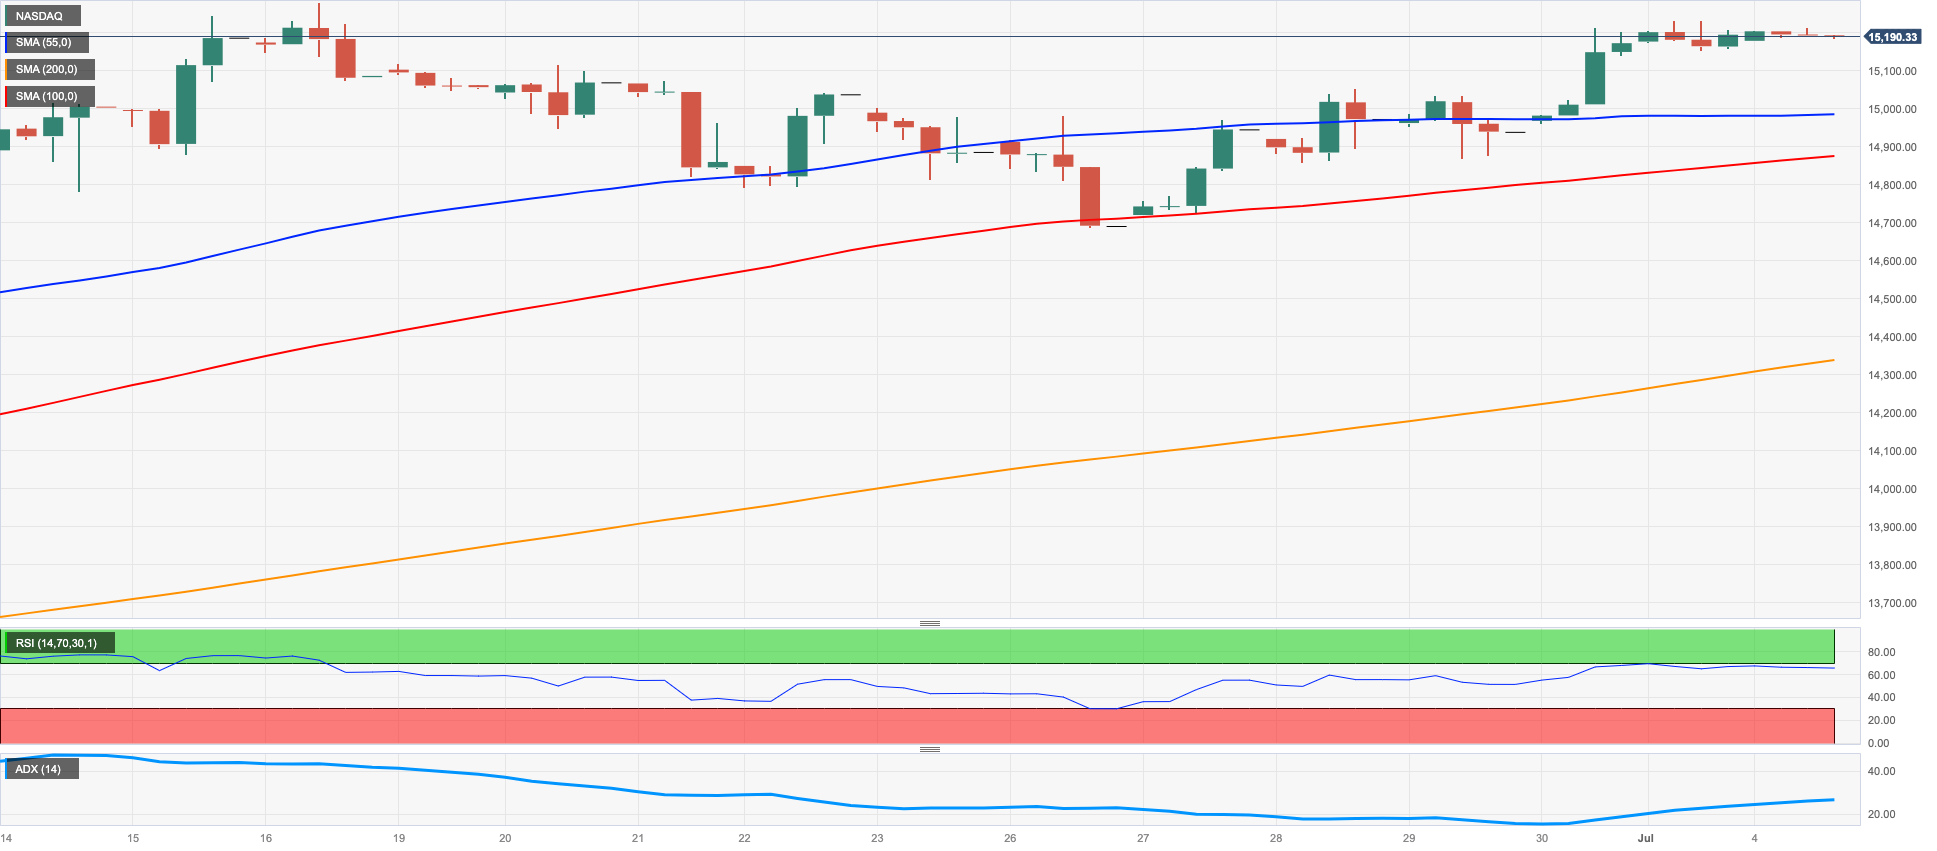
NASDAQ
No trading activity in the US markets on Tuesday in light of the Independence Day holiday.
Regarding Monday's developments, the technology stocks represented by the Nasdaq 100 index reached their highest levels in several days, specifically around the 15200 level. This marked the continuation of a three-session recovery streak.
The upward movement in the index on Monday was primarily fueled by the impressive performance of Tesla. The electric vehicle manufacturer surprised investors by reporting higher-than-expected vehicle deliveries during the April-June period.
The lack of a clear trend in the US dollar, coupled with relatively stable activity in US yields, also played a role in contributing to the notable gains in the Nasdaq 100 index.
If bulls push harder, the Nasdaq 100 will encounter an immediate stumbling block at the 2023 high of 15284 (June 16) before reaching the round level of 16000. By contrast, the weekly lows of 14687 (June 26) and 14283 (June 7), followed by the temporary 55-day SMA at 13957, and then another weekly low of 13520 (May 24), provide early support. A further loss might result in a return to the May low of 12938 (May 4), followed by the April low of 12724 (April 25), the 200-day SMA at 12378, and the March low of 11695 (March 13). The daily RSI improved somewhat, approaching 67.
Top Gainers: Lucid Group, Tesla, Warner Bros Discovery
Top Losers: AstraZeneca ADR, Align, IDEXX Labs\
Resistance levels: 15232 15284 16017 (4H chart)
Support levels: 14687 14283 13520 (4H chart)
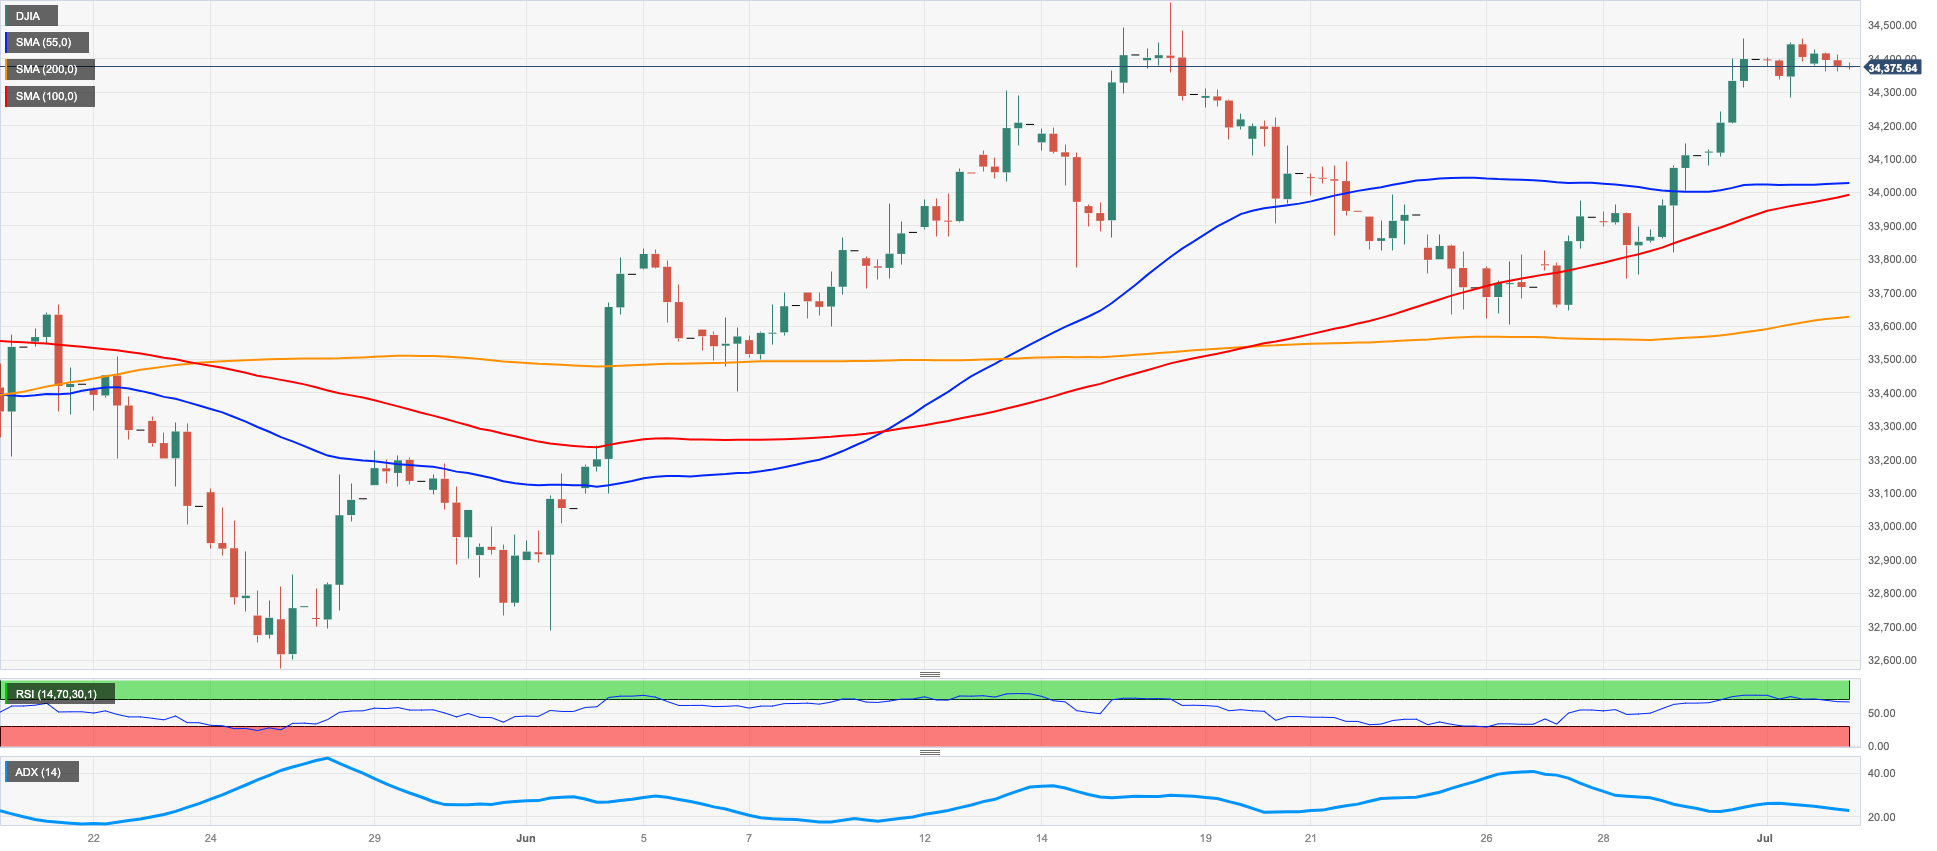
DOW JONES
Due to the Independence Day holiday, there was no trading activity in the US markets on Tuesday.
During the previous session, the Dow Jones stock index closed around the same levels as last Friday, hovering around the 34400 mark. The market lacked a clear direction at the beginning of the week, with investors exercising caution ahead of key releases in the US economic calendar later in the week.
On the latter, the market will be closely watching the release of the FOMC Minutes on Wednesday, while the US jobs report for June, along with the Unemployment Rate, is expected to be published on Friday.
Overall, the Dow Jones gained a marginal 0.03% to 34418, the S&P500 rose 0.11% to 4455, and the tech-focused Nasdaq Composite increased 0.21% to 13816.
Further gains in the Dow Jones must now clear the 2023 peak of 34588 (June 16) to allow for a test of the December 2022 high of 34712 (December 13) and the April 2022 top of 35492 (April 21). Instead, the weekly low of 33610 (June 26) appears as the initial support, followed by the interim 100-day SMA at 33366 and the crucial 200-day SMA at 32930. Potential support levels lower from here include the May low of 32586 (May 25), the 2023 low of 31429 (March 15), and the 2022 low of 28660 (October 13). The daily RSI appeared flat near 63.
Top Performers: Walgreen Boots, Walt Disney, Goldman Sachs
Worst Performers: J&J, Apple, Microsoft
Resistance levels: 34467 34588 34712 (4H chart)
Support levels: 33610 33362 32586 (4H chart)
MACROECONOMIC EVENTS

All Information & Updates provided by:

All information relating to the financial markets available on this page has been prepared and issued by FXStreet (Forexstreet SL, Spain, Reg: B62498233) on the basis of publicly available information and all information believed to be reliable and does not conflict with Kuwaiti local laws, and all necessary care has been taken to before the company to ensure that the facts mentioned are correct from the source.
NCM Investment nor any of its directors or employees shall in any way be held responsible for the contents of this news, and the information contained on this page is intended only to provide clients with publicly available information and should not be construed as investment advice, report or analysis and/or constitute an offer or invitation to buy or sell financial instruments of any kind.
RISK WARNING: Forex and CFDs are highly risky leveraged products, as losses can exceed deposits. Please ensure you understand all the risks and take independent advice if necessary. NCM will segregate the clients based on the criteria of the regulator and its bylaws. NCM does not provide any advisory service; the material published does not constitute advice or a recommendation for a transaction in any financial instrument. NCM accepts no responsibility for any use of the content presented and any consequences of that use. Anyone acting on the information provided does so at their own risk.