
- Contact Us:
-

-

-

-


Daily Market Updates
07 Jul 2023
USDJPY
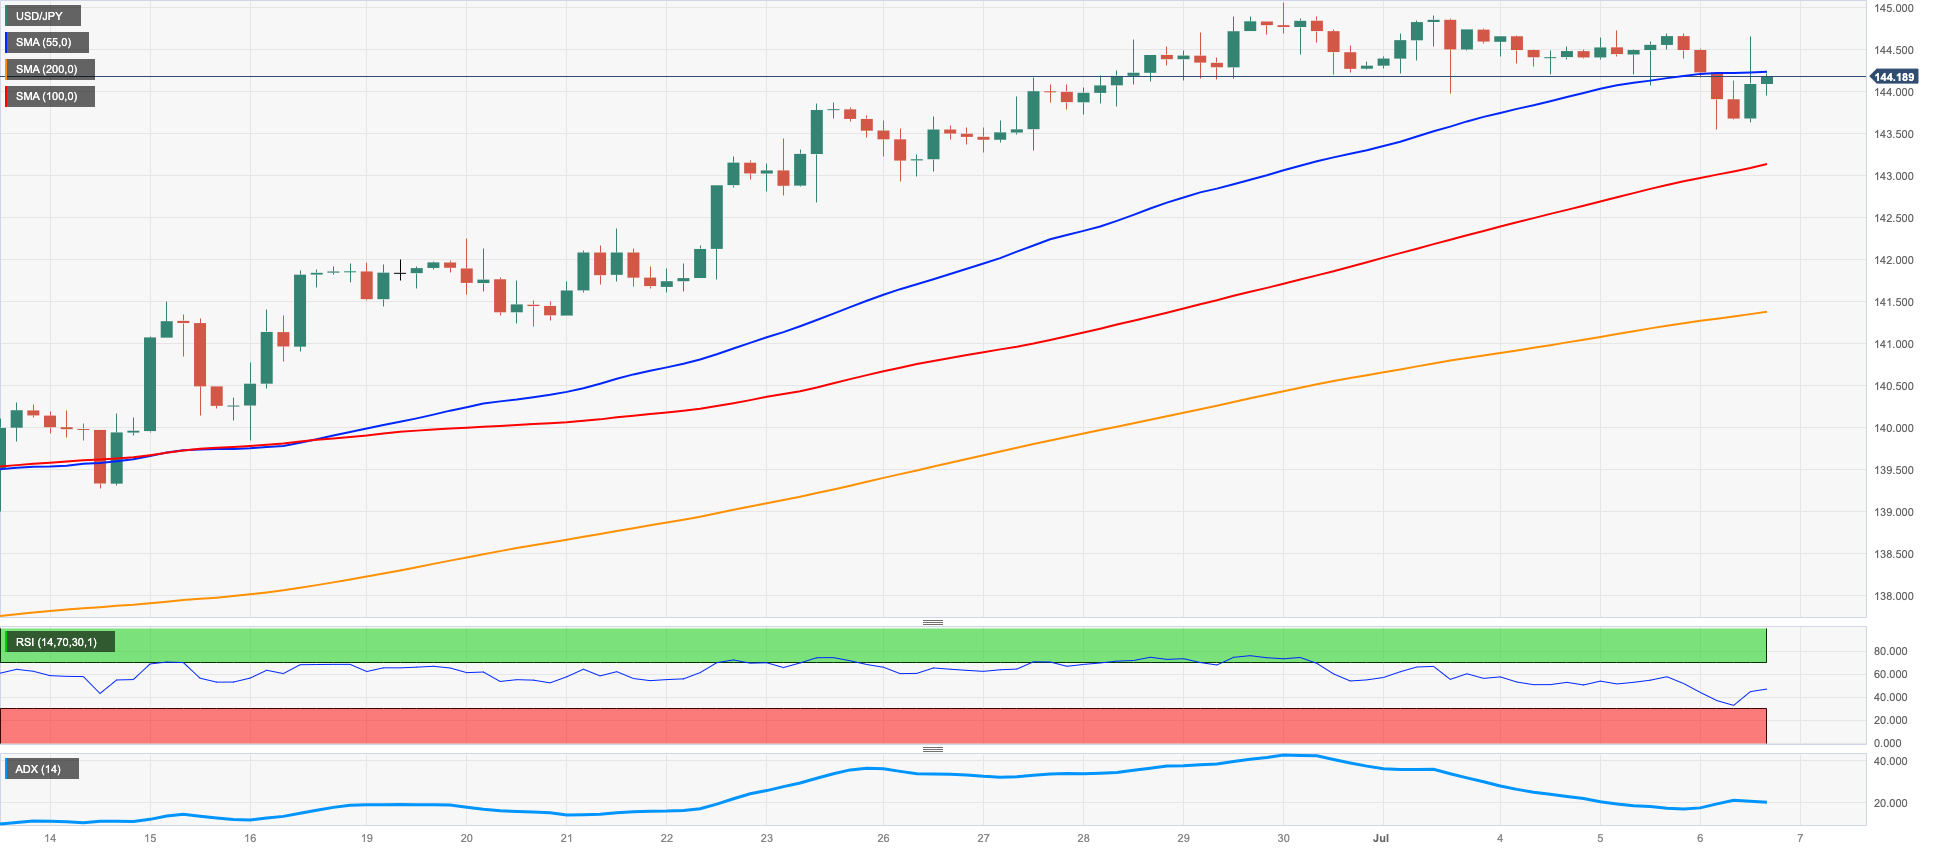
The Japanese yen saw renewed interest from buyers on Thursday, causing USD/JPY to drop to its lowest level in several days, near 143.50.
The significant decline in the pair was driven by increased selling pressure on the greenback, while the rise in US yields across the board limited the downward movement in spot.
Furthermore, the growing disparity between the BoJ and other major central banks when it comes to monetary policy is expected to contribute to potential gains in the pair. However, concerns about potential intervention in the FX markets by the Japanese government may somewhat restrict the upside potential.
In Japan, there was an increase of ¥1252.7 billion in Foreign Bond Investment for the week ending on July 1.
The continuation of the uptrend in USD/JPY is expected to initially challenge the 2023 high of 145.07 (June 30) ahead of the October 2022 top of 151.94 (October 21), and the round level of 152.00. On the other hand, there is immediate support at the June low of 138.42 (June 1), with additional contention at the crucial 200-day SMA of 137.22. If the pair continues to decline, the 100-day SMA at 136.70, the weekly low at 133.01 (April 26), and minor support at 132.01 (April 13) might provide additional support. Further south, the April low of 130.62 (April 5) is shown before reaching crucial support at 130.00. The RSI on the daily chart deflated to the vicinity of 66.
Resistance levels: 145.07 146.79 148.45 (4H chart)
Support levels: 143.55 142.64 141.21 (4H chart)
GBPUSD
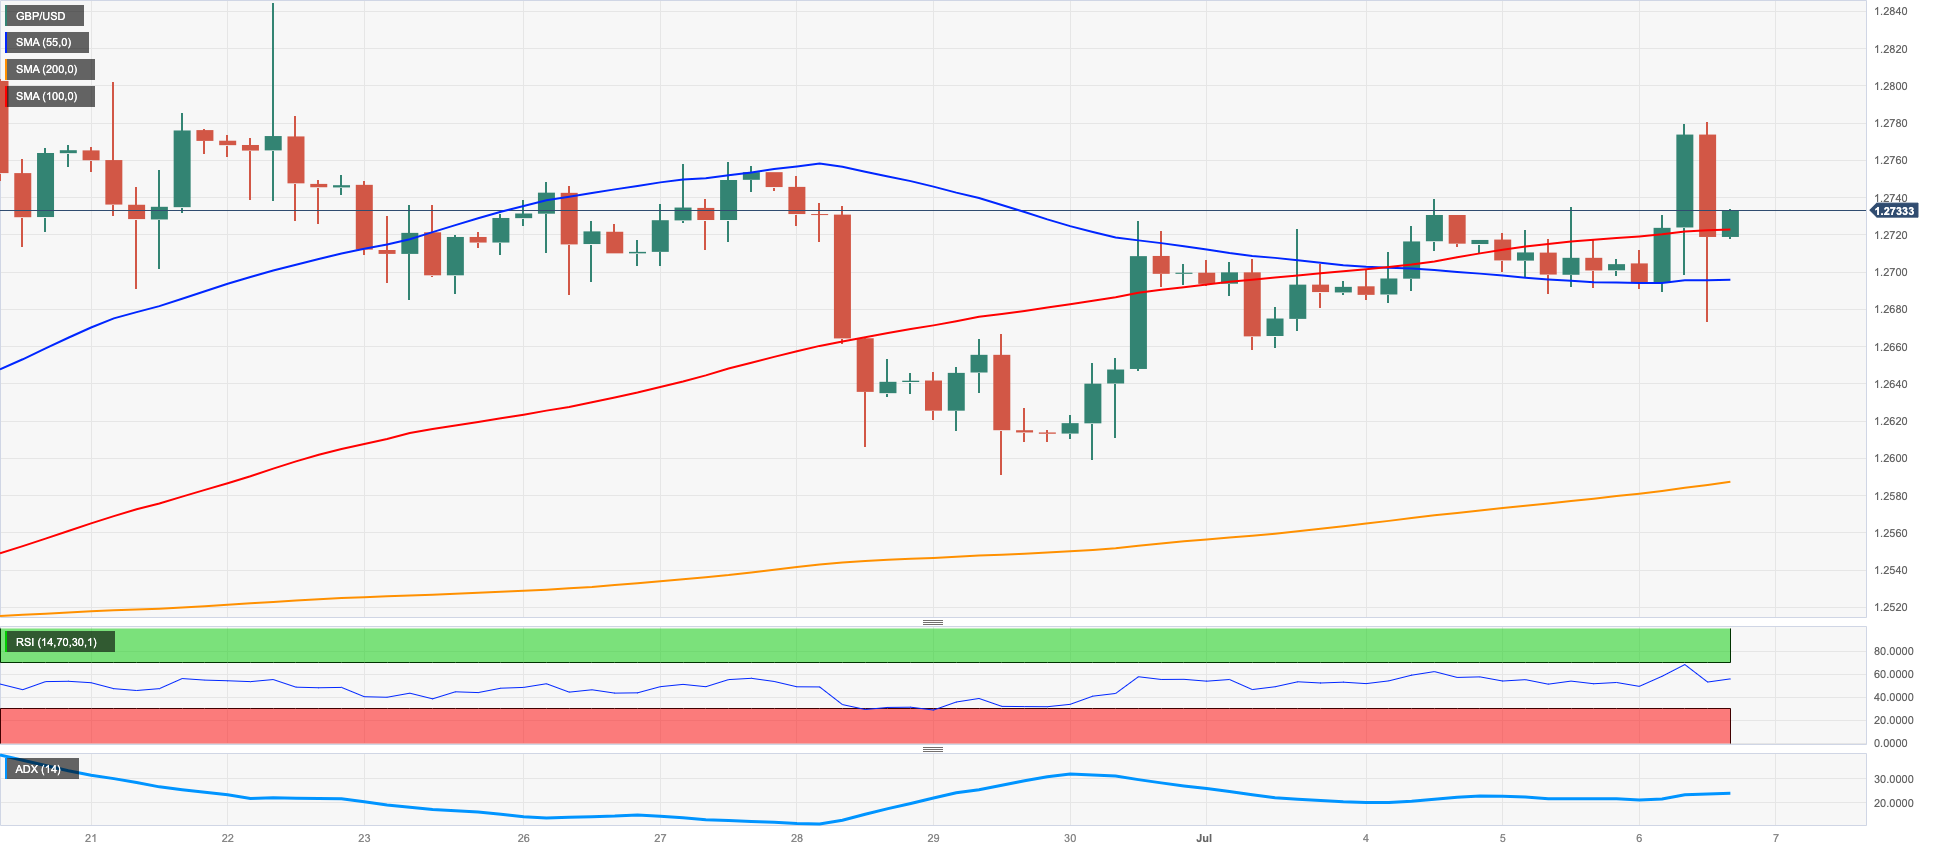
GBP/USD reached its highest levels in multiple sessions on Thursday, hovering around the 1.2780/85 range, thanks to renewed weakness in the US dollar.
The ongoing positive sentiment among traders, favoring riskier assets, further supported the weekly recovery of the British pound. Additionally, investors' anticipation of a half-point interest rate hike at the August meeting provided an additional boost to the currency.
Currently, market expectations suggest that the central bank's interest rate could potentially surpass the 6% threshold.
Another factor contributing to the strength of the British pound was the rise in UK 10-year gilt yields, reaching levels near 4.70%, an area last seen in October 2008.
In terms of UK economic news, the S&P Global/CIPS Construction Purchasing Managers' Index (PMI) declined to 48.9 in June from 51.6, indicating a contraction in the construction sector.
If GBP/USD manages to break over the 2023 high of 1.2848 (June 16), it may target the 200-week SMA at 1.2879 before reaching the crucial 1.3000 level. By contrast, the weekly low of 1.2590 (June 29) provides immediate support ahead of the zone around 1.2550, where the trend line from 2021 to 2023 and the temporary 55-day SMA coincide. Following that is the June low of 1.2368 (June 5), prior to the May low of 1.2308 (May 25) and the April low of 1.2274 (April 3). The latter's breach displays the 200-day simple moving average (SMA) at 1.2147. The daily RSI ticked higher past the 58 mark.
Resistance levels: 1.2781 1.2848 1.3089 (4H chart)
Support levels: 1.2658 1.2590 1.2486 (4H chart)
AUDUSD
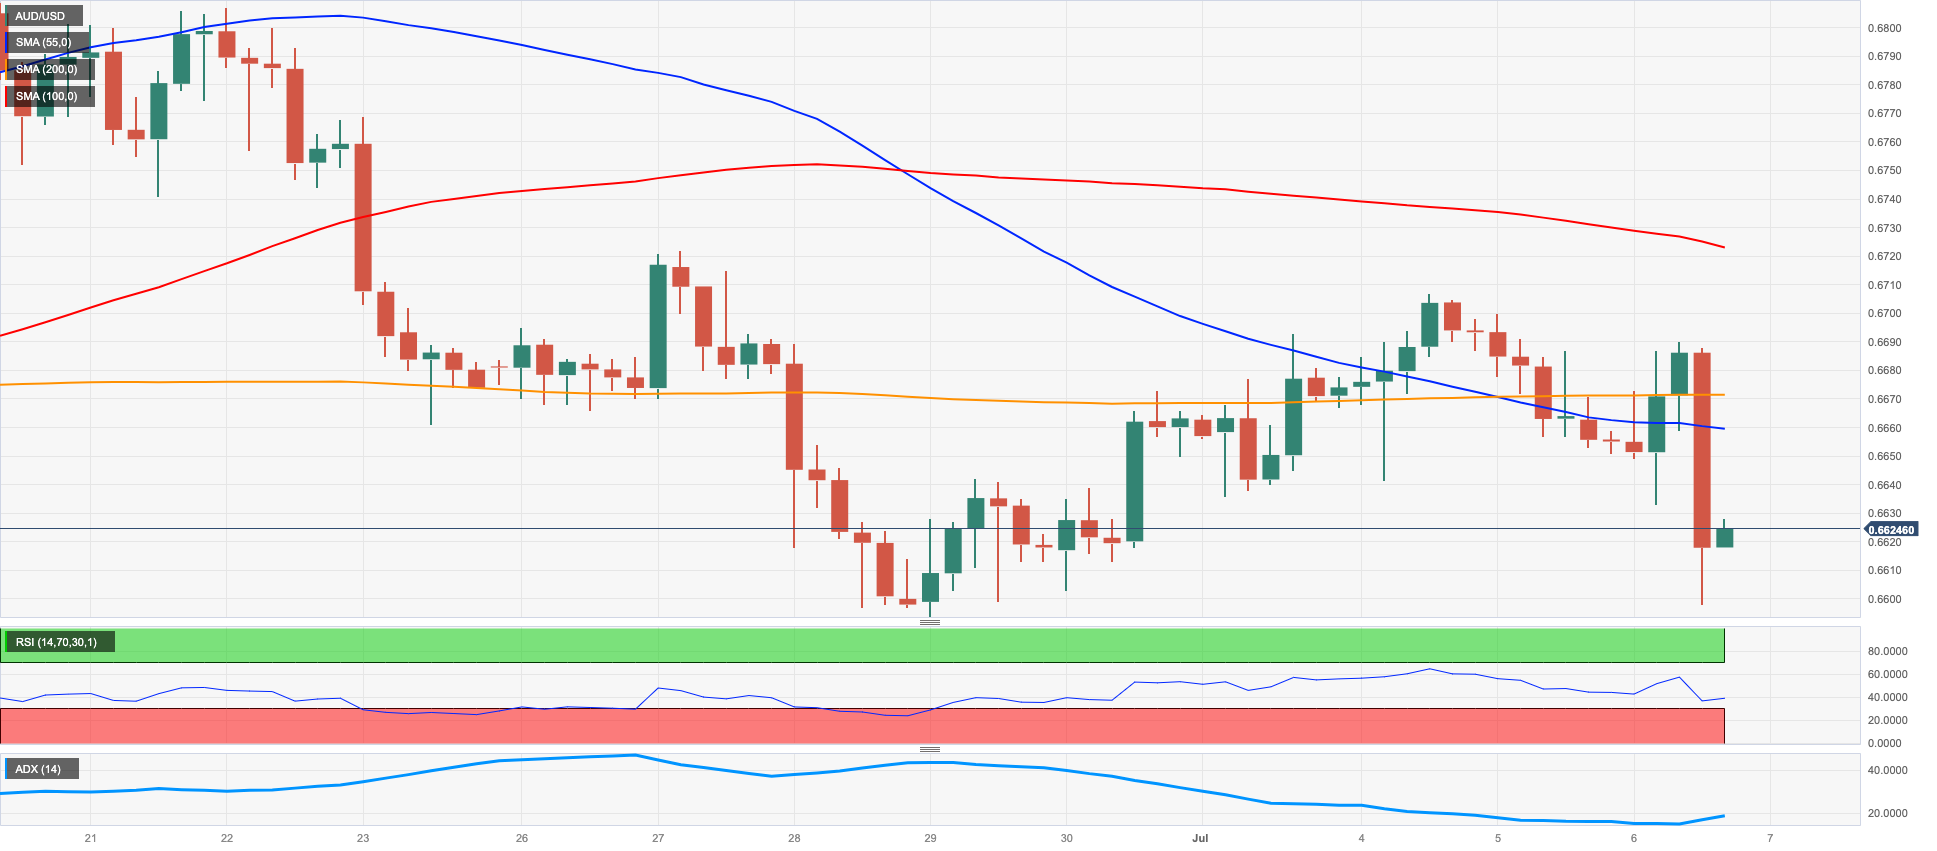
AUD/USD experienced a significant drop and approached the levels seen in June, falling below 0.6600 the figure.
This decline occurred even though the greenback only experienced minor losses for the day. The overall poor performance of commodity markets may have contributed to the negative sentiment surrounding the Australian dollar.
Additionally, the divergence in monetary policy between the US Federal Reserve and the Reserve Bank of Australia (RBA) likely added to the bearishness, as the US labour market showed strong results, reinforcing the possibility of the Fed continuing its rate-hiking campaign later this month.
Regarding data from Australia, the trade surplus widened to A$11.791B in May, driven by a 4.4% increase in exports and a 2.5% increase in imports.
Further losses now appear on the table for AUD/USD in the near term. That said, a break below the weekly low of 0.6595 (June 29) might lead to a further slide to the 2023 low of 0.6458 (May 31). From here, the weekly low of 0.6595 (June 29) is aligned, seconded by the lows of 0.6272 (November 3) and 0.6169 (October 13) in November 2022. On the flip side, a stronger rebound would need the pair to break above the weekly high of 0.6720 (June 27) before hitting the June top of 0.6899 (June 16). Beyond there, the vital 0.7000 level, the weekly high of 0.7029 (February 14), and the 2023 peak of 0.7157 (February 2) are all important levels to keep an eye on. The RSI for the day deflated below 43.
Resistance levels: 0.6705 0.6720 0.6806 (4H chart)
Support levels: 0.6599 0.6579 0.6458 (4H chart)
GOLD
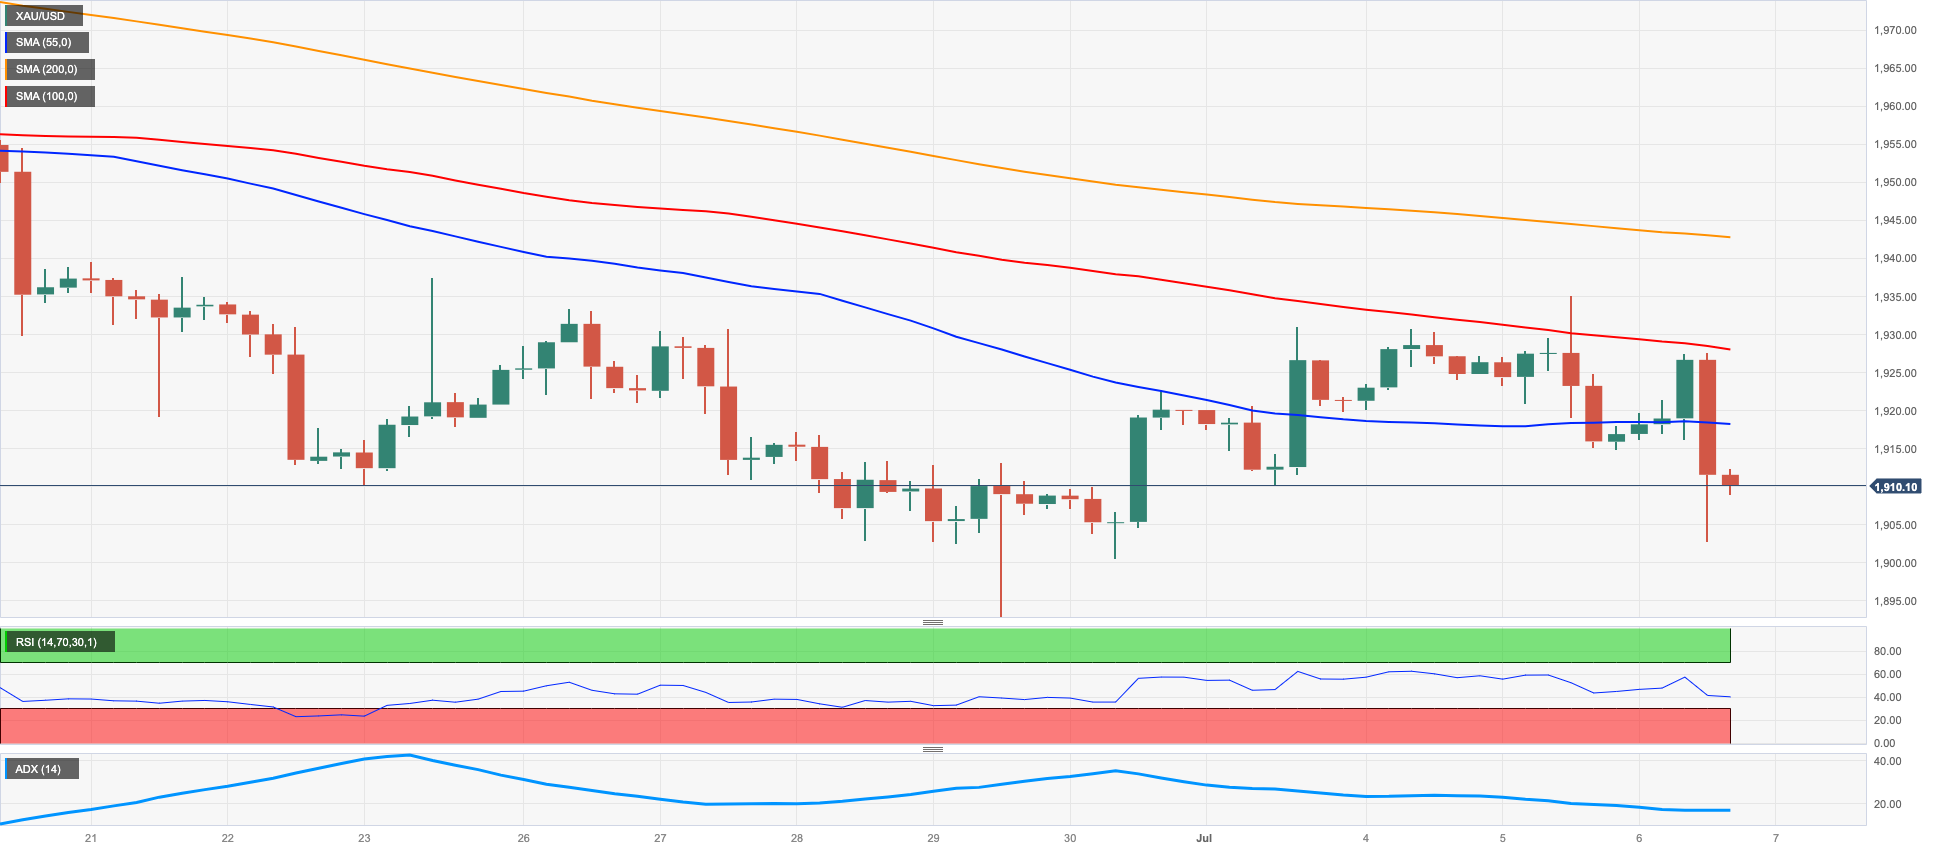
Gold prices continued their decline from Wednesday and neared the critical support level of $1900 per troy ounce on Thursday.
This second consecutive decrease in the precious metal's value occurred despite only minor losses in the greenback. However, rising US yields and investors' concerns about the possibility of further tightening by major central banks in the latter half of the year contributed to the continued drop in prices.
The release of June's Nonfarm Payrolls on Friday represents the next significant risk event for the yellow metal going forward.
The door now seems open to extra losses in gold. Against that, the June low of $1893 (29 June) provides immediate support prior to the critical 200-day SMA at $1863 and the 2023 low of $1804 (28 February), all ahead of the key $1800 level. Instead, the initial up-barrier comes at the interim 100-day and 55-day SMAs at $1947 and $1965, respectively, before reaching the June high at $1983 (June 2), just ahead of the crucial $2000 level. North from here, there is no significant resistance until the 2023 top at $2067 (4 May), which precedes the 2022 peak at $2070 (8 March) and finally the all-time high at $2075 (7 August 2020).
Resistance levels: $1935 $1943 $1983 (4H chart)
Support levels: $1902 $1893 $1885 (4H chart)
CRUDE WTI
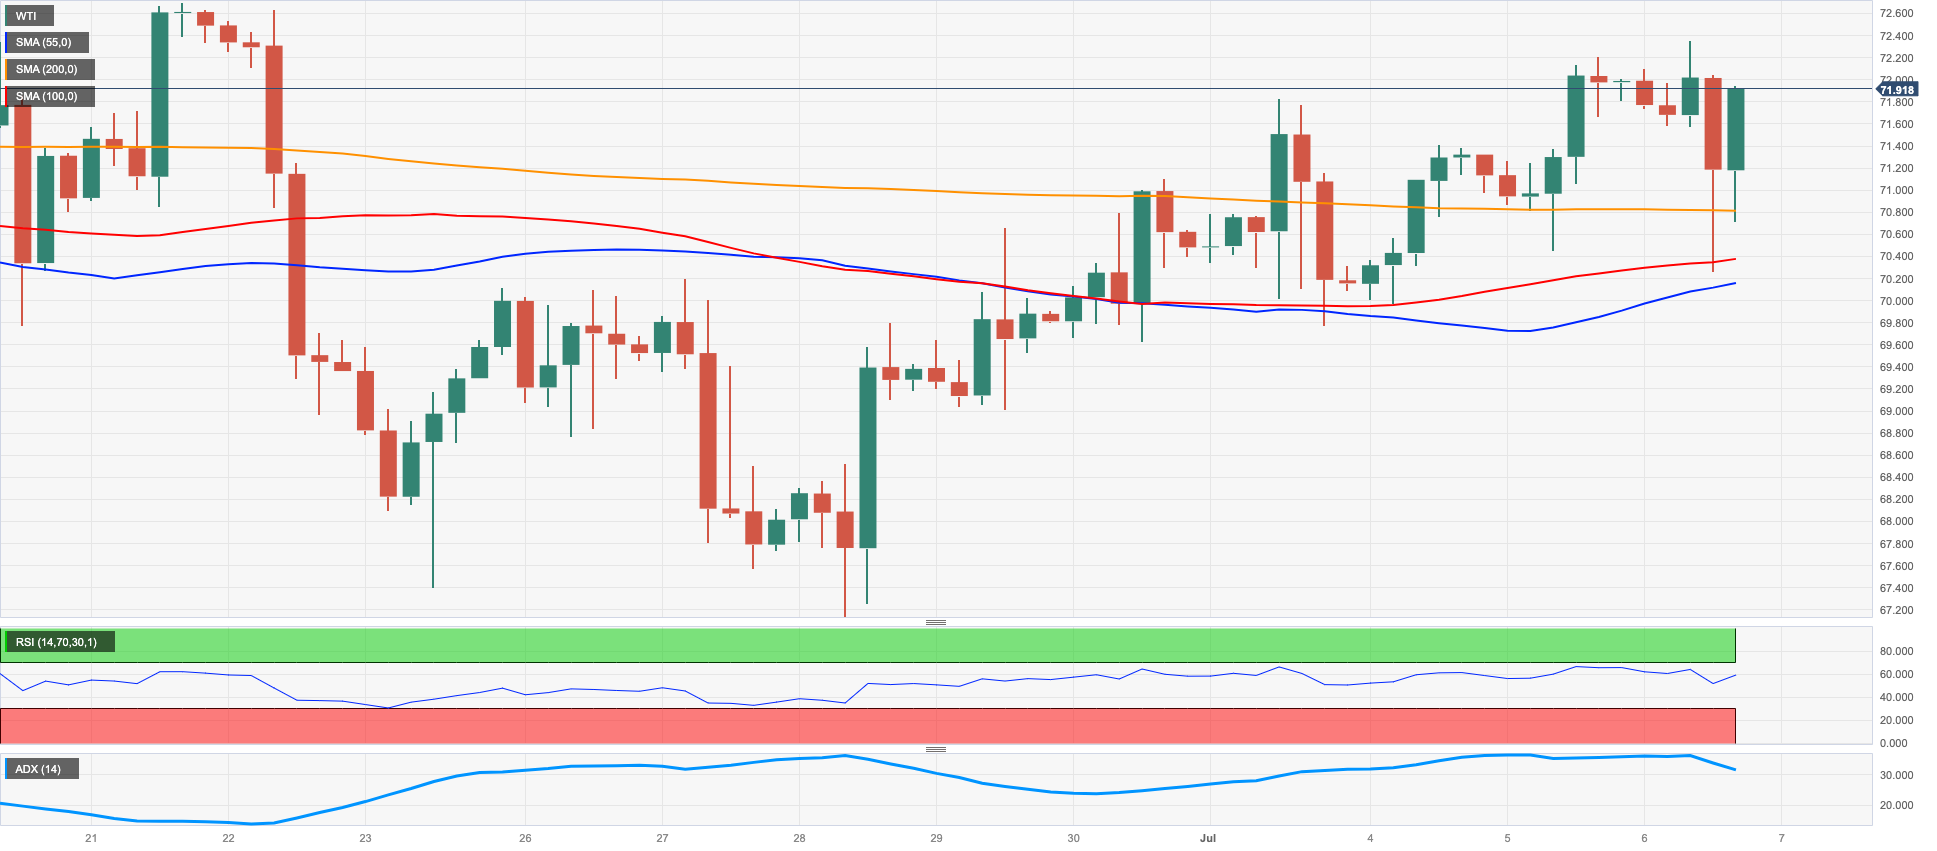
On Thursday, WTI prices faced downward pressure and ended two consecutive sessions without any gains.
Specifically, the price of a barrel of the American benchmark for sweet light crude oil approached the significant $70.00 level but then rebounded. This occurred as traders became concerned about a potential economic recession and speculation grew about the Federal Reserve implementing more restrictive monetary policies in the next months,
In the meantime, the daily decline came despite the EIA reported that US crude oil inventories dropped more than expected by 1.508M barrels in the week to June 30, while supplies at Cushing shrank by 0.400M barrels, Weekly Distillate Stocks decreased by 1.045M barrels and gasoline stockpiles went down by 2.550M barrels.
Prior to reaching the June high of $74.92 (June 5), WTI encounters immediate resistance at the weekly high of $72.68 (June 21). The 200-day SMA of $77.32 is followed by the weekly high of $79.14 (April 24) and the important barrier of $80.00 per barrel. A break above the latter predicts a rise to the 2023 high of $83.49 (April 12), followed by the November 2022 high of $93.73 (November 7). On the other hand, the first to be achieved is the June low of $66.86 (June 13), followed by the 2023 low of $63.61 (May 4), the December 2021 low of $62.46 (December 2), and the key level of $60.00 a barrel.
Resistance levels: $72.30 $73.24 $74.92 (4H chart)
Support levels: $70.26 $68.90 $67.01 (4H chart)
GER40
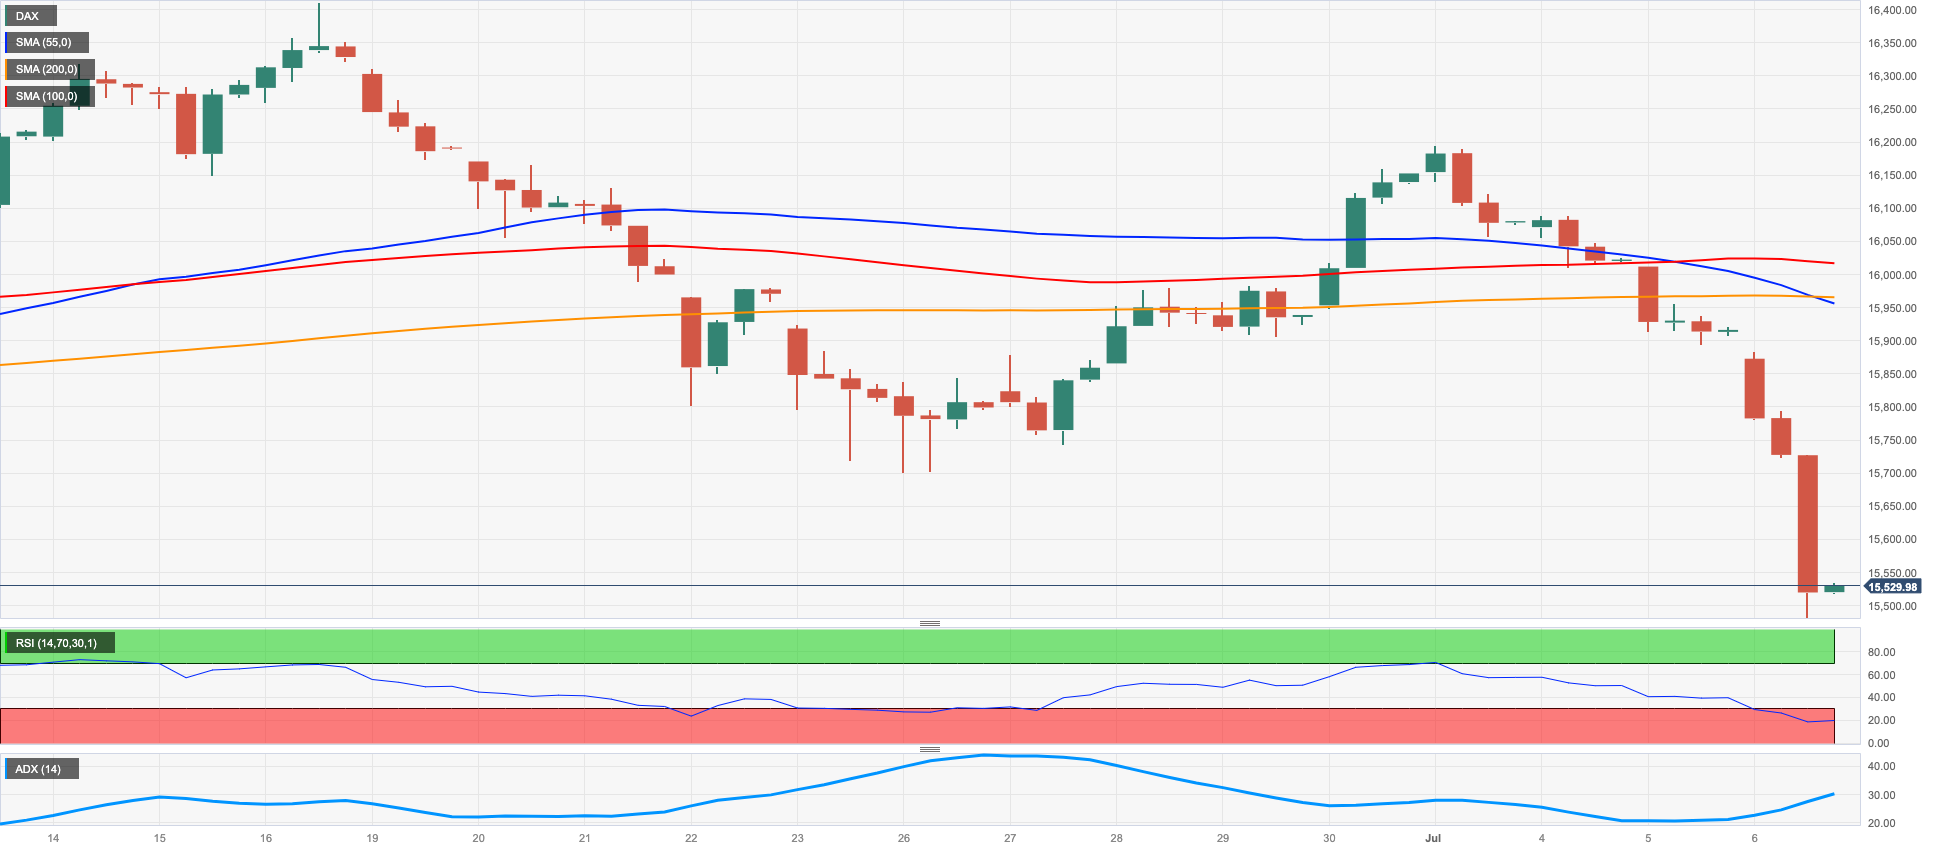
European stocks struggled mightily on Thursday, painting a grim picture in red across the continent.
The German DAX40 index was no exception as it brushed up against 4-month lows around 15500.
Investors' worries about the rising likelihood of a worldwide slowdown intensified after stronger-than-expected US economic data on Thursday, fueling speculation that the ECB, Federal Reserve and other central banks may need to tighten policy further.
Adding to apprehensions was the lingering concern that China's long-awaited economic rebound may take longer to materialize than initially anticipated.
Furthermore, German 10-year bond yields climbed to levels last seen in mid-March surpassing 2.60%, mirroring moves in their US counterparts.
In the docket, Factory Orders expanded more than expected by 6.4% MoM in May, while the HCOB Construction PMI weakened to 41.4 in June.
In light of the recent price action, further retracement should not be ruled out. On this, the April bottom of 15482 (April 5) turns up as the initial contention zone prior to the critical 200-day SMA at 14857 and before the March low of 14458 (March 20). On the upside, there is a temporary hurdle at the 55-day SMA at 15962 ahead of the weekly high of 16209 (July 3) and the all-time high of 16427 (June 16). The everyday RSI collapsed to the sub-35 region.
Best Performers: Qiagen, Merck, Symrise AG
Worst Performers: Vonovia, Adidas, Heidelbergcement
Resistance levels: 15917 16209 16427 (4H chart)
Support levels: 15495 14809 14458 (4H chart)
NASDAQ
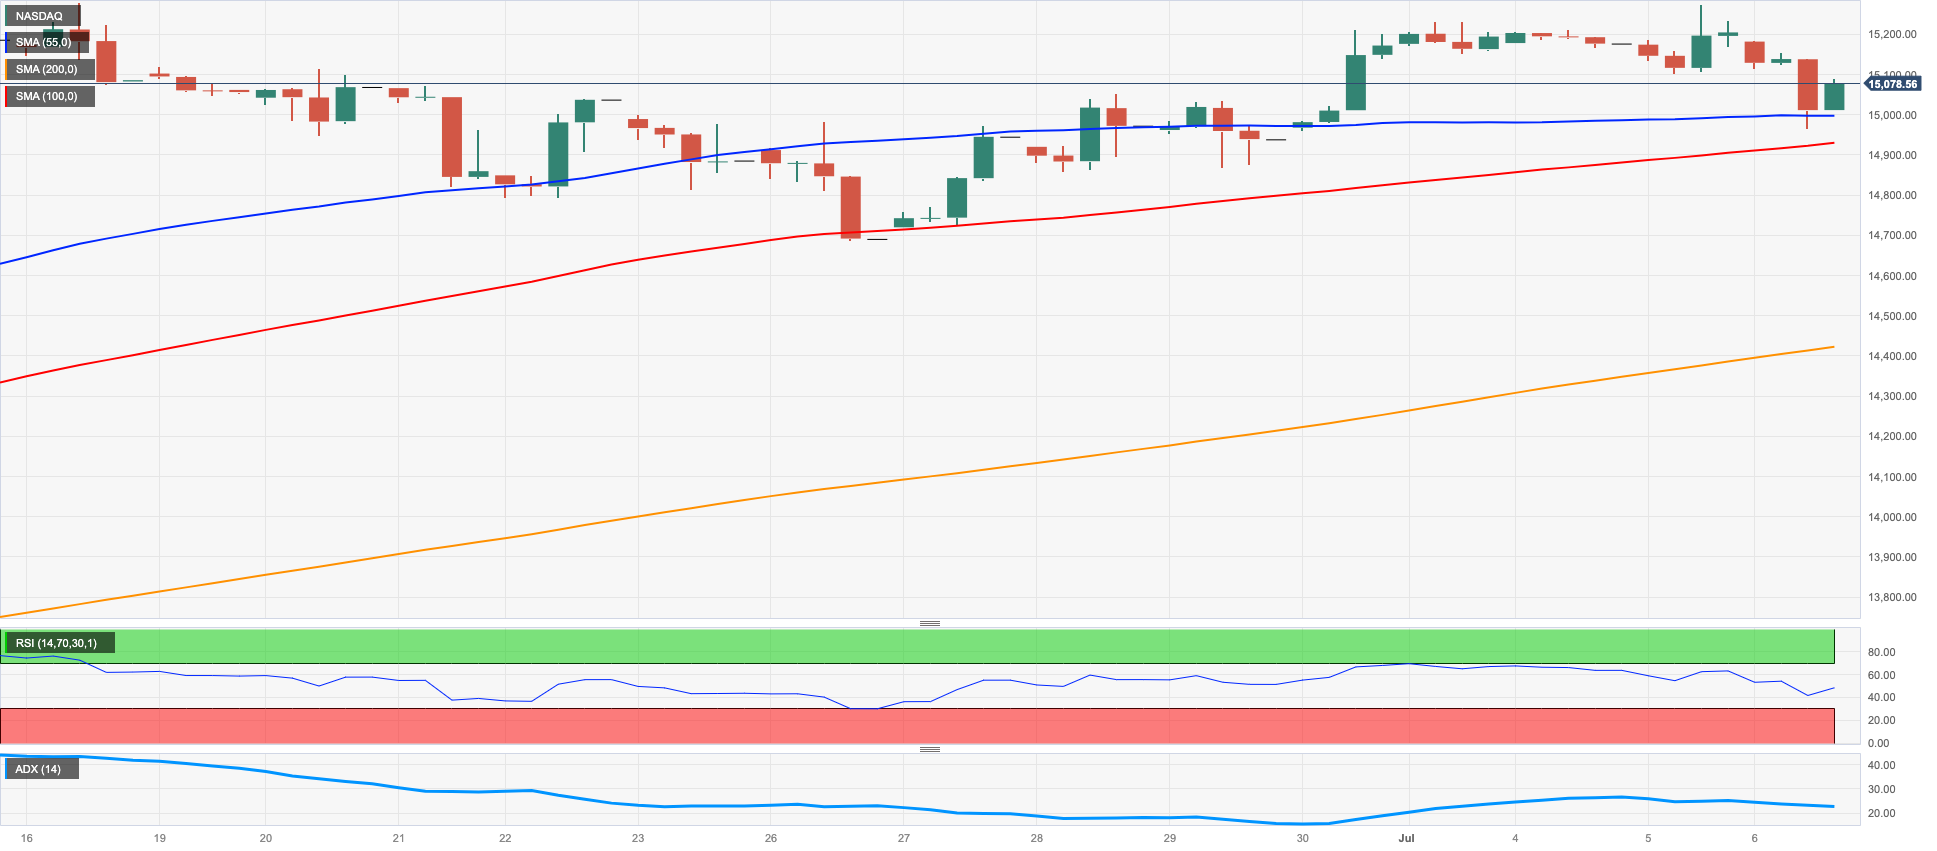
Tech stocks followed their US counterparts lower on Thursday.
Indeed, the sharp rise in US yields across all maturities combined with emerging concerns about the chip industry and unrelenting speculation of more tightening by the Fed all weighed on the index, resulting in a second straight daily drop.
Contributing to the renewed unease surrounding chipmakers, Treasury Secretary Janet Yellen travelled to Beijing for a series of meetings with Chinese officials over the weekend. The ongoing tensions between the US and China regarding technology and other issues have exacerbated worries in this area.
If further correction emerges in the near term, the Nasdaq 100 will encounter early support from weekly lows of 14687 (June 26) and 14283 (June 7), ahead of the transitory 55-day SMA at 14032 and another weekly low of 13520 (May 24). A further drop may take the price to the May low of 12938 (May 4), the April low of 12724 (April 25), the 200-day SMA at 12411, and the March low of 11695 (March 13). In contrast, the initial hurdle aligns at the 2023 high of 15284 (June 16) before reaching the round milestone of 16000. The daily RSI deflated below the 62 yardstick.
Top Gainers: Keurig Dr Pepper, Microsoft, ADP
Top Losers: MercadoLibre, Lucid Group, PDD Holdings DRC
Resistance levels: 15275 15284 16017 (4H chart)
Support levels: 14687 14283 13520 (4H chart)
DOW JONES
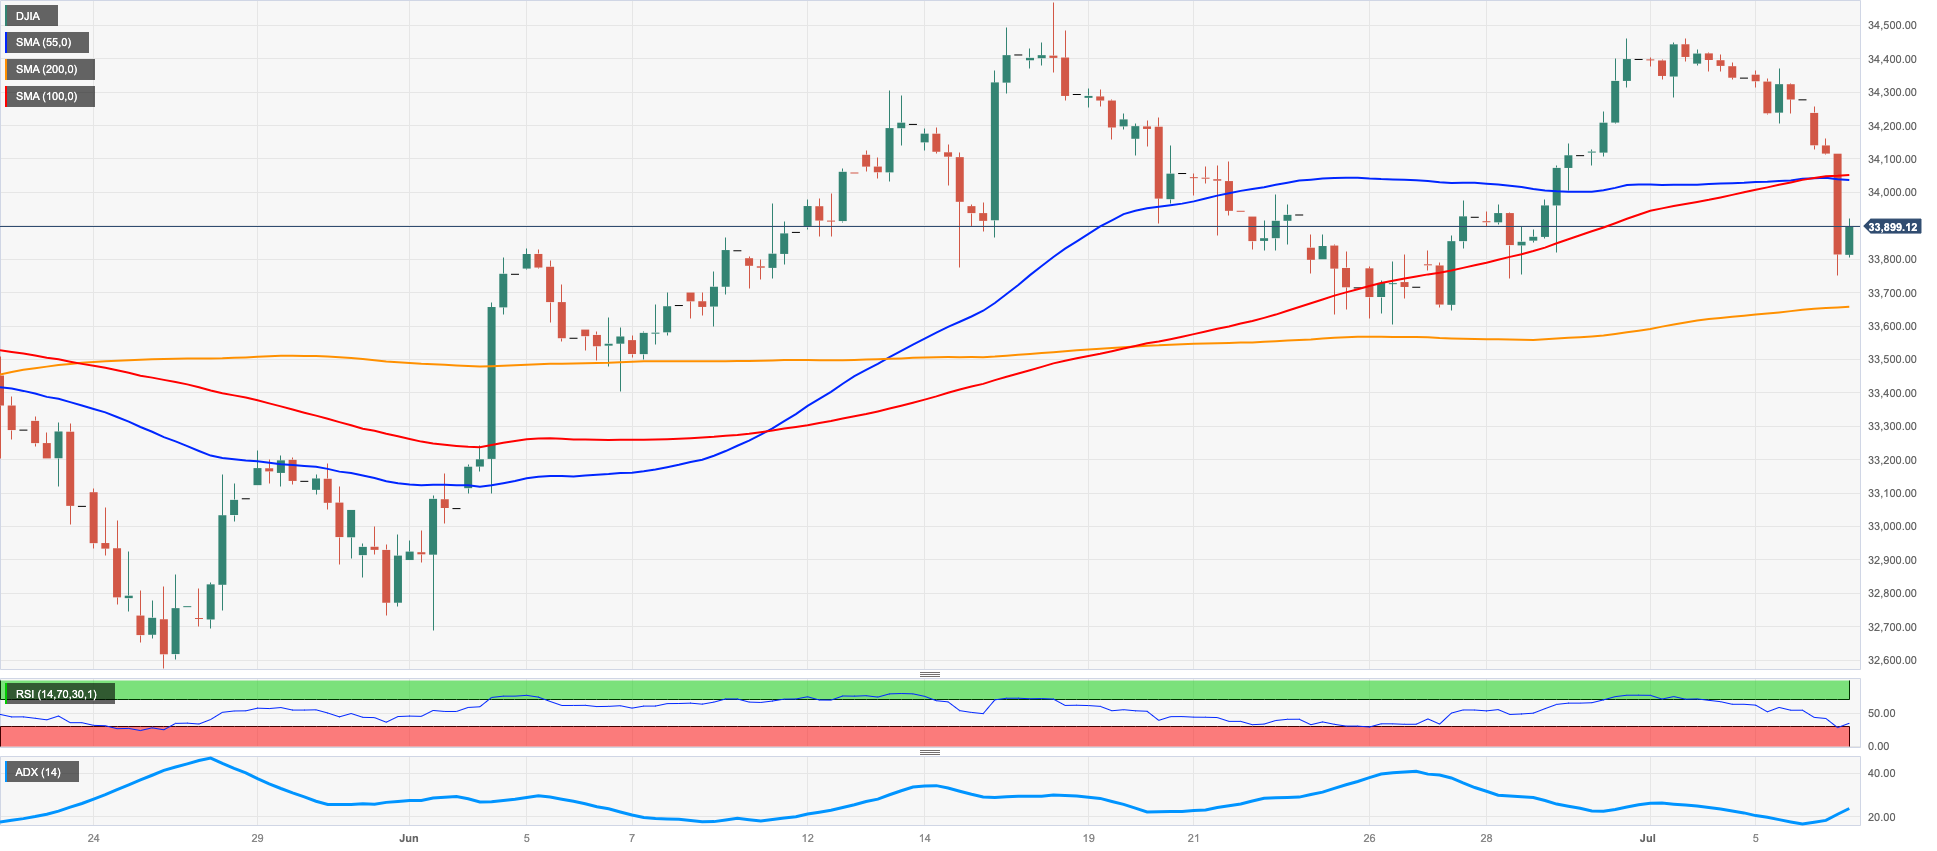
US stocks, as measured by the Dow Jones, declined for the second straight session on Thursday.
The downcast mood gripping global markets had a common root: worries of a recession caused by the highly likely scenario of tighter monetary policies in the months ahead, beginning with continued interest rate hikes expected from the Federal Reserve and European Central Bank at their upcoming meetings later this month.
Those concerns were once again fueled by stronger-than-expected US economic data earlier on Thursday and ahead of the pivotal release of the June jobs report on Friday.
On the whole, the Dow Jones retreated 1.06% to 33926, the S&P500 dropped 0.82% to 4410, and the tech-heavy Nasdaq Composite deflated 0.88% to 13670.
In case the Dow Jones accelerates its losses, it should meet interim contention at the 55-day SMA at 33667 prior to the weekly low of 33610 (June 26). Down from here aligns the interim 100-day SMA at 33371 seconded by the key 200-day SMA at 32962. The May low of 32586 (May 25), the March low of 31429 (March 15), and the October 2022 low of 28660 (October 13) are all lower support levels from here. On the contrary,
occasional bouts of strength should meet initial resistance at the June top of 34467 (June 30) prior to the 2023 high of 34588 (June 16) and the December 2022 peak of 34712 (December 13). North from here comes the April 2022 high of 35492 (April 21). The daily RSI slipped back to the 50 zone.
Top Performers: Microsoft, UnitedHealth, Apple
Worst Performers: Chevron, Nike, American Express
Resistance levels: 34467 34588 34712 (4H chart)
Support levels: 33610 33364 32586 (4H chart)
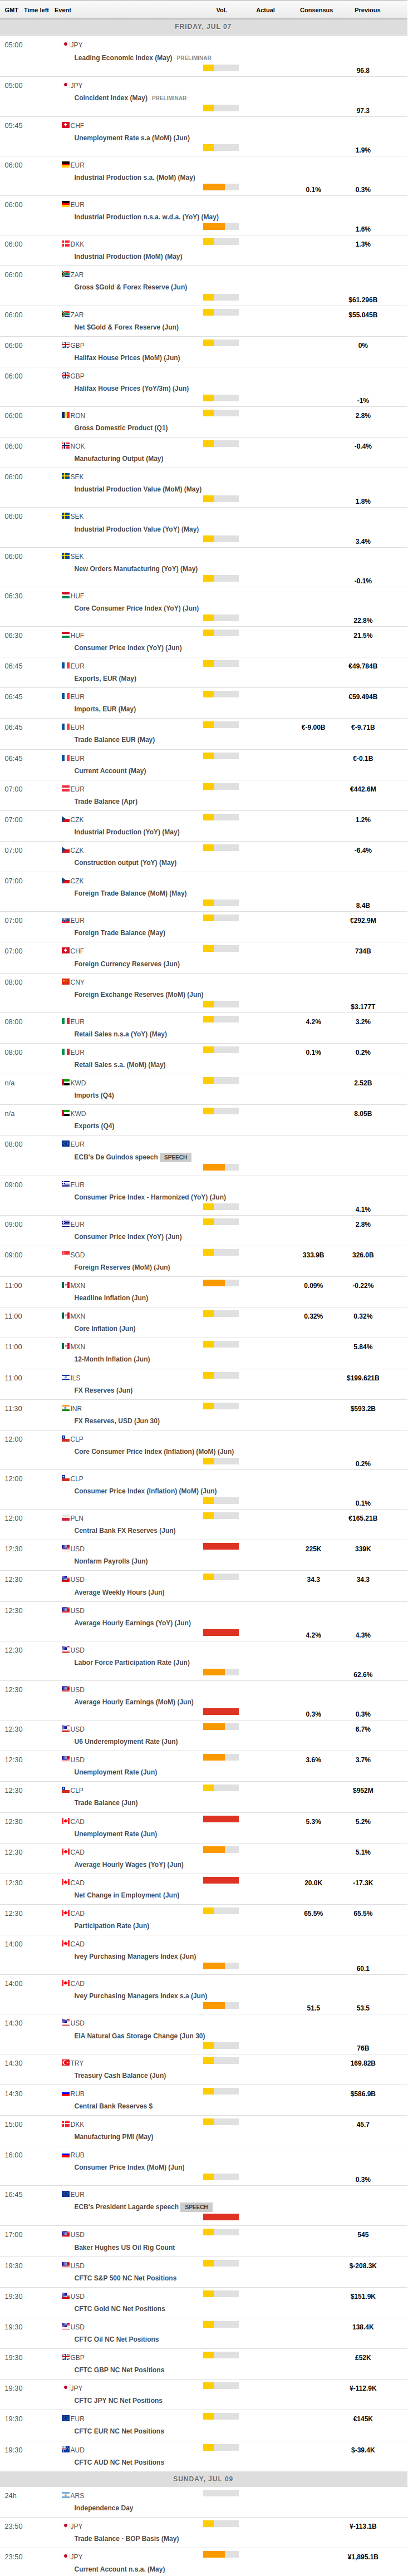
MACROECONOMIC EVENTS
All Information & Updates provided by:

All information relating to the financial markets available on this page has been prepared and issued by FXStreet (Forexstreet SL, Spain, Reg: B62498233) on the basis of publicly available information and all information believed to be reliable and does not conflict with Kuwaiti local laws, and all necessary care has been taken to before the company to ensure that the facts mentioned are correct from the source.
NCM Investment nor any of its directors or employees shall in any way be held responsible for the contents of this news, and the information contained on this page is intended only to provide clients with publicly available information and should not be construed as investment advice, report or analysis and/or constitute an offer or invitation to buy or sell financial instruments of any kind.
RISK WARNING: Forex and CFDs are highly risky leveraged products, as losses can exceed deposits. Please ensure you understand all the risks and take independent advice if necessary. NCM will segregate the clients based on the criteria of the regulator and its bylaws. NCM does not provide any advisory service; the material published does not constitute advice or a recommendation for a transaction in any financial instrument. NCM accepts no responsibility for any use of the content presented and any consequences of that use. Anyone acting on the information provided does so at their own risk.