
- Contact Us:
-

-

-

-


Daily Market Updates
10 Jul 2023
USDJPY
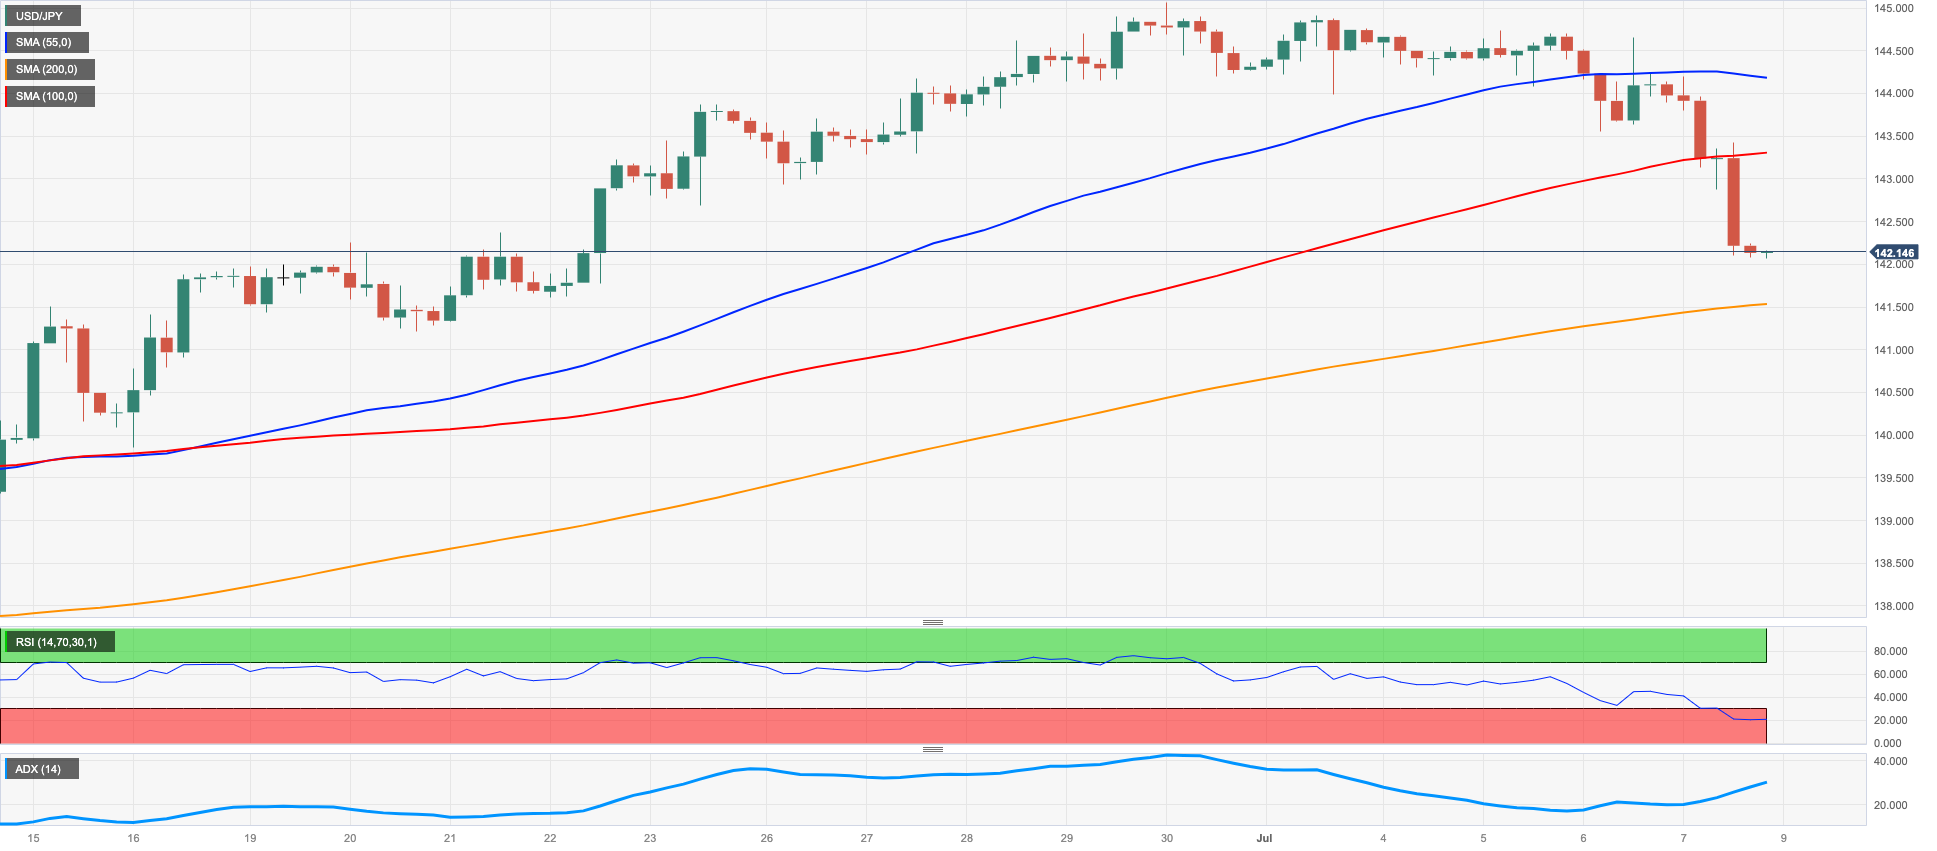
On Friday, the USD/JPY pair experienced a significant drop of almost 1.5%, closing at its lowest level in several sessions near the 142.00 mark. This marked the first weekly decline in three consecutive weeks.
The sudden fall in the value of the dollar, combined with growing concerns about the possibility of intervention in the FX markets by the Japanese government, were the primary factors behind this sharp decline. These developments caused a sense of unease among investors and led to a second daily retracement in the spot at the end of the week.
In the Japanese calendar, Household Spending contracted 4.0% in the year to May and preliminary readings for the month of May saw the Coincident Index at 113.8 and the Leading Economic Index at 109.5
Following Friday’s strong decline, USD/JPY is likely to face immediate support at the June low of 138.42 (June 1), with additional conflict at the pivotal 200-day SMA of 137.20. If the pair continues to fall, the 100-day SMA at 136.77, the weekly low at 133.01 (April 26), and minor support at 132.01 (April 13) may offer additional support ahead of the April low of 130.62 (April 5) and critical support at 130.00. On the upside, the continuation of the USD/JPY rise should initially test the 2023 top of 145.07 (June 30), followed by the October 2022 high of 151.94 (October 21), and the round level of 152.00. On the daily chart, the RSI sank below the 50 threshold.
Resistance levels: 144.65 145.07 146.79 (4H chart)
Support levels: 142.06 141.21 139.85 (4H chart)
GBPUSD
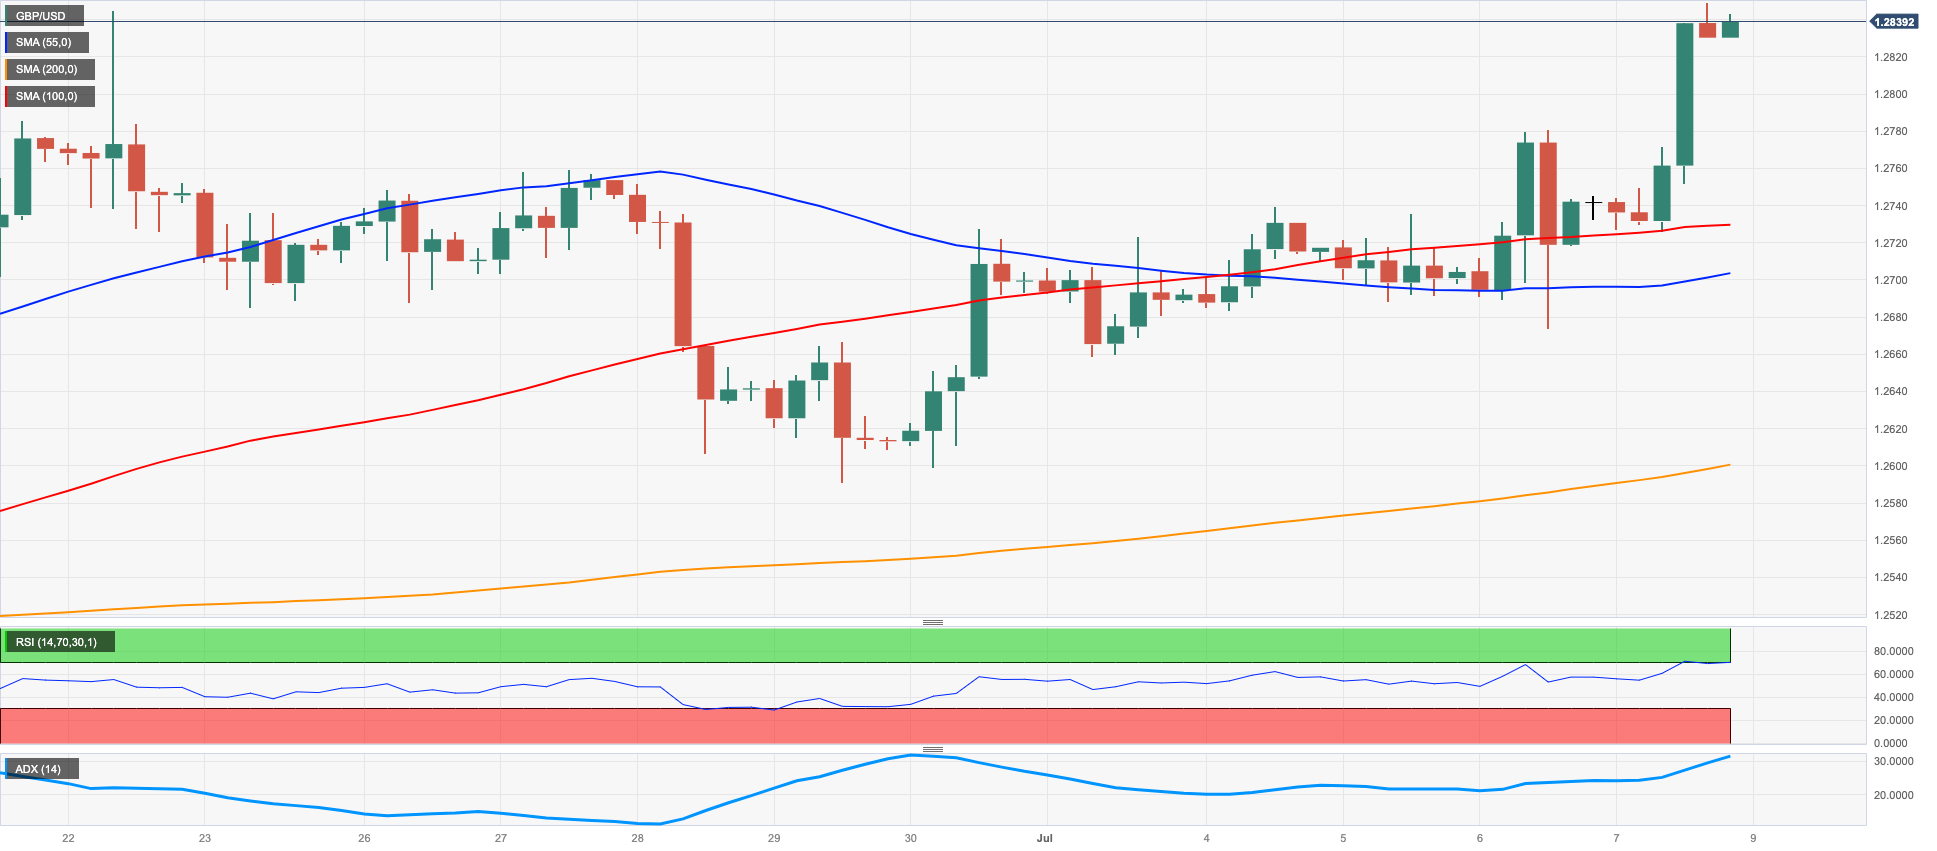
The British pound gathered strong momentum on Thursday and surged to levels above 1.2850 against the U.S. dollar, lifting GBP/USD to its highest point since April 2022.
In tandem with other major currencies, the quid advanced decidedly and broke above the 1.2800 resistance level in emphatic fashion underpinned by the sharp decline in the greenback, which deepened following the release of June's job report showing a solid increase in payrolls of 209 jobs.
Meanwhile, the positive near-term outlook for the pound appears to be supported by expectations of further policy tightening by the BoE in an environment where inflation continues to show no signs of abating in the UK.
There were no economic data releases from the UK on Friday.
GBP/USD clinched a new 2023 high at 1.2849 on July 7. That said, cable now faces the next up-barrier at the 200-week SMA at 1.2879 before hitting the key 1.3000 barrier. In contrast, the weekly low of 1.2590 (June 29) provides immediate support ahead of the zone around 1.2550, which coincides with the trend line from 2021 to 2023 and the transitory 55-day SMA. The June low of 1.2368 (June 5) comes next, followed by the May low of 1.2308 (May 25) and the April low of 1.2274 (April 3). The breach of the latter shows the 200-day SMA at 1.2155. The daily RSI improved to the proximity of 66.
Resistance levels: 1.2849 1.3089 1.3146 (4H chart)
Support levels: 1.2673 1.2590 1.2486 (4H chart)
AUDUSD
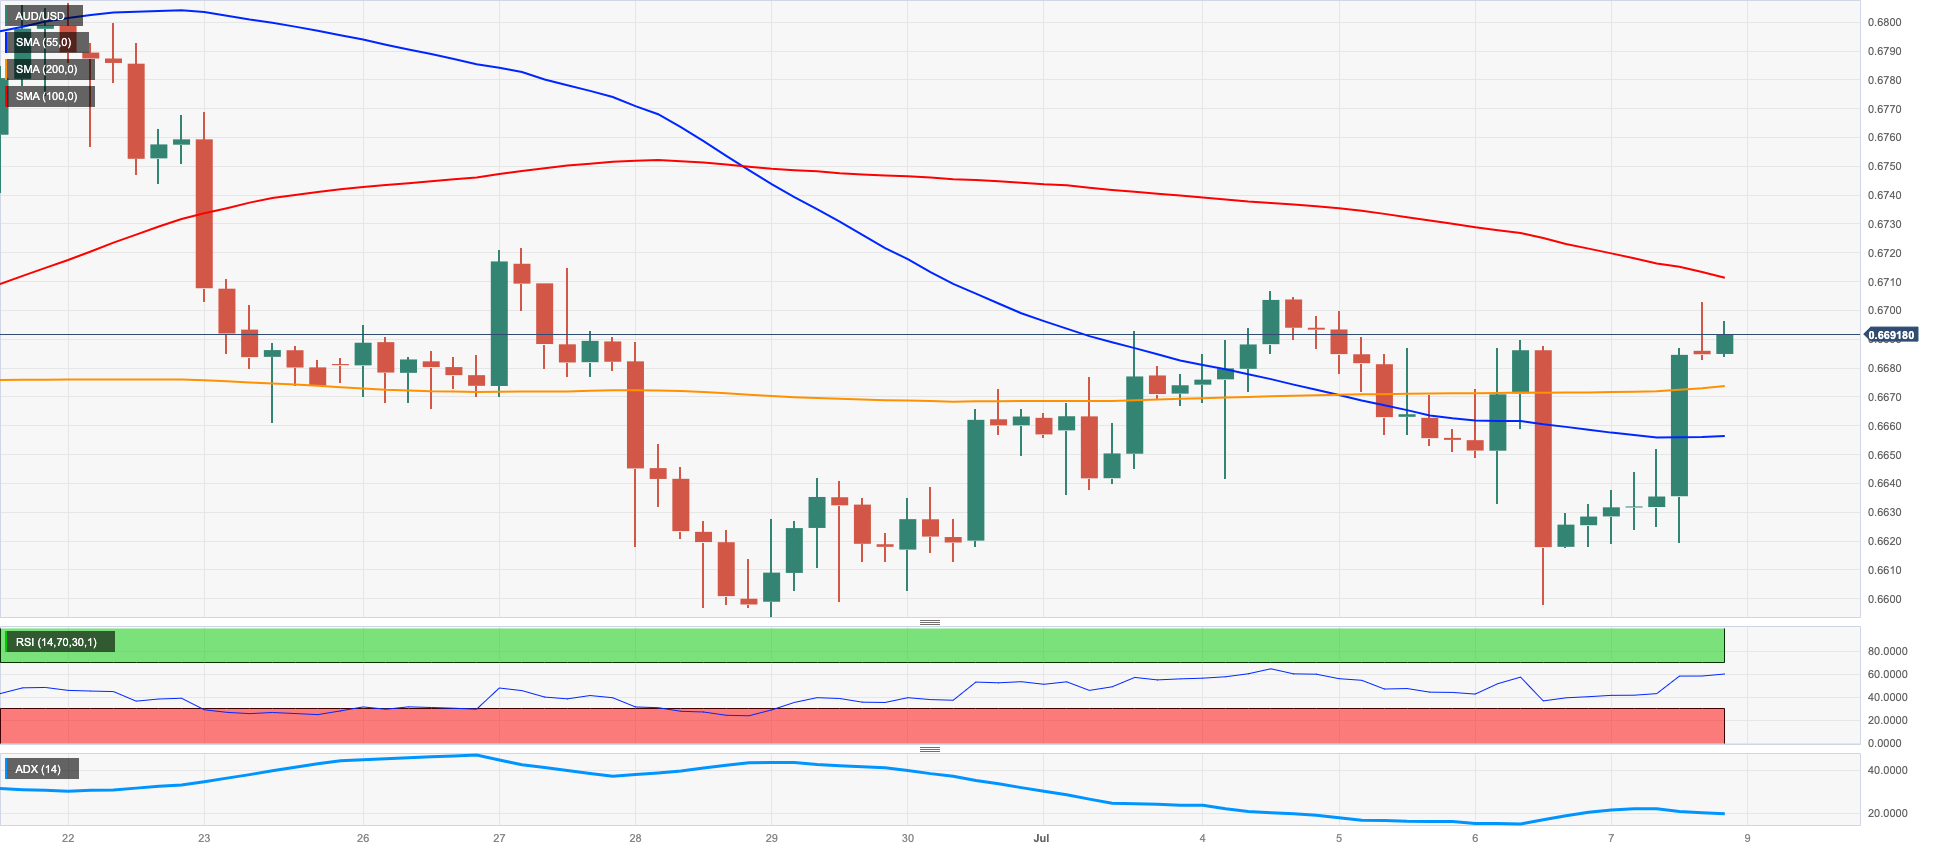
AUD/USD rebounded and reversed its previous two-day decline, reclaiming the 0.6700 level by the end of the week. This level is also significant as it aligns with the critical 200-day SMA.
The Aussie dollar’s sharp upward movement was supported by an equally strong retracement in the US dollar, albeit in the opposite direction. Interestingly, the pair seemed unaffected by the overall bearish sentiment in the commodity market, which only highlighted a small rebound in copper prices.
On Friday, there were no major economic events or releases on the Australian calendar.
A more serious recovery now needs AUD/USD to break above the weekly high of 0.6720 (June 27) before reaching the June top of 0.6899 (June 16). Beyond that, the crucial 0.7000 level, the weekly peak of 0.7029 (February 14), and the 2023 top of 0.7157 (February 2) are all critical milestones to monitor. Having said that, a break below the weekly low of 0.6595 (June 29) might trigger a drop to the 2023 low of 0.6458 (May 31). South from here emerges the November 2022 low of 0.6272 (November 3) and the 2022 low of 0.6169 (October 13). The everyday RSI surpassed the 50 mark.
Resistance levels: 0.6705 0.6720 0.6806 (4H chart)
Support levels: 0.6599 0.6579 0.6458 (4H chart)
GOLD
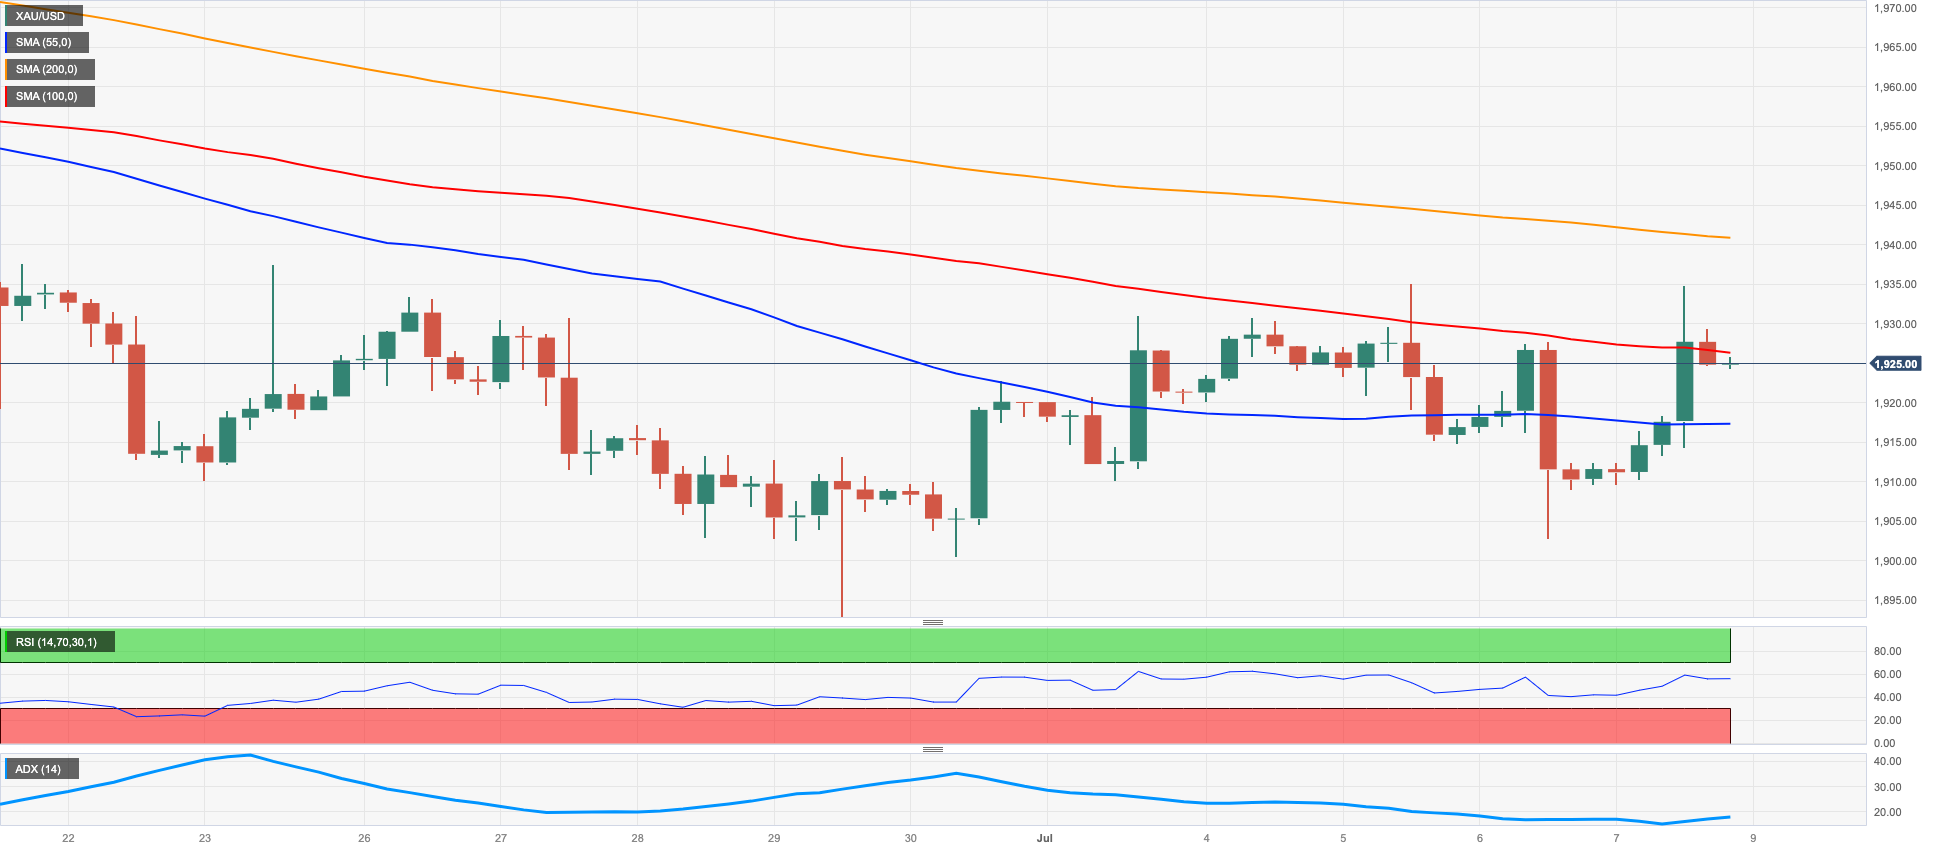
After experiencing two consecutive daily declines, the price of gold per troy ounce ended the week on a positive note.
The intense sell-off of the US dollar and the subsequent drop of the USD Index (DXY) to a two-week low near 102.20 propelled gold to revisit the level above $1930.
Although the rise in the value of the precious metal was largely due to the weakening of the greenback, the potential for further gains was somewhat limited by an increase in US yields in the 10-year to 30-year segment.
Looking ahead, the price of gold is expected to remain under close observation prior to the release of US inflation figures for June on July 12.
Gold prices seem to have entered a consolidative phase. The breakdown of this theme exposes an initial support at the June low of $1893 (29 June) prior to the significant 200-day SMA at $1864 and the 2023 low of $1804 (28 February), both of which are ahead of the key $1800 barrier. Instead, the initial up-barrier occurs at the temporary 100-day and 55-day SMAs of $1947 and $1964, respectively, before hitting the June high of $1983 (June 2), which precedes the critical $2000 mark. There is no strong resistance to the north until the 2023 peak at $2067 (4 May), which follows the 2022 top at $2070 (8 March) and ultimately the all-time high at $2075 (7 August 2020).
Resistance levels: $1935 $1941 $1983 (4H chart)
Support levels: $1902 $1893 $1885 (4H chart)
CRUDE WTI
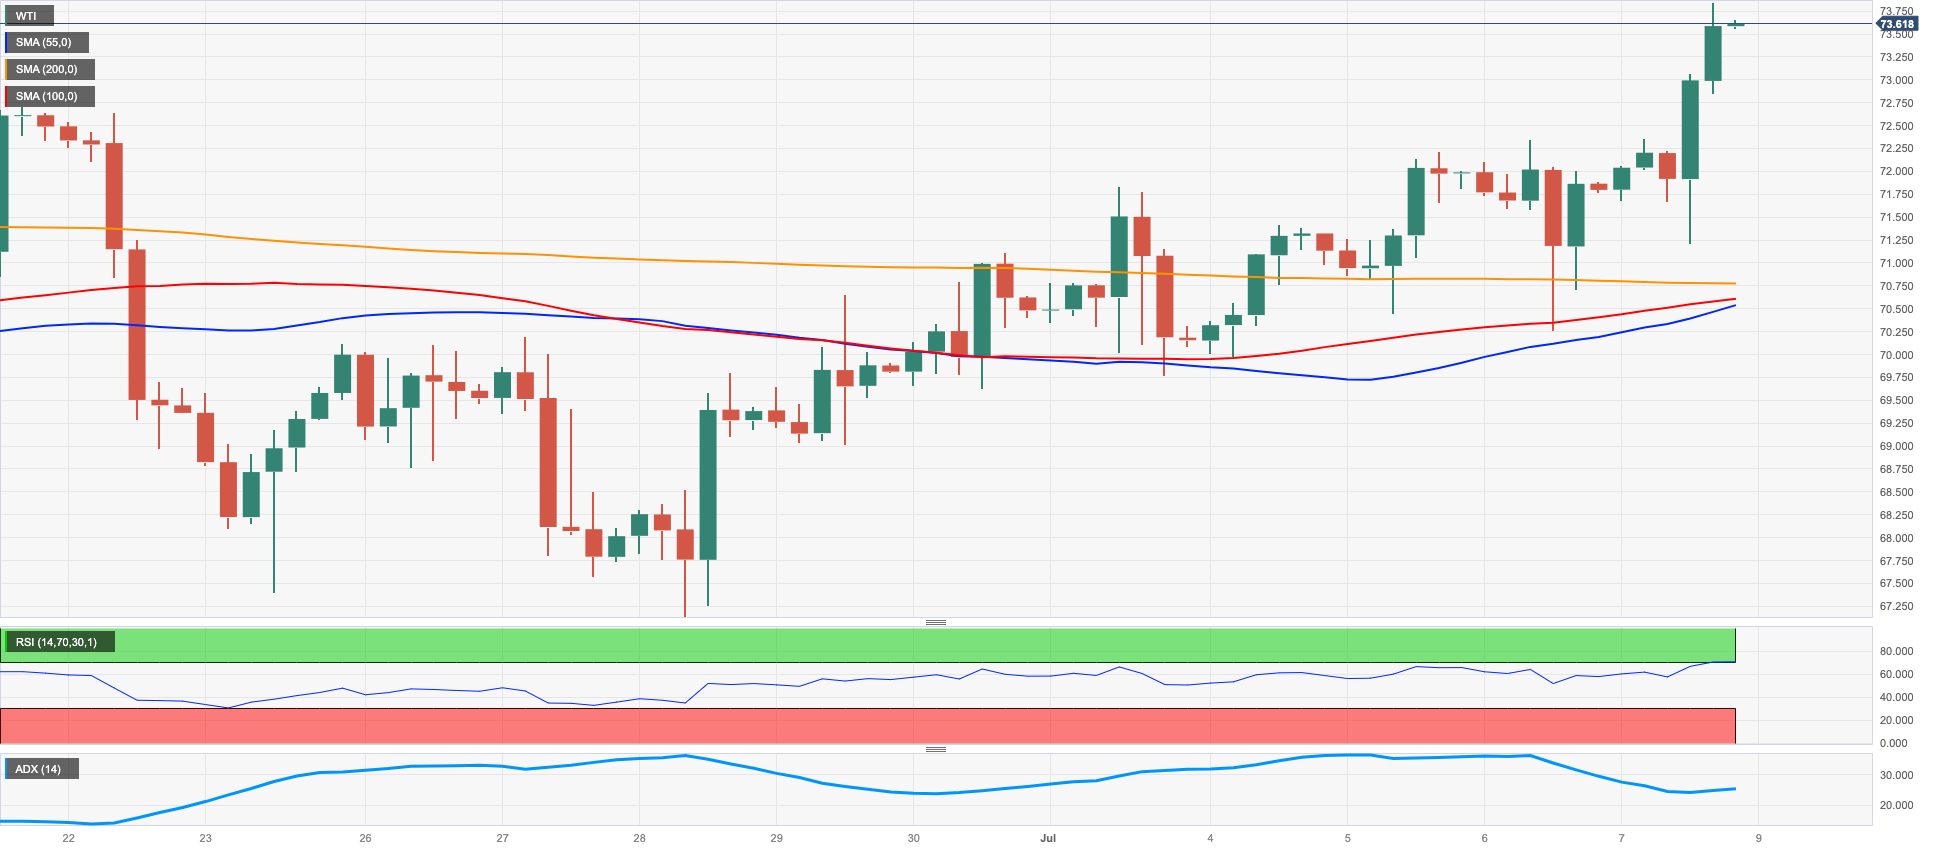
WTI prices continued their upward trend during the week and reached nearly $74.00 per barrel on Friday, marking a 4-week high and flirting with the 100-day SMA.
The positive price movement was primarily supported by renewed concerns about the global oil supply, which was further reinforced by recent announcements from Saudi Arabia and Russia regarding reductions in oil production and exports.
Traders also found encouragement from the significant decline in the value of the US dollar and the unexpected decrease in US crude oil inventories reported by the EIA on Thursday.
In terms of drilling activity, the latest data from Baker Hughes revealed a slight decrease in the number of US total oil rigs, which declined from 545 to 540 in the week ending July 7.
WTI meets immediate resistance at the June high of $74.92 (June 5) ahead of the 200-day SMA of $77.31 and the weekly top of $79.14 (April 24). The breakout of the latter could challenge the significant barrier of $80.00 per barrel seconded by the 2023 peak of $83.49 (April 120 and the November 2022 high of $93.73 (November 7). On the downside, the initial contention emerges at the June low of $66.86 (June 13) prior to the 2023 low of $63.61 (May 4), the December 2021 low of $62.46 (December 2), and the crucial level of $60.00 a barrel.
Resistance levels: $73.99 $74.92 $76.89 (4H chart)
Support levels: $70.74 $69.66 $67.01 (4H chart)
GER40
European stocks generally ended the day with gains, except for Spain's IBEX35 and the UK's FTSE100.
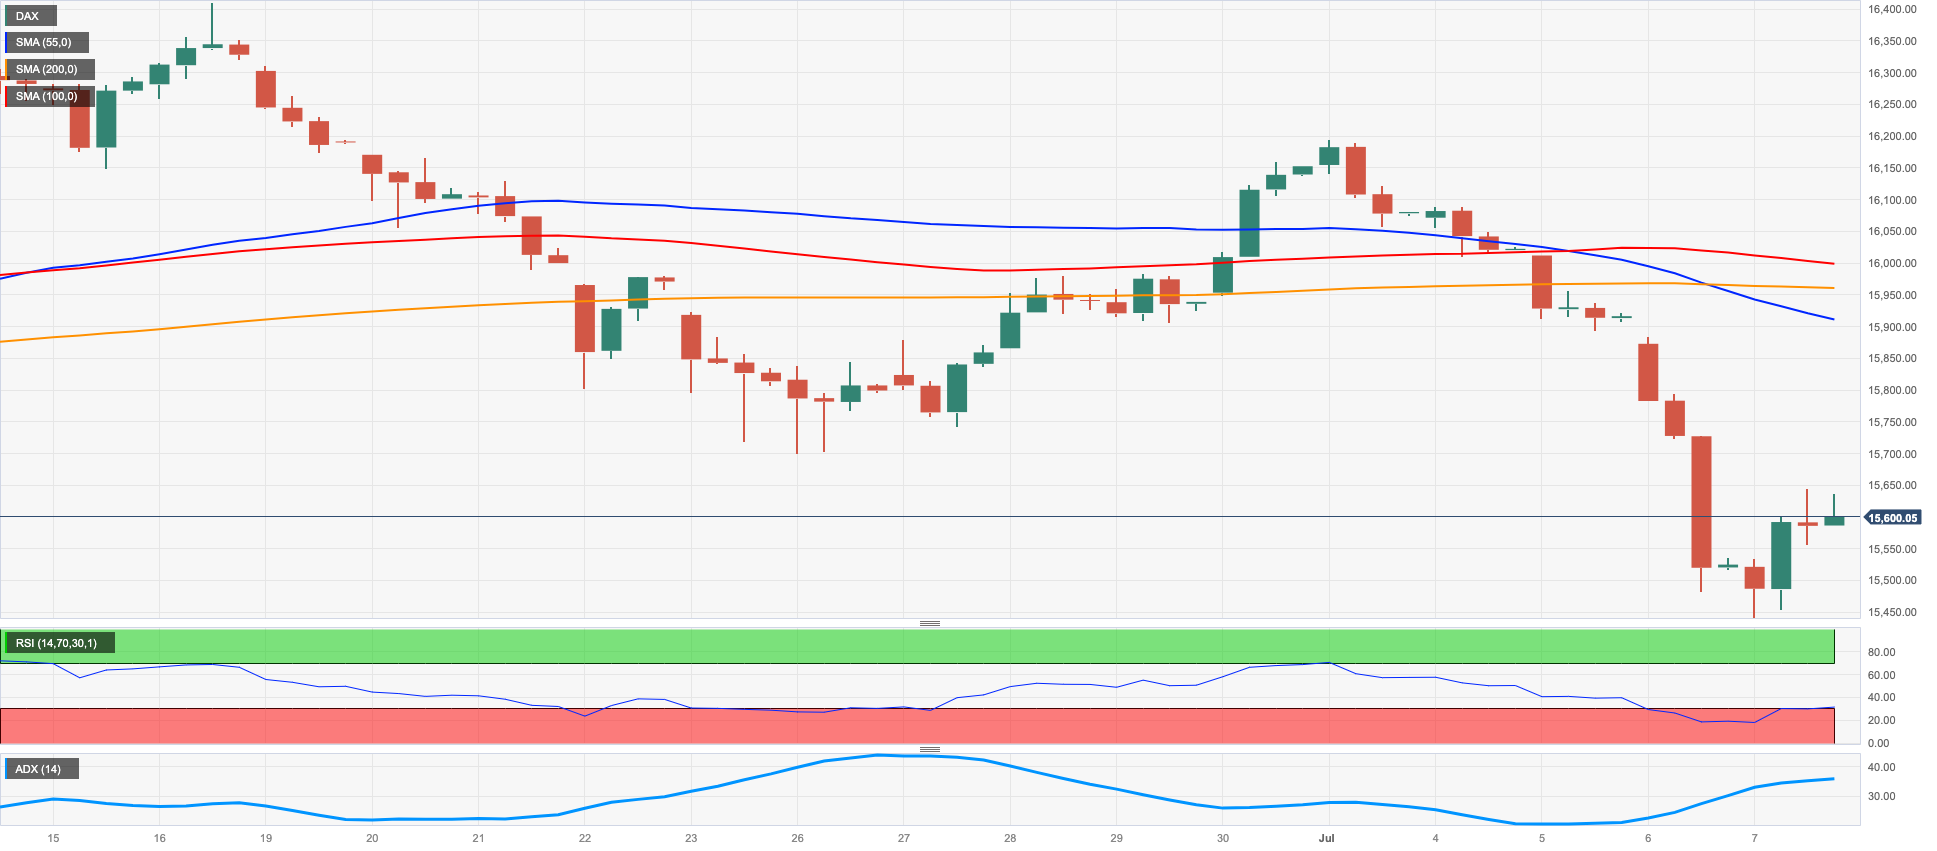
In Germany, stocks represented by the DAX40 experienced decent gains after four consecutive days of declines. The index managed to recover the 15600 level after reaching a 4-month low near 15400 earlier in Friday's trading session.
Going forward, the DAX40 is expected to face close scrutiny as the ECB is likely to continue its tightening measures, while the prospects of a global economic slowdown also pose challenges in the short term.
In addition, the index's upward movement was accompanied by a significant rebound in German 10-year bund yields, approaching the 2.70% range for the first time since early March.
In terms of economic data, the only release on Friday was the monthly contraction of 0.2% in Industrial Production for May.
The DAX40 clinched a new July low at 15456 on July 7. The loss of this level could put the critical 200-day SMA at 14873 to the test ahead of the March low of 14458 (March 20) and the December 2022 low of 13791 (December 20). On the upside, there is a transitory hurdle at the 55-day SMA at 15959 before the weekly high of 16209 (July 3) and the all-time high of 16427 (June 16). The everyday RSI bounced past the 37 level.
Best Performers: BASF, Covestro, Commerzbank
Worst Performers: Heidelbergcement, Beiersdorf AG, Qiagen
Resistance levels: 15916 16209 16427 (4H chart)
Support levels: 15456 14809 14458 (4H chart)
NASDAQ
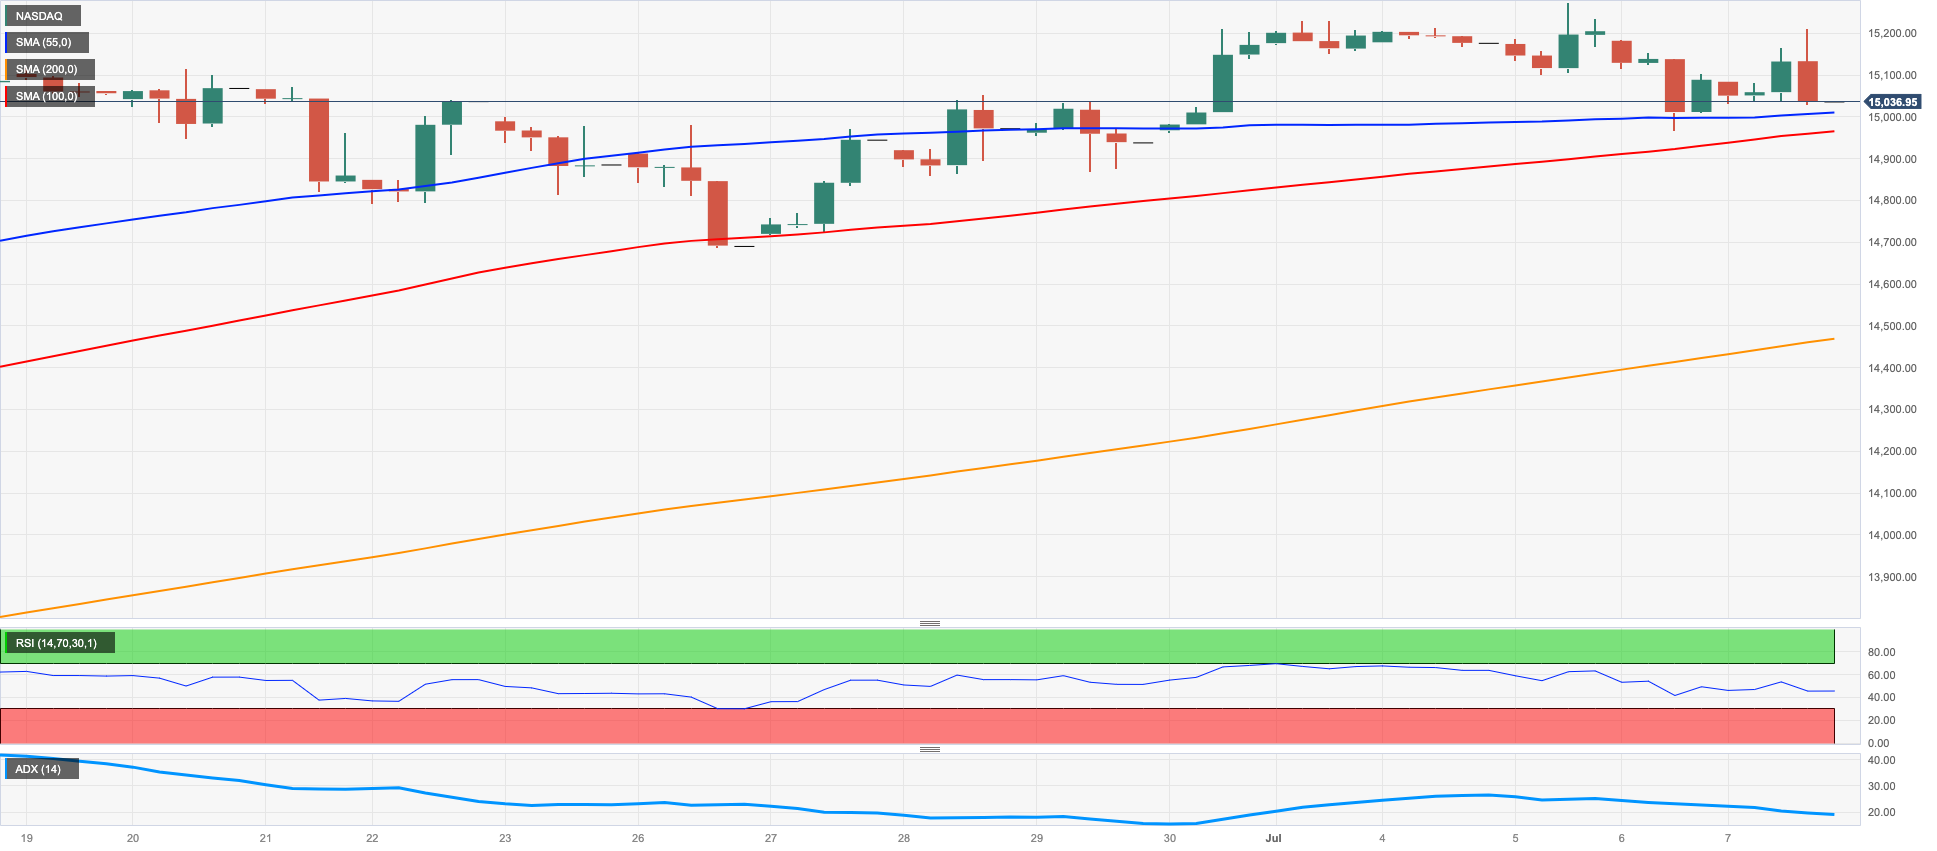
The US tech benchmark Nasdaq 100 fell for the third consecutive day on Friday and closed just above the key 15000 level. The index gave back some of its previous weekly gains, although it remained in the upper end of its trading range and not far from its yearly highs.
Higher US yields, particularly in the belly and the long end of the curve, as well as expectations of further rate hikes by the Fed weighed on investor sentiment and led to another down day for the tech index.
If the Nasdaq 100 continues to fall in the near term, it will find early support from weekly lows of 14687 (June 26) and 14283 (June 7), as well as the provisional 55-day SMA at 14067 and another weekly low of 13520 (May 24). A further decline might send the price below the May low of 12938 (May 4), the April low of 12724 (April 25), the 200-day SMA of 12426, and the March low of 11695 (March 13). The initial barrier, on the other hand, aligns at the 2023 high of 15284 (June 16) ahead of the round milestone of 16000. The daily RSI broke below the 60 level.
Top Gainers: Lucid Group, JD.com Inc Adr, Baker Hughes
Top Losers: Biogen, Gilead, Palo Alto Networks
Resistance levels: 15275 15284 16017 (4H chart)
Support levels: 14687 14283 13520 (4H chart)
DOW JONES
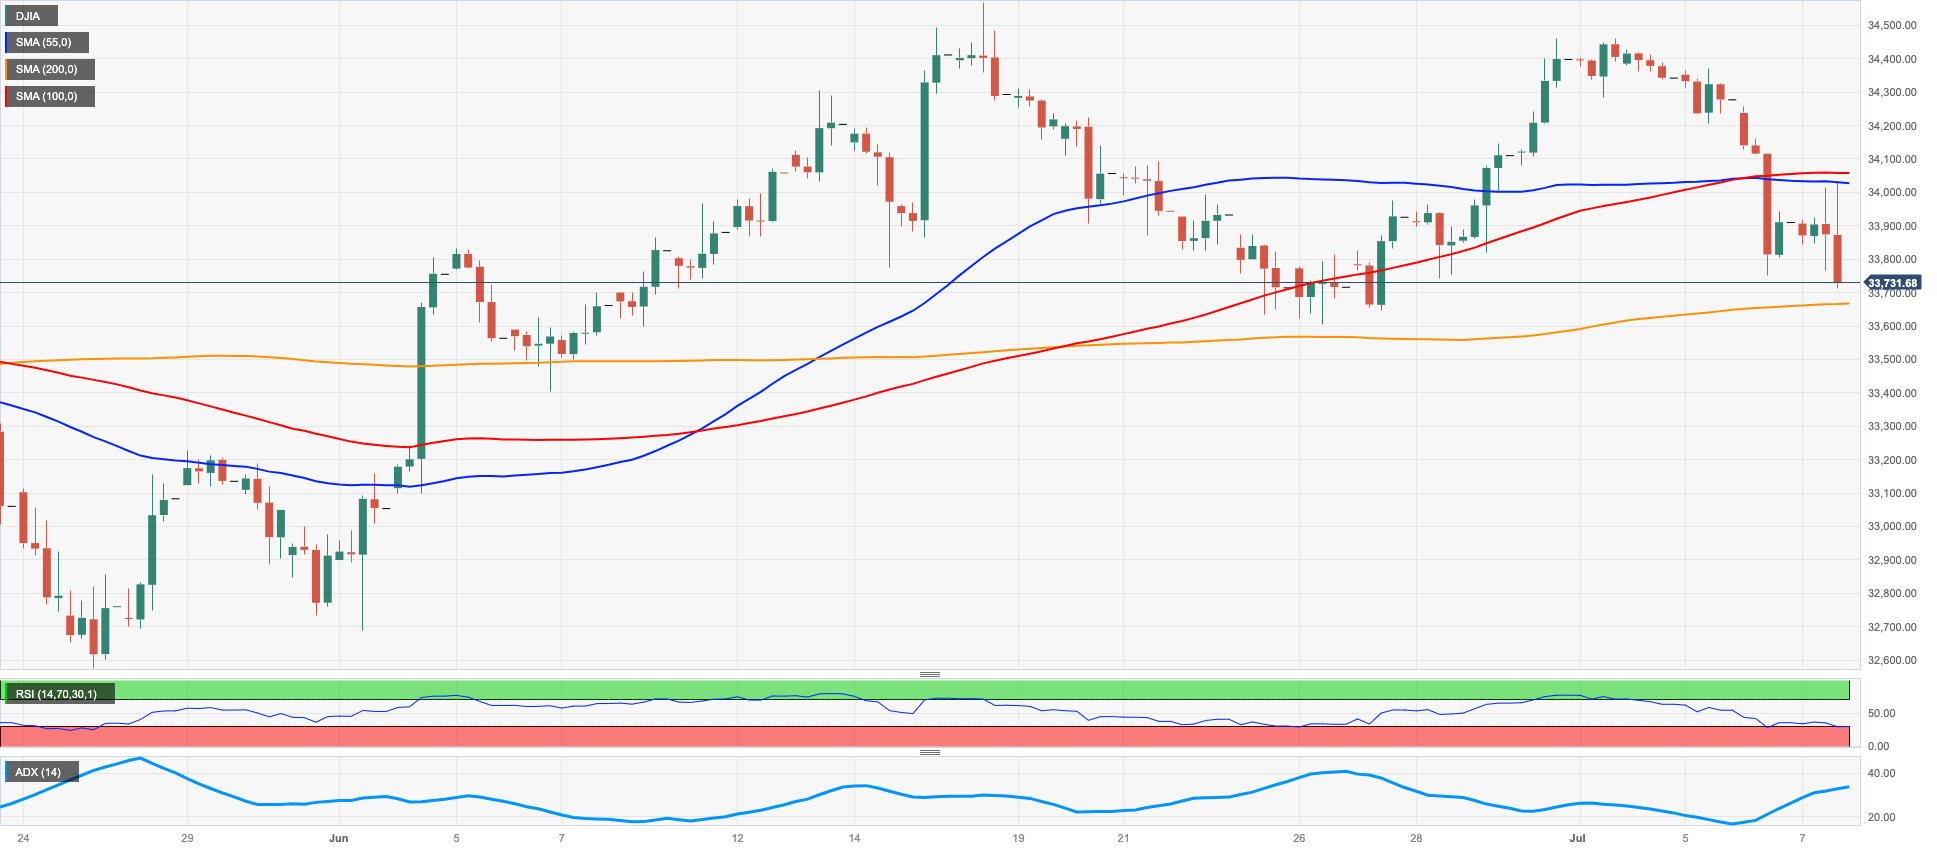
U.S. stocks, as measured by the Dow Jones, fell for the third straight session on Friday and neared the 33700 region where the 55-day SMA also sits.
Investors remained in a dour mood despite signs that job creation slowed in June according to the nonfarm payrolls report (+209K jobs).
However, expectations remain for another quarter-point rate hike by the Federal Reserve later this month. Some investors have also begun to factor in the potential for an additional rate increase in September as inflation continues to run hot, well above the Fed's target, and the labour market cools at a slower pace than anticipated.
All in all, the Dow Jones deflated 0.55% to 33734, the S&P500 retreated 0.29% to 4398, and the tech-focused Nasdaq Composite dropped 0.13% to 13660.
If the Dow Jones continues to fall, it should find initial support at the weekly low of 33610 (June 26). The provisional 100-day SMA at 33370 is aligned with the crucial 200-day SMA at 32976. Lower support levels from here are the May low of 32586 (May 25), the March low of 31429 (March 15), and the October 2022 low of 28660 (October 13). On the contrary, brief bursts of strength should encounter early opposition at the June peak of 34467 (June 30), before the 2023 high of 34588 (June 16) and the December 2022 top of 34712 (December 13). The April 2022 high of 35492 (April 21) is north of here. The day-to-day RSI dropped to the sub-47 region.
Top Performers: Caterpillar, 3M, Chevron
Worst Performers: Merck&Co, Walmart, Procter&Gamble
Resistance levels: 34467 34588 34712 (4H chart)
Support levels: 33610 33365 32586 (4H chart)
MACROECONOMIC EVENTS

All Information & Updates provided by:

All information relating to the financial markets available on this page has been prepared and issued by FXStreet (Forexstreet SL, Spain, Reg: B62498233) on the basis of publicly available information and all information believed to be reliable and does not conflict with Kuwaiti local laws, and all necessary care has been taken to before the company to ensure that the facts mentioned are correct from the source.
NCM Investment nor any of its directors or employees shall in any way be held responsible for the contents of this news, and the information contained on this page is intended only to provide clients with publicly available information and should not be construed as investment advice, report or analysis and/or constitute an offer or invitation to buy or sell financial instruments of any kind.
RISK WARNING: Forex and CFDs are highly risky leveraged products, as losses can exceed deposits. Please ensure you understand all the risks and take independent advice if necessary. NCM will segregate the clients based on the criteria of the regulator and its bylaws. NCM does not provide any advisory service; the material published does not constitute advice or a recommendation for a transaction in any financial instrument. NCM accepts no responsibility for any use of the content presented and any consequences of that use. Anyone acting on the information provided does so at their own risk.