
- Contact Us:
-

-

-

-


Daily Market Updates
11 Jul 2023
USDJPY
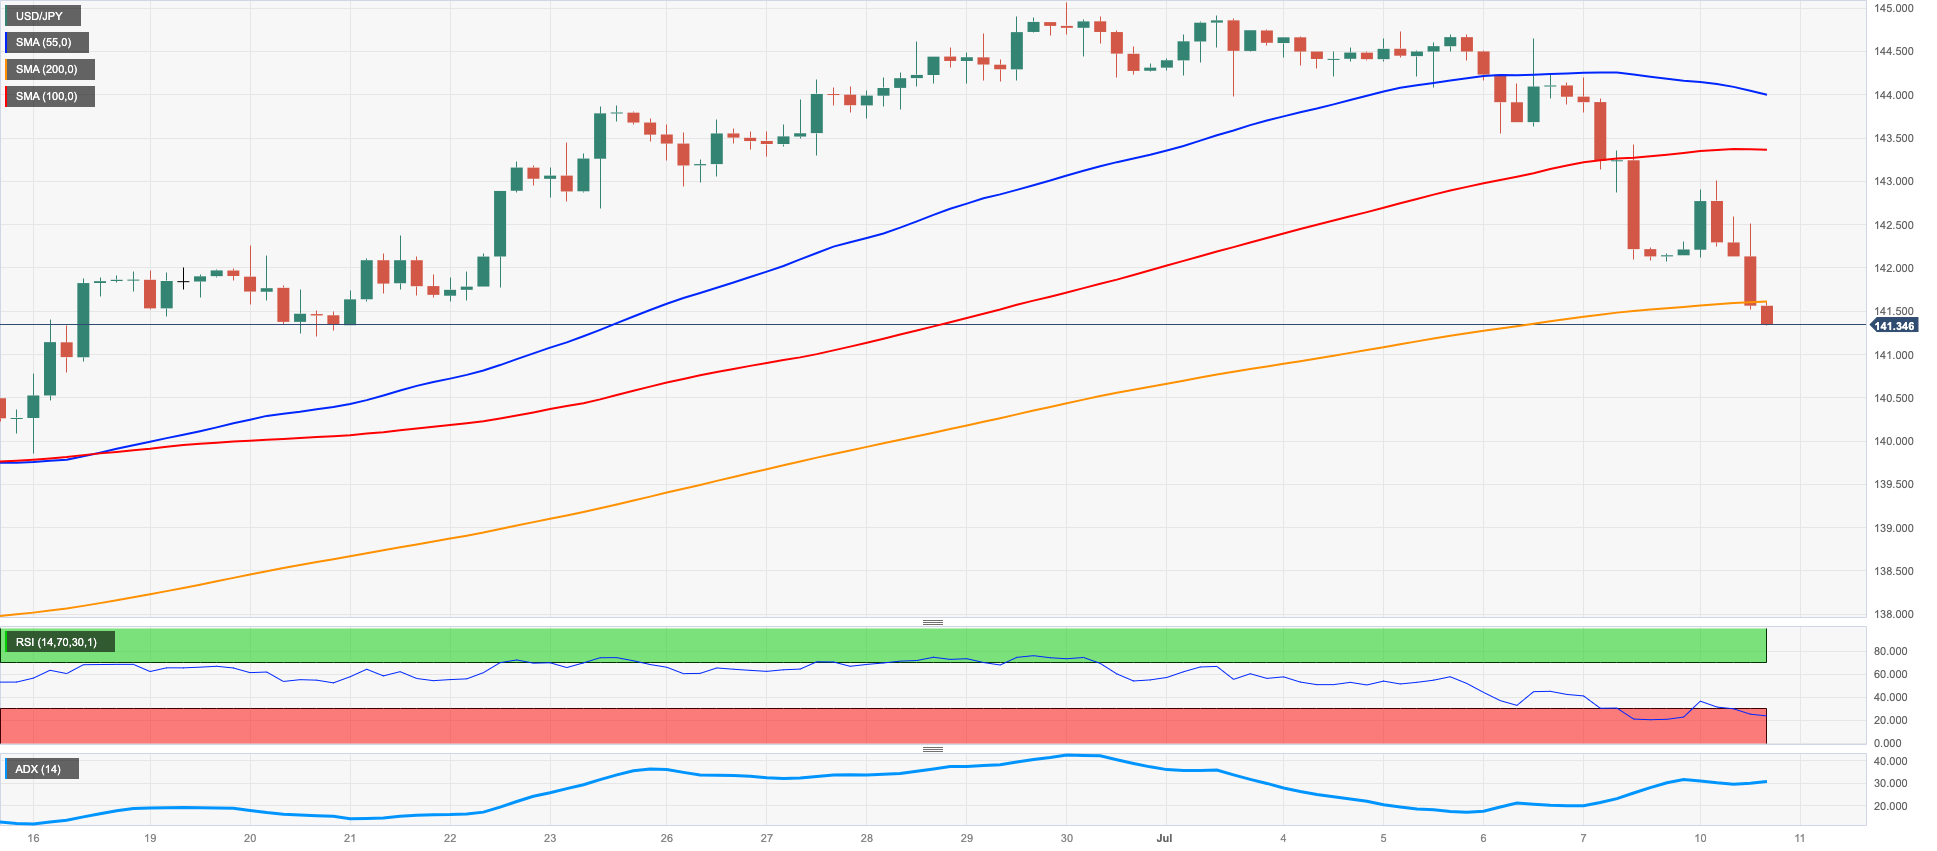
USD/JPY started the week on the back foot and revisited the area of 3-week lows in the low-141.00s on Monday.
The daily pullback in the greenback in combination with declining US yields across the curve weighed on the pair at the beginning of the week. In addition, somewhat hawkish comments from the BoJ Osaka and Nagoya Branch managers suggested that many firms see the need to raise wages, although it remains uncertain whether those higher wages will be sustained.
Those comments seem to have impacted the domestic money market, where the JGB 10-year yields climbed to levels last seen in late April, around 0.47%.
In Japan, Bank Lending expanded 3.2% in the year to June. Additionally, the Eco Watchers Survey Current eased to 53.6 in June, and the Eco Watchers Survey Outlook receded to 52.8 in the same month.
USD/JPY extends the drop and is expected to meet the next support at the provisional 55-day SMA at 139.39 ahead of the June low of 138.42 (June 1), with further contention at the crucial 200-day SMA of 137.19. If the pair falls further, the 100-day simple moving average (SMA) at 136.85, the weekly low at 133.01 (April 26), and minor support at 132.01 (April 13) may provide further support ahead of the April low of 130.62 (April 5) and key support at 130.00. On the upside, the USD/JPY should first challenge the 2023 high of 145.07 (June 30), then the October 2022 high of 151.94 (October 21), and the round level of 152.00. The day-to-day RSI grinded lower to the sub-46 region.
Resistance levels: 144.65 145.07 146.79 (4H chart)
Support levels: 141.33 141.21 139.85 (4H chart)
GBPUSD
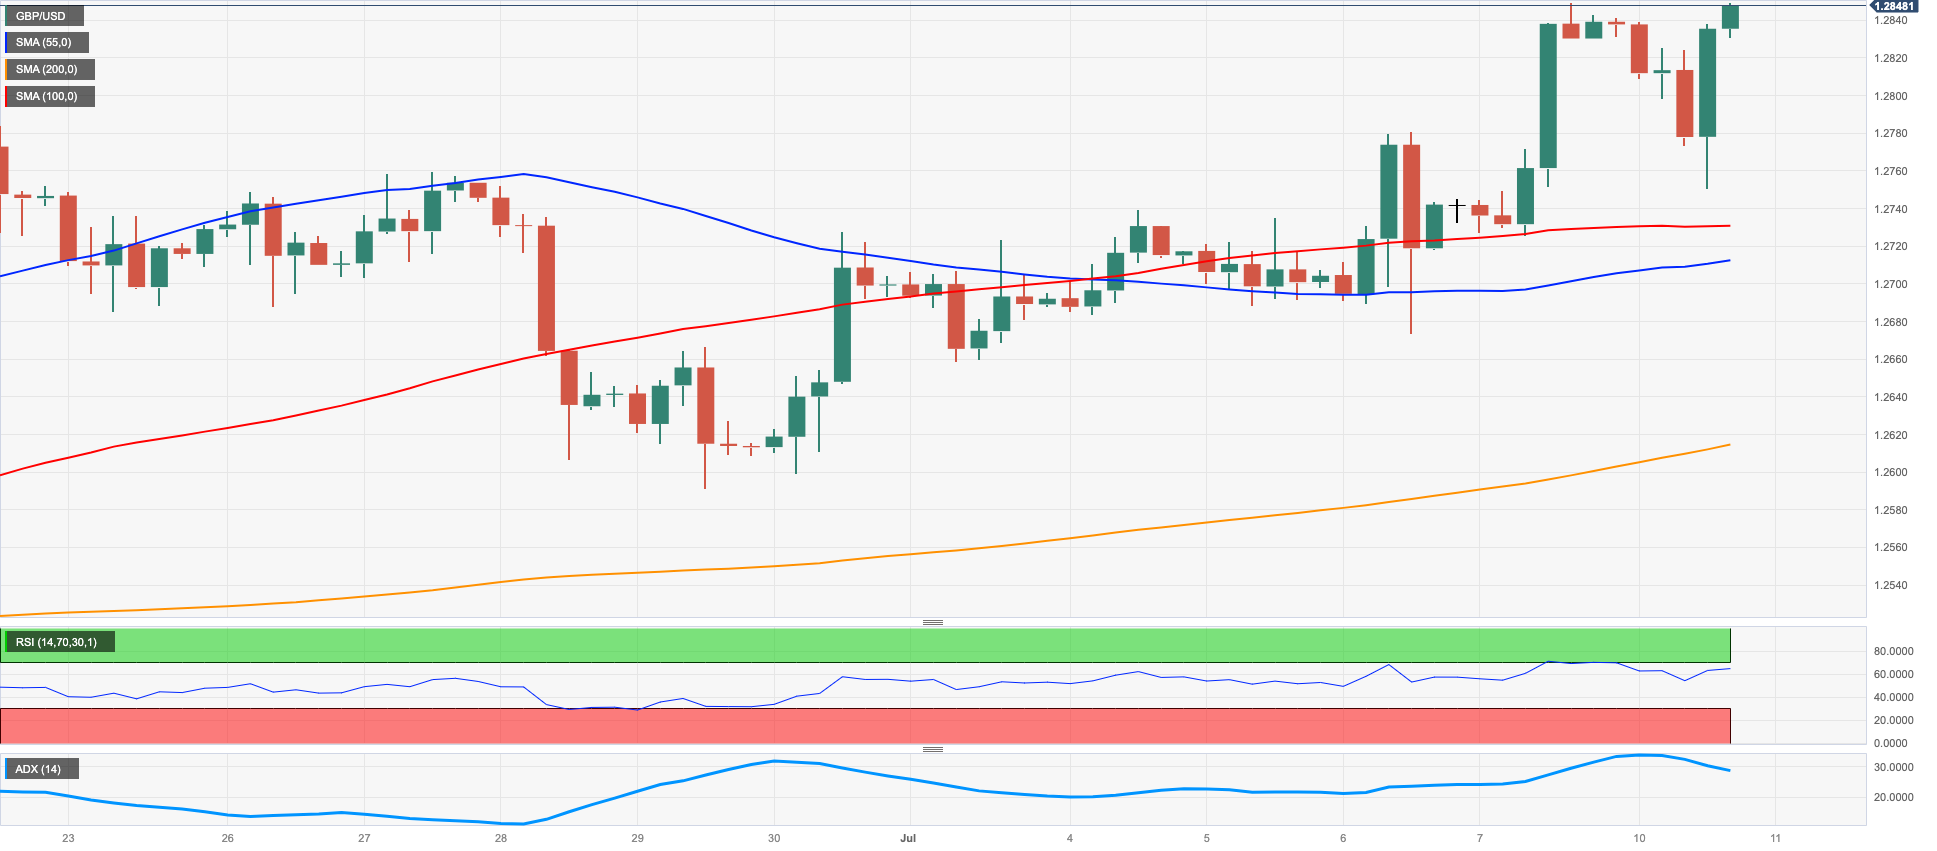
The British pound capitalized on the selling pressure surrounding the greenback and encouraged GBP/USD to flirt with the so-far 2023 peaks around 1.2850 at the beginning of the week.
Indeed, the dollar could not sustain the positive sentiment observed in the first half of Monday's session, and eventually succumbed to the rising selling pressure, driving the US Dollar Index (DXY) to challenge the key 102.00 region amid declining US yields across the curve.
From the BoE, Governor A. Bailey argued that the MPC is monitoring wage, inflation, and price data, and that some of the previous tightening measures have not yet impacted the UK. He also noted that inflation is at an unacceptable level, although headline inflation is expected to decrease significantly throughout the remainder of the year. Additionally, he mentioned that wages and prices are still increasing at a rapid pace.
There were no data releases scheduled across the Channel on Monday.
Next on the upside for GBP/USD comes the 2023 high of 1.2849 (July 7). The breakout of this level exposes the 200-week SMA of 1.2881 before reaching the critical 1.3000 level. In contrast, the weekly low of 1.2590 (June 29) provides immediate support ahead of the 1.2550 zone, which corresponds with the trend line from 2021 to 2023 and the transitory 55-day SMA. Following that is the June low of 1.2368 (June 5), the May low of 1.2308 (May 25), and the April low of 1.2274 (April 3). The latter's break reveals the 200-day SMA at 1.2163. The daily RSI surged above 66.
Resistance levels: 1.2849 1.3089 1.3146 (4H chart)
Support levels: 1.2673 1.2590 1.2486 (4H chart)
AUDUSD
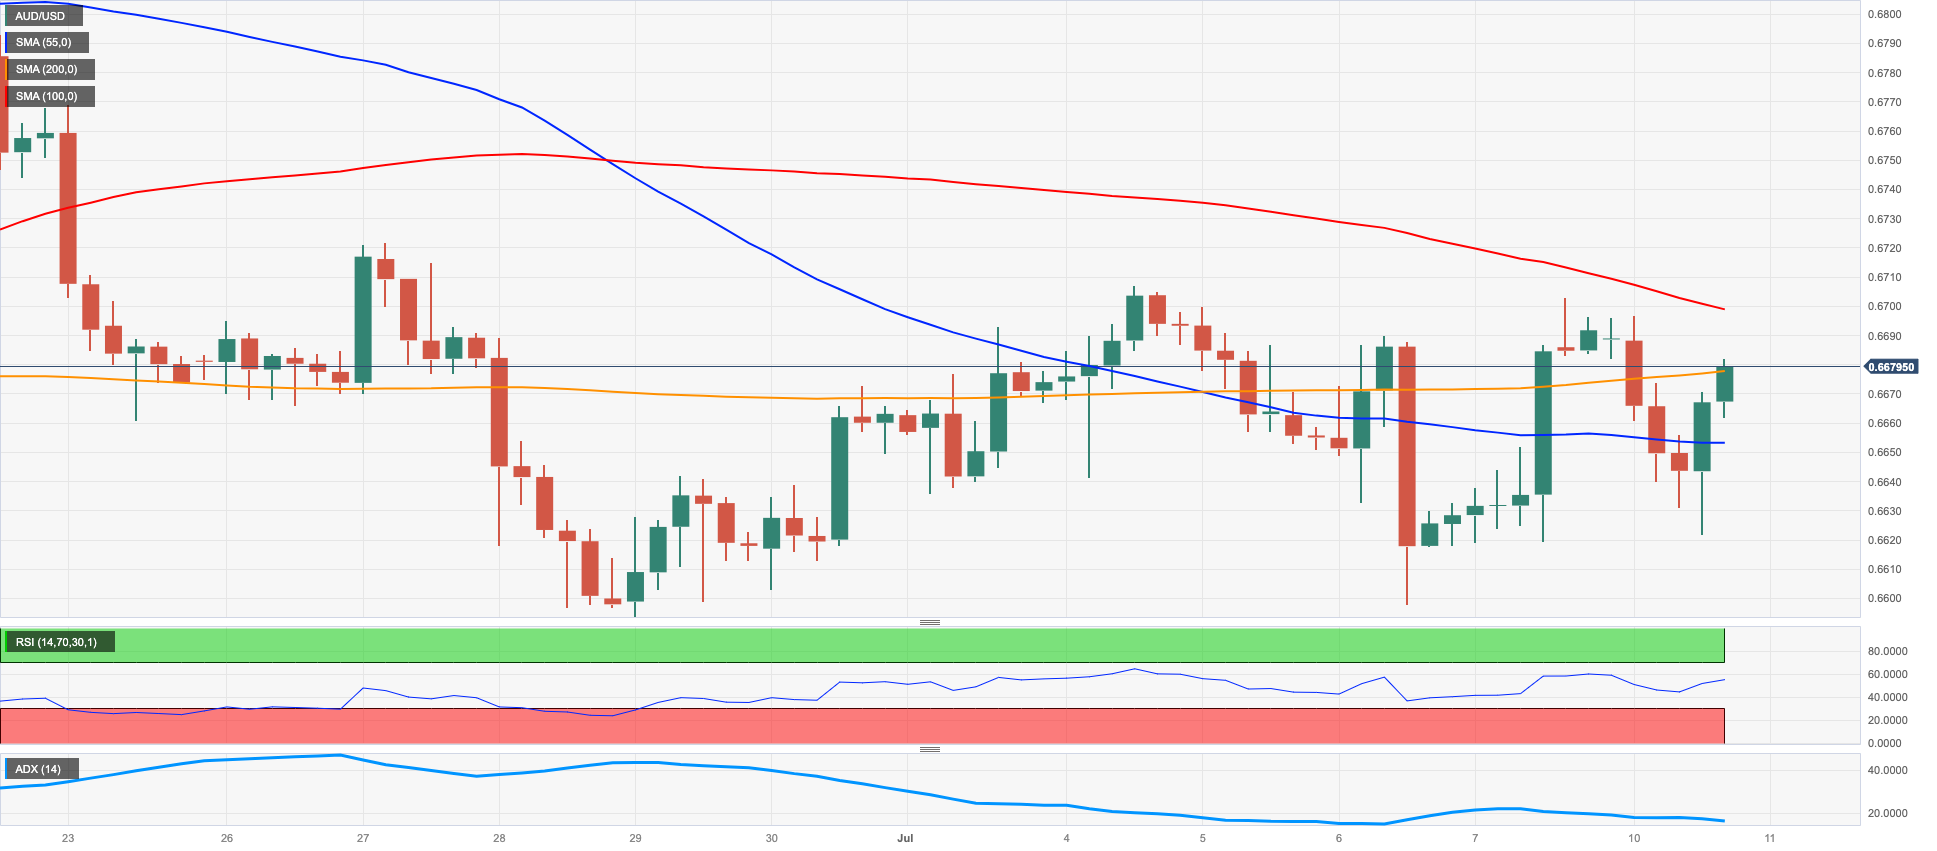
AUD/USD partially reversed Friday’s strong advance and failed once again to test or surpass the key 200-day SMA just below the 0.6900 hurdle at the beginning of the week.
The daily downtick in spot came despite the continuation of the downside pressure in the greenback, which dragged the USD Index (DXY) to the 102.00 neighbourhood, or 3-week lows.
The generalized downbeat mood in the commodity universe also contributed to the decline in the pair, with both copper prices and iron ore trading with humble losses to start the week.
The Australian calendar was empty on Monday.
Before hitting the June high of 0.6899 (June 16), the AUD/USD must first break above the weekly top of 0.6720 (June 27). Beyond that, the vital 0.7000 level, the weekly high of 0.7029 (February 14), and the 2023 high of 0.7157 (February 2) are all important milestones to watch. Instead, a break below the weekly low of 0.6595 (June 29) might result in a slide to the 2023 low of 0.6458 (May 31). South of here are the November 2022 low of 0.6272 (November 3) and the 2022 low of 0.6169 (October 13). The daily RSI slipped back to the area below the 50 threshold.
Resistance levels: 0.6700 0.6720 0.6806 (4H chart)
Support levels: 0.6599 0.6579 0.6458 (4H chart)
GOLD
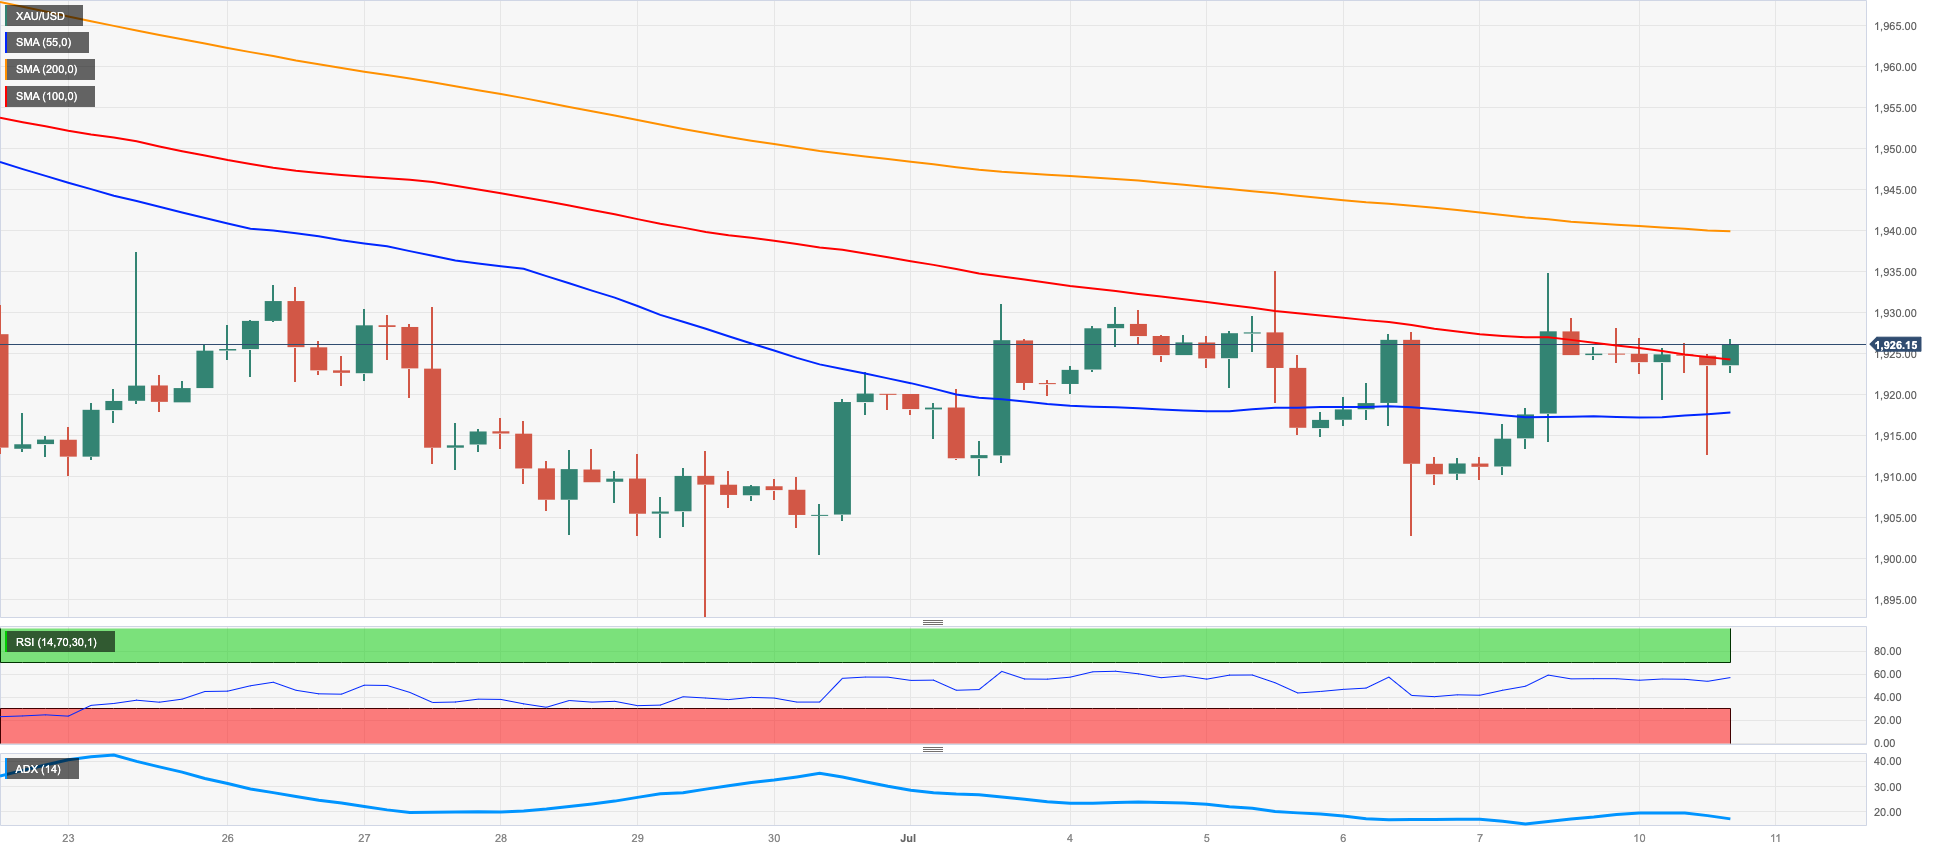
Gold prices started the week in a vacillating fashion around the $1920/25 region per troy ounce.
The selling pressure in the greenback seems to have failed to ignite some rebound in the precious metals, while the move lower in US yields did not help either.
It seems bullion could enter a cautious range ahead of the release of key US inflation figures on July 12, where consumer prices are forecast to have extended the downward trend also in June.
Gold prices appear to have entered a period of consolidation. This theme's breakdown reveals an initial support at the June low of $1893 (29 June), before to the crucial 200-day SMA at $1866 and the 2023 low of $1804 (28 February), both of which are ahead of the critical $1800 barrier. The initial up-barrier comes at the transitory 100-day and 55-day SMAs of $1948 and $1963, respectively, before reaching the June high of $1983 (June 2), which precedes the key $2000 threshold. There is no significant resistance to the north until the 2023 peak of $2067 (4 May), which follows the 2022 top of $2070 (8 March) and, eventually, the all-time high of $2075 (7 August 2020).
Resistance levels: $1935 $1940 $1983 (4H chart)
Support levels: $1902 $1893 $1885 (4H chart)
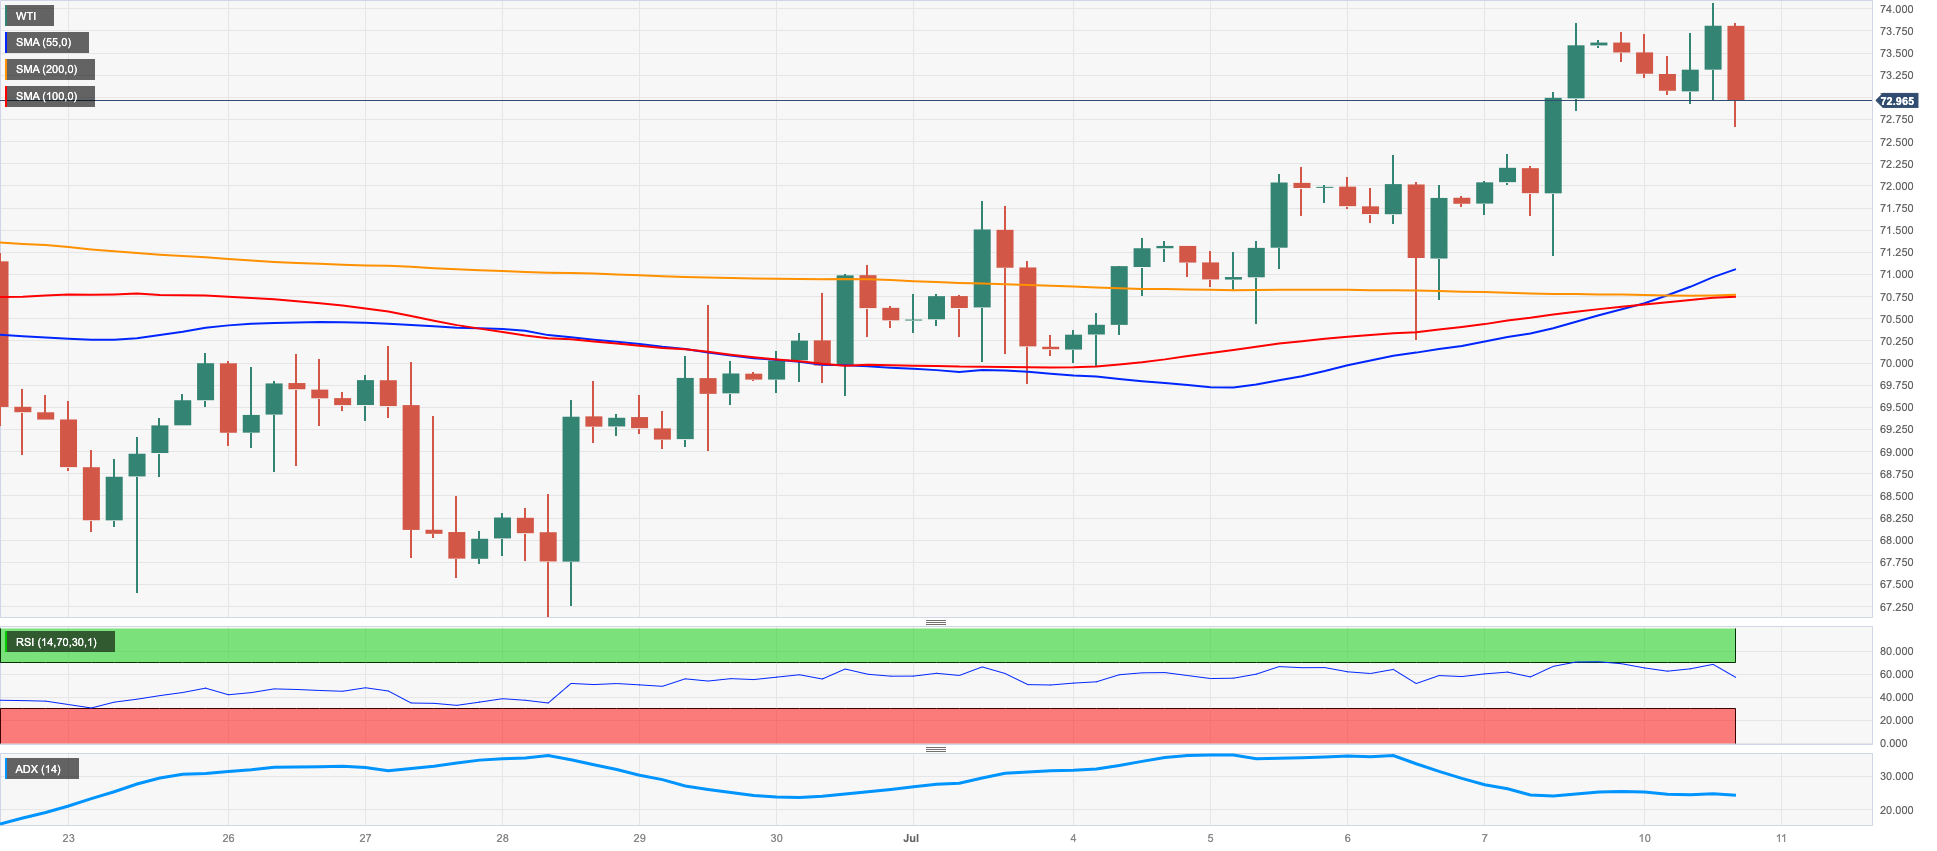
CRUDE WTI
The decrease in WTI prices happened because of ongoing worries about demand, which seemed to worsen due to increasing speculation about the Fed and other major central banks moving further into the restrictive territory when it comes to monetary policy.
Nevertheless, the latest reports mentioning Saudi Arabia's voluntary reduction in oil production and Russia's intention to trim oil exports seem to have minimized the decline in prices on Monday.
Moving forward, traders are expected to closely follow the release of US inflation figures on July 12 as well as the publication of usual weekly reports on US crude oil inventories by the API and the EIA on Tuesday and Wednesday, respectively.
WTI faces immediate resistance at the June high of $74.92 (June 5), which is followed by the 200-day SMA of $77.29 and the weekly high of $79.14 (April 24). The latter might breach the key barrier of $80.00 per barrel, which is supported by the 2023 top of $83.49 (April 120) and the November 2022 high of $93.73 (November 7). On the flip side, the initial conflict appears at the June low of $66.86 (June 13), prior to the 2023 low of $63.61 (May 4), the December 2021 low of $62.46 (December 2), and the critical level of $60.00 a barrel.
Resistance levels: $74.11 $74.92 $76.89 (4H chart)
Support levels: $70.73 $69.66 $67.01 (4H chart)
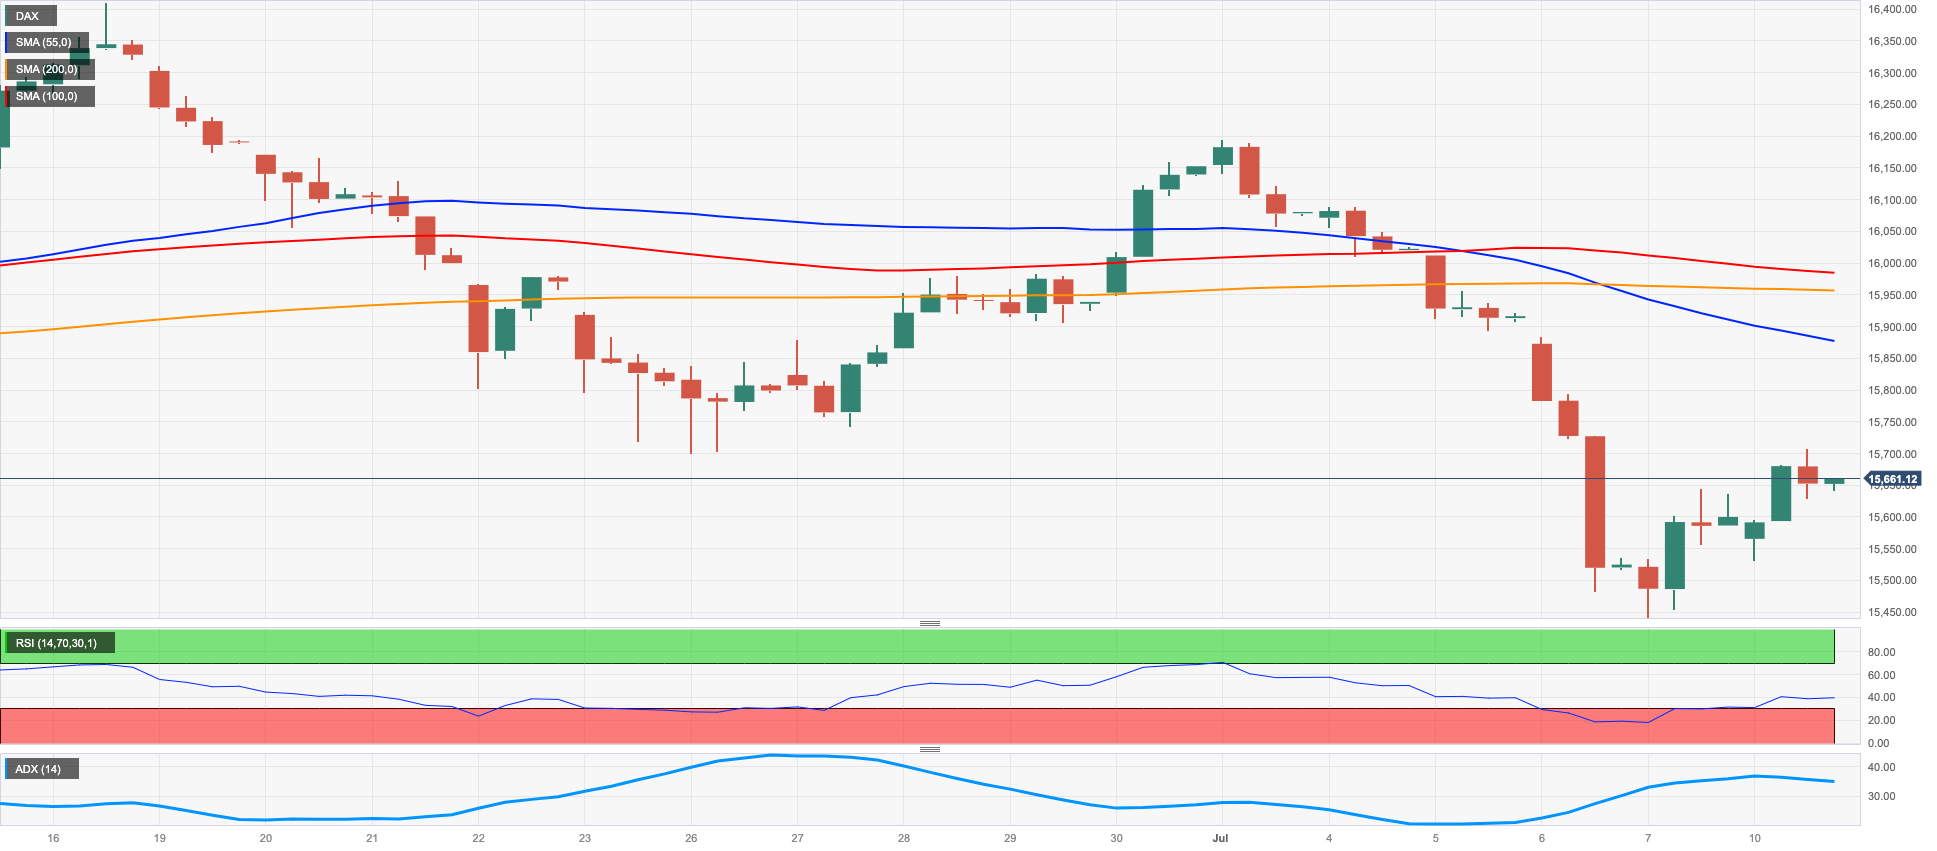
GER40
European stocks closed Monday's session with solid gains across the board, with the German benchmark DAX40 closing with gains for the second session in a row after hitting fresh 4-month lows on Friday.
The index managed to shed initial pessimism after disappointing inflation figures in China rekindled concerns over the recovery in the country, while caution is expected to increase ahead of the release of key US inflation figures on July 12 and the imminent start of the earnings season.
In addition, extra caution is expected to continue to linger over markets in light of the continuation of the tightening campaign by the ECB and the Fed as soon as later in the month.
In the German money market, the 10-year bund yields fell after five consecutive advances, returning to the vicinity of the 2.60% area.
On July 7, the DAX40 set a new July low of 15456. If this level is breached, the 200-day SMA at 14891 will be put to the test, ahead of the March low of 14458 (March 20) and the December 2022 low of 13791 (December 20). On the upside, the interim 55-day SMA at 15955 stands in the way of the weekly high of 16209 (July 3) and the all-time high of 16427 (June 16). The daily RSI improved to the boundaries of 41.
Best Performers: Rheinmetall AG, MTU Aero, Commerzbank
Worst Performers: Continental AG, RWE AG ST, E.ON SE
Resistance levels: 15917 16209 16427 (4H chart)
Support levels: 15456 14809 14458 (4H chart)
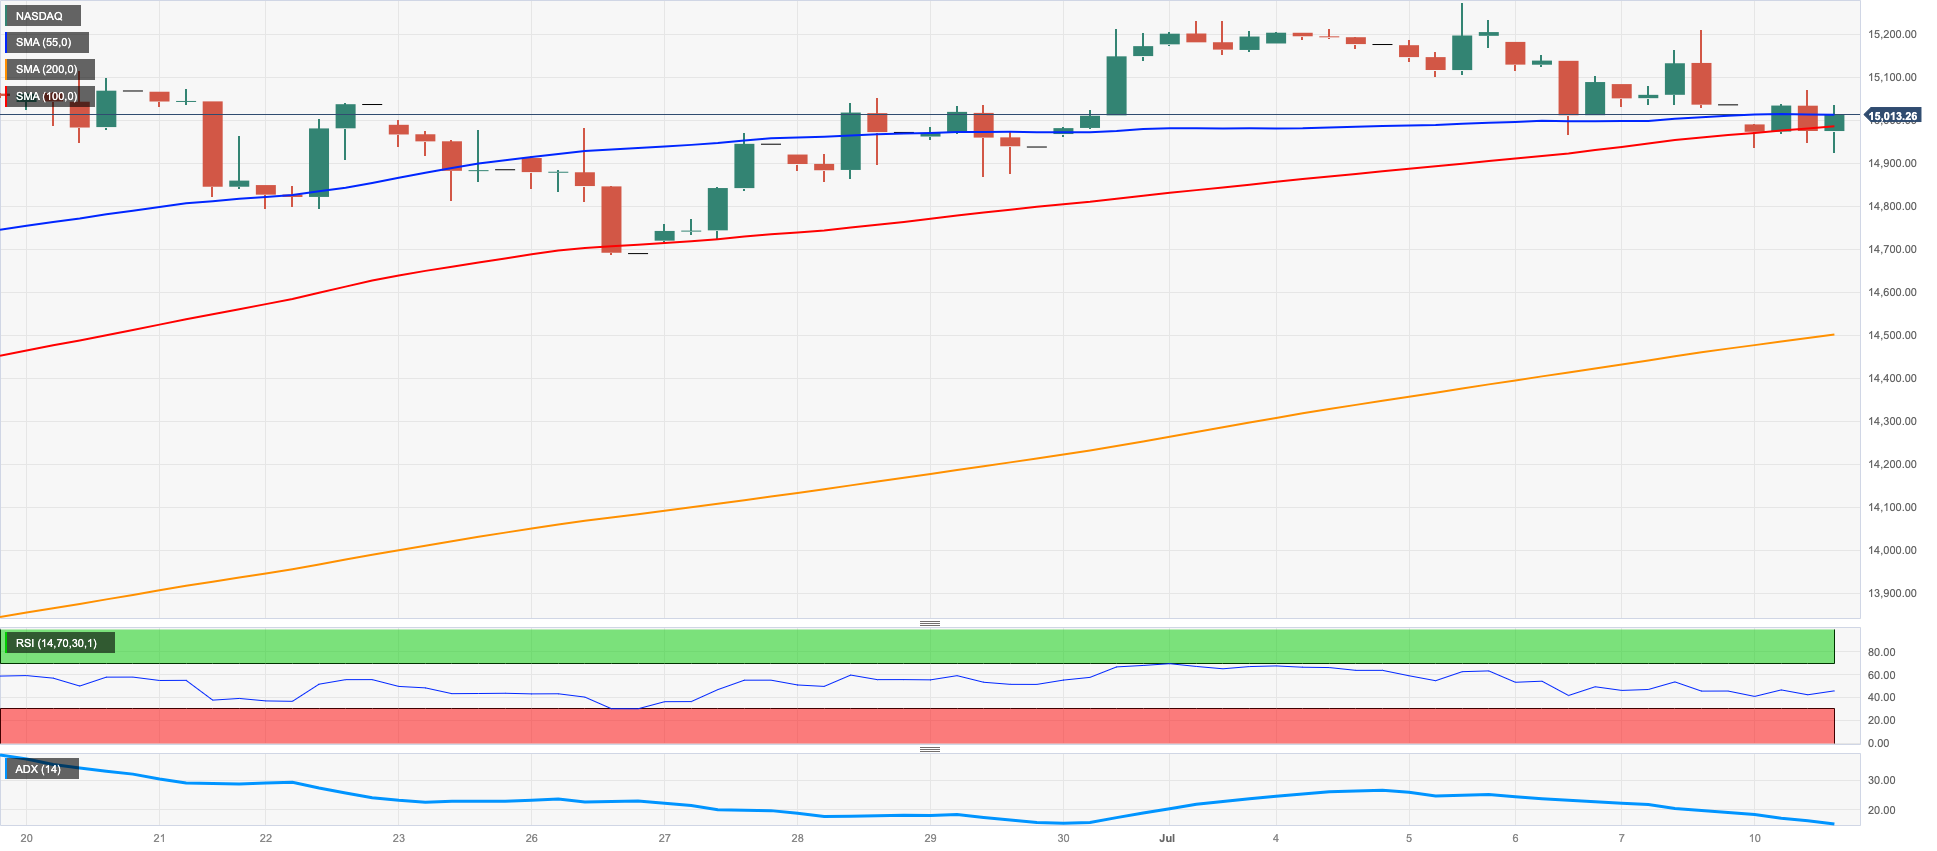
NASDAQ
On Monday, the Nasdaq 100, which monitors technology stocks, experienced its fourth consecutive decline, dipping below the 15,000 mark before rebounding.
This drop occurred despite a weaker dollar and decreasing US yields throughout the market and appears to be linked to worries about potential tightening by the Federal Reserve, as well as some level of caution ahead of the upcoming earnings season and the release of US inflation data tracked by the CPI later in the week.
If the Nasdaq 100 falls further in the short term, it will find immediate support from weekly lows of 14687 (June 26) and 14283 (June 7), as well as the intermediary 55-day SMA at 14102 and another weekly low of 13520 (May 24). A further loss may push the price below the May low of 12938 (May 4), the April low of 12724 (April 25), the 200-day SMA of 12442, and the March low of 11695 (March 13). The first up-barrier, on the other hand, coincides with the 2023 high of 15284 (June 16), ahead of the round milestone of 16000. The daily RSI retreated further and challenged the 59 zone.
Top Gainers: Zscaler, Lucid Group, Fortinet
Top Losers: MercadoLibre, Alphabet C, Alphabet A
Resistance levels: 15275 15284 16017 (4H chart)
Support levels: 14924 14687 14283 (4H chart)
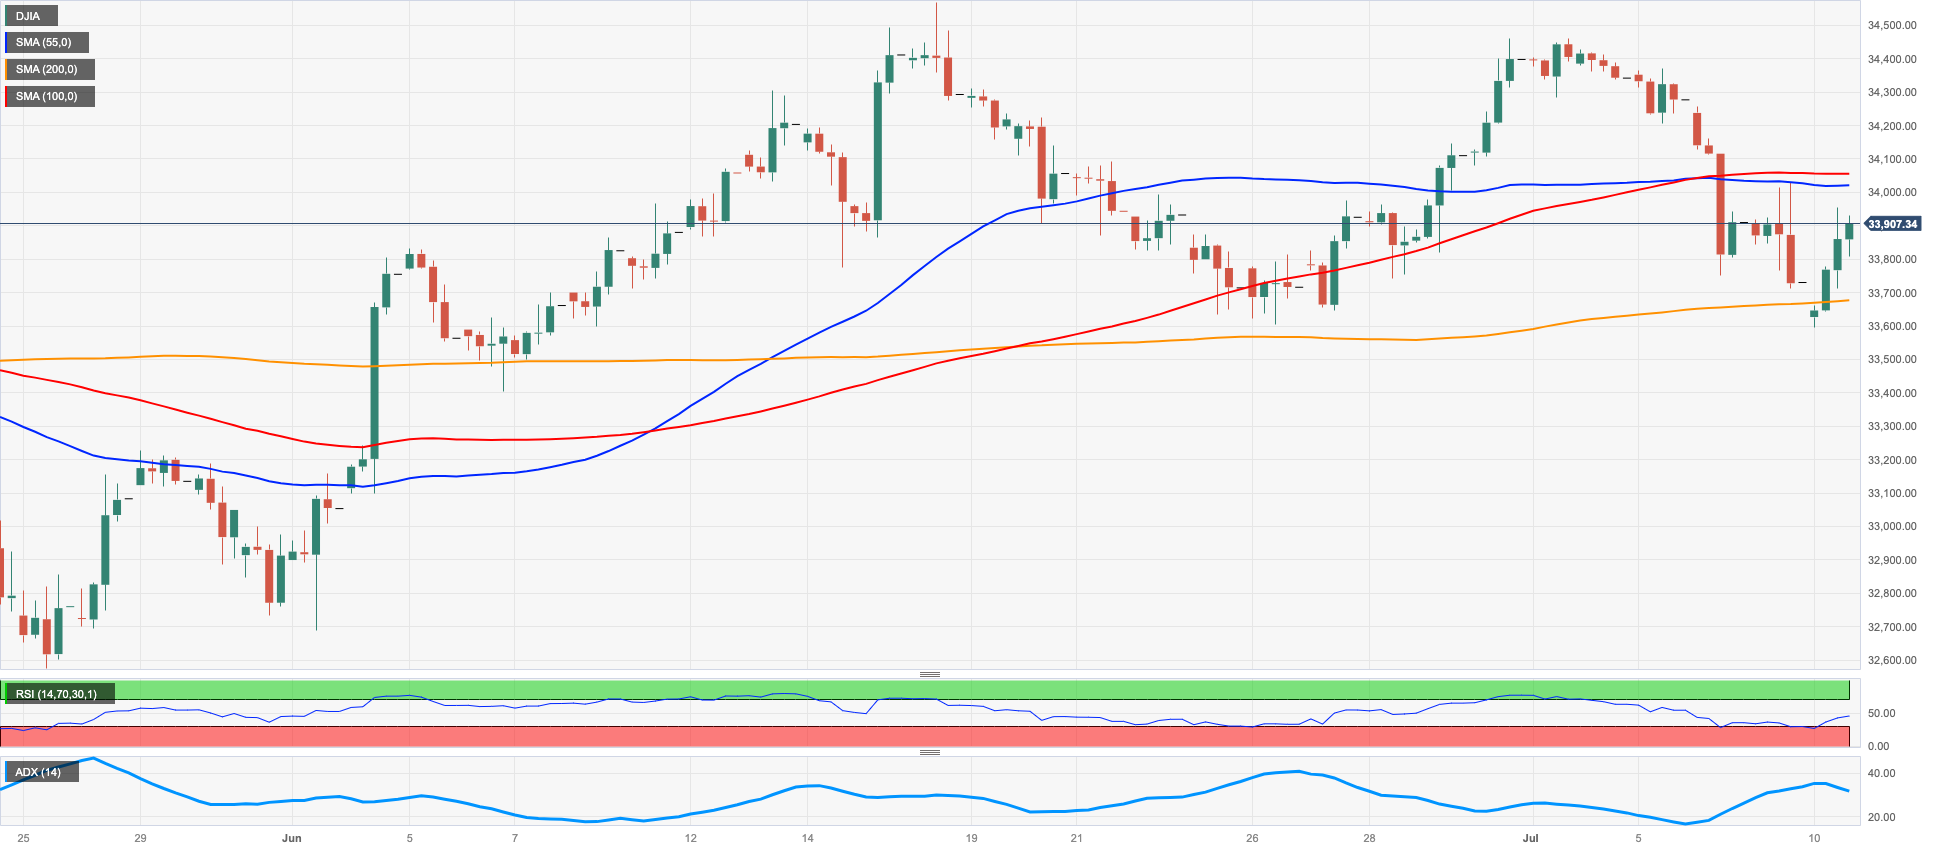
DOW JONES
On Monday, the Dow Jones index, which monitors US stocks, recorded moderated increases as investors analyzed the Nonfarm Payrolls report for June, which showed a gain of 209K jobs.
It appears that traders approached the start of the new trading week with some level of caution, given the upcoming release of US CPI and Producer Prices later in the week, as well as the launch of the earnings season.
Overall, the Dow Jones rose 0.51% to 33905, the S&P500 gained 0.13% to 4404, and the tech-benchmark Nasdaq Composite climbed 0.03% to 13664.
A meaningful bounce in the Dow Jones should revisit the June peak of 34467 (June 30), before the 2023 high of 34588 (June 16) and the December 2022 top of 34712 (December 13). North of here is the April 2022 high of 35492 (April 21). Having said that, initial support is expected at the weekly low of 33610 (June 26). The transitory 100-day SMA at 33367 is in line with the critical 200-day SMA at 32992. Lower support levels from here are the May low of 32586 (May 25), seconded by the March low of 31429 (March 15), and the October 2022 low at 28660 (October 13). The day-to-day RSI rebounded past 50.
Top Performers: Intel, Walgreen Boots, Amgen
Worst Performers: Microsoft, Verizon, Apple
Resistance levels: 34467 34588 34712 (4H chart)
Support levels: 33610 33364 32586 (4H chart)
MACROECONOMIC EVENTS

All Information & Updates provided by:

All information relating to the financial markets available on this page has been prepared and issued by FXStreet (Forexstreet SL, Spain, Reg: B62498233) on the basis of publicly available information and all information believed to be reliable and does not conflict with Kuwaiti local laws, and all necessary care has been taken to before the company to ensure that the facts mentioned are correct from the source.
NCM Investment nor any of its directors or employees shall in any way be held responsible for the contents of this news, and the information contained on this page is intended only to provide clients with publicly available information and should not be construed as investment advice, report or analysis and/or constitute an offer or invitation to buy or sell financial instruments of any kind.
RISK WARNING: Forex and CFDs are highly risky leveraged products, as losses can exceed deposits. Please ensure you understand all the risks and take independent advice if necessary. NCM will segregate the clients based on the criteria of the regulator and its bylaws. NCM does not provide any advisory service; the material published does not constitute advice or a recommendation for a transaction in any financial instrument. NCM accepts no responsibility for any use of the content presented and any consequences of that use. Anyone acting on the information provided does so at their own risk.