
- Contact Us:
-

-

-

-


Daily Market Updates
12 Jul 2023
USDJPY
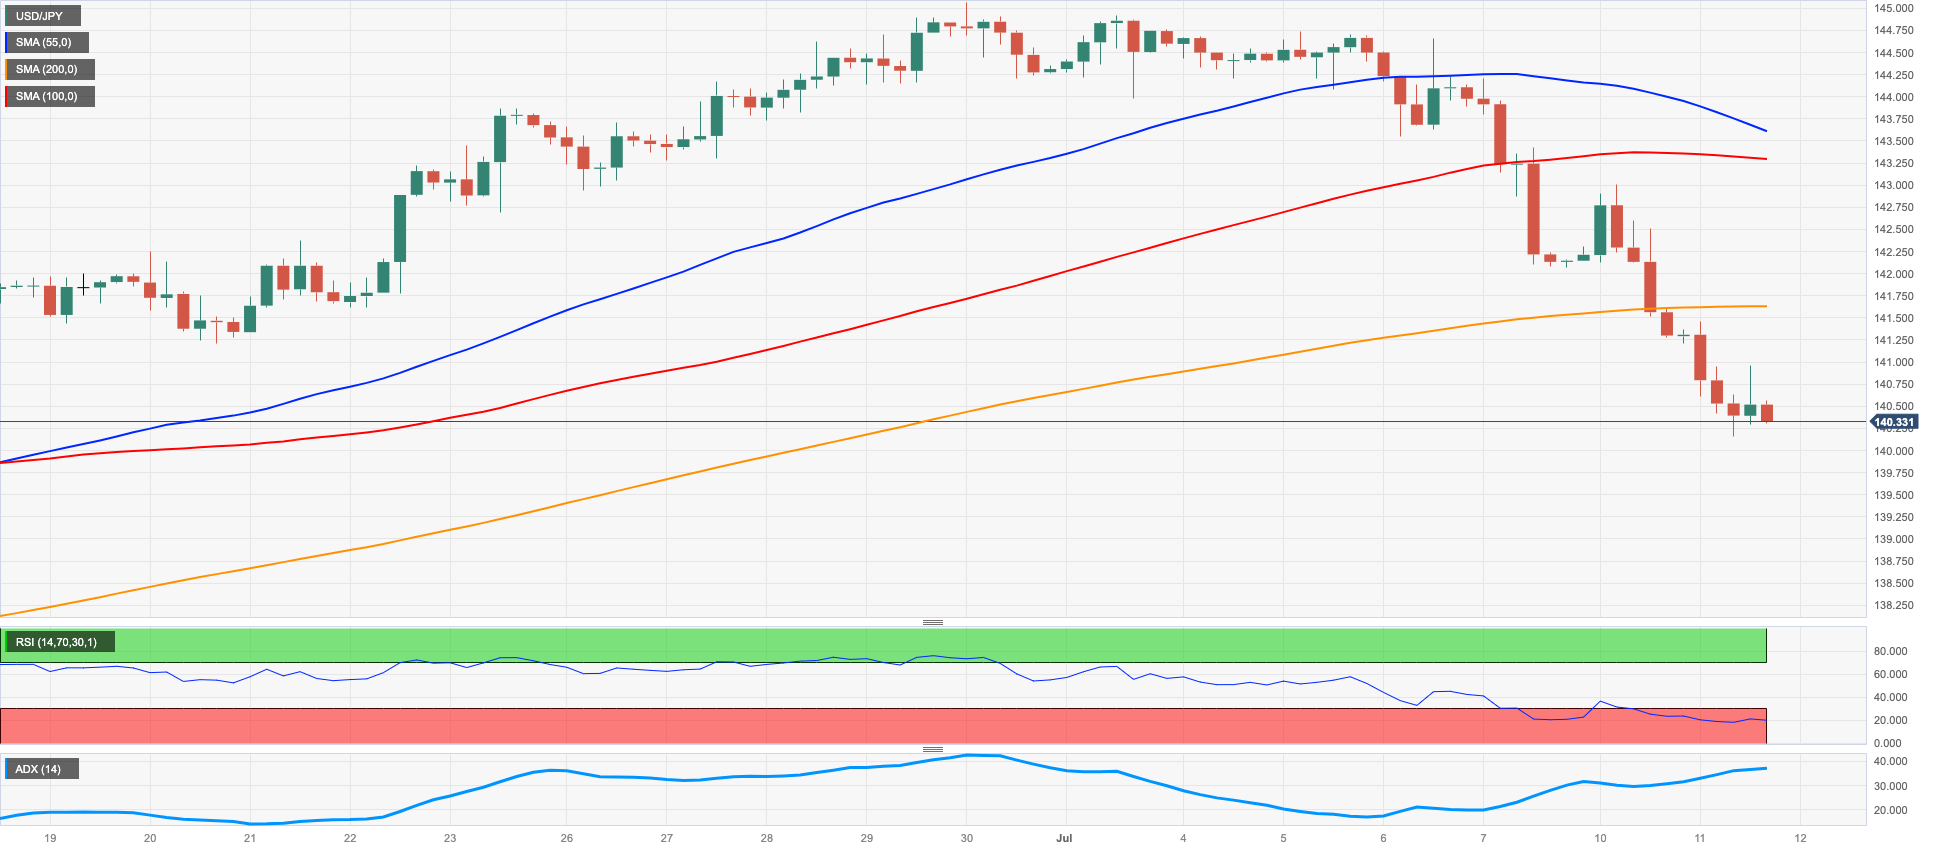
The dollar's ongoing weakness alongside mixed yields across the U.S. yield curve pressured USD/JPY lower, sending it to retest the 140.00 neighbourhood or 4-week lows on Tuesday.
The pair has now spent four straight sessions in retreat mode, extending its pullback from YTD highs close to 145.00 marked in late June.
Meanwhile, JGB yields on the 10-year reversed three consecutive daily gains and dipped back to the 0.45% zone amid easing worries over potential currency intervention by Japanese authorities.
In the Japanese docket, Machine Tool Orders contracted at an annualized 21.7% in June.
USD/JPY continues to fall and is projected to find support around the preliminary 55-day SMA of 139.51, just ahead of the June low of 138.42 (June 1), with additional contention at the critical 200-day SMA of 137.17. If the pair continues to decline, the interim 100-day SMA at 136.90, the weekly low at 133.01 (April 26), and minor support at 132.01 (April 13) may provide additional support ahead of the April low of 130.62 (April 5) and major support at 130.00. On the upside, the USD/JPY should first test the June 30 high of 145.07, then the 2022 high of 151.94 (October 21), and the round level of 152.00. The day-to-day RSI dropped to the vicinity of 41.
Resistance levels: 141.56 143.00 144.65 146.79 (4H chart)
Support levels: 140.15 139.85 139.28 (4H chart)
GBPUSD
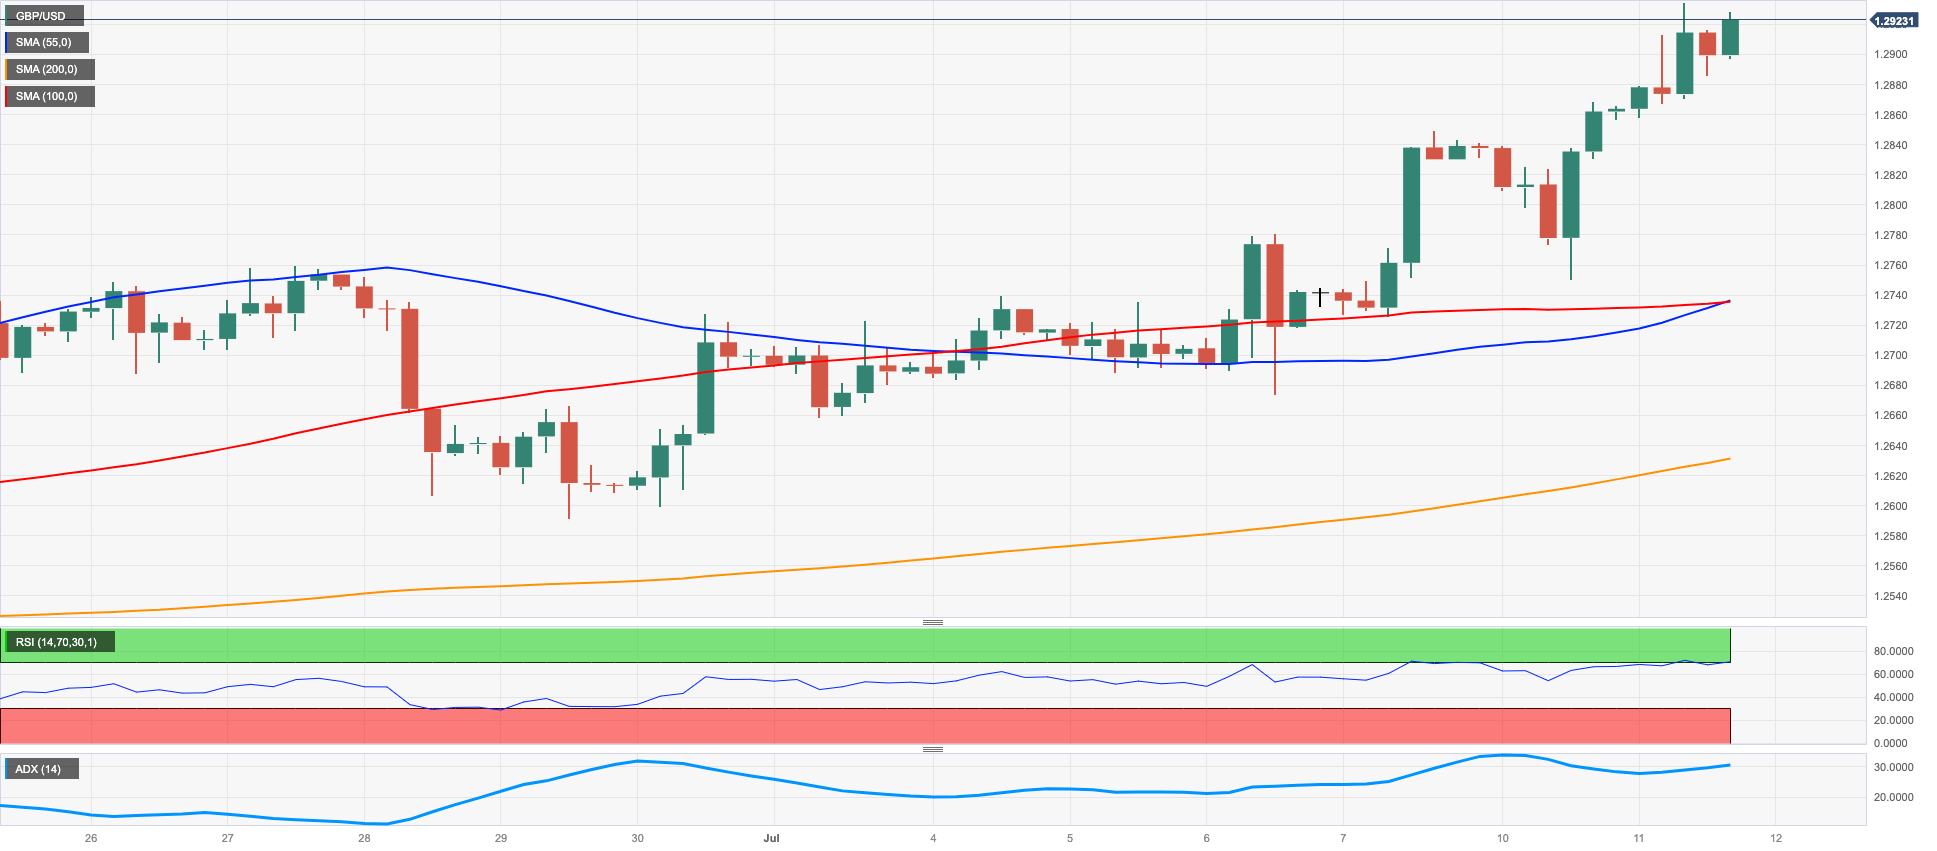
The greenback was under pressure again on Tuesday, with the British pound gaining for the fourth consecutive day and breaking above the key 1.2900 level for the first time since April 2022.
The risk-on mood was the main driver behind the greenback’s weakness, with the US Dollar Index (DXY) falling below the key 102.00 level and hitting a new multi-week low near 101.70.
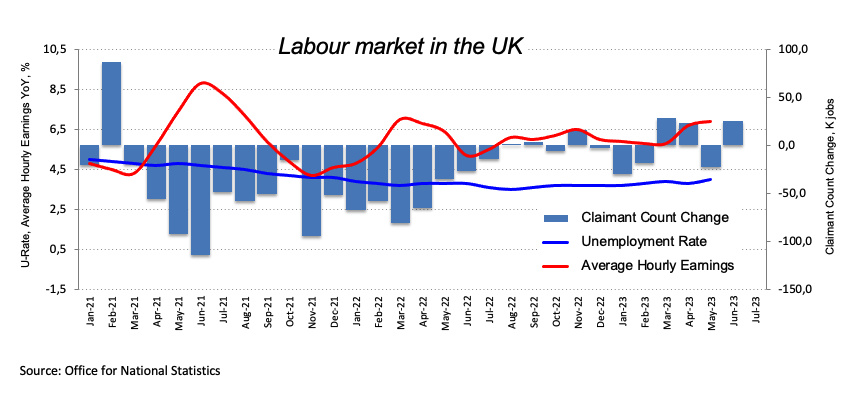
The pound also received a boost from the mixed labor market report, which stoked speculation that the BoE could raise rates by 50 basis points at its meeting on August 3.
On this, the Unemployment Rate unexpectedly rose to 4.0% in May and Average Hourly Earnings inc. Bonus rose 6.9% YoY in May. In addition, the Employment Change rose by 102K people during April and the Claimant Count Change increased by 25.7K persons in June.
The surpass of the 2023 high of 1.2934 (July 11) could motivate GBP/USD to challenge the key 1.3000 yardstick ahead of the weekly peak at 1.3146 (April 14 2022). On the flip side, the weekly low of 1.2590 (June 29) provides immediate support ahead of the 1.2540 zone, which corresponds to the trend line from 2021 to 2023. The June low of 1.2368 (June 5), the May low of 1.2308 (May 25), and the April low of 1.2274 (April 3) follow. The latter's breach displays the 200-day SMA at 1.2170. The daily RSI flirted with the overbought territory near 70.
Resistance levels: 1.2934 1.3089 1.3146 (4H chart)
Support levels: 1.2750 1.2673 1.2590 (4H chart)
AUDUSD
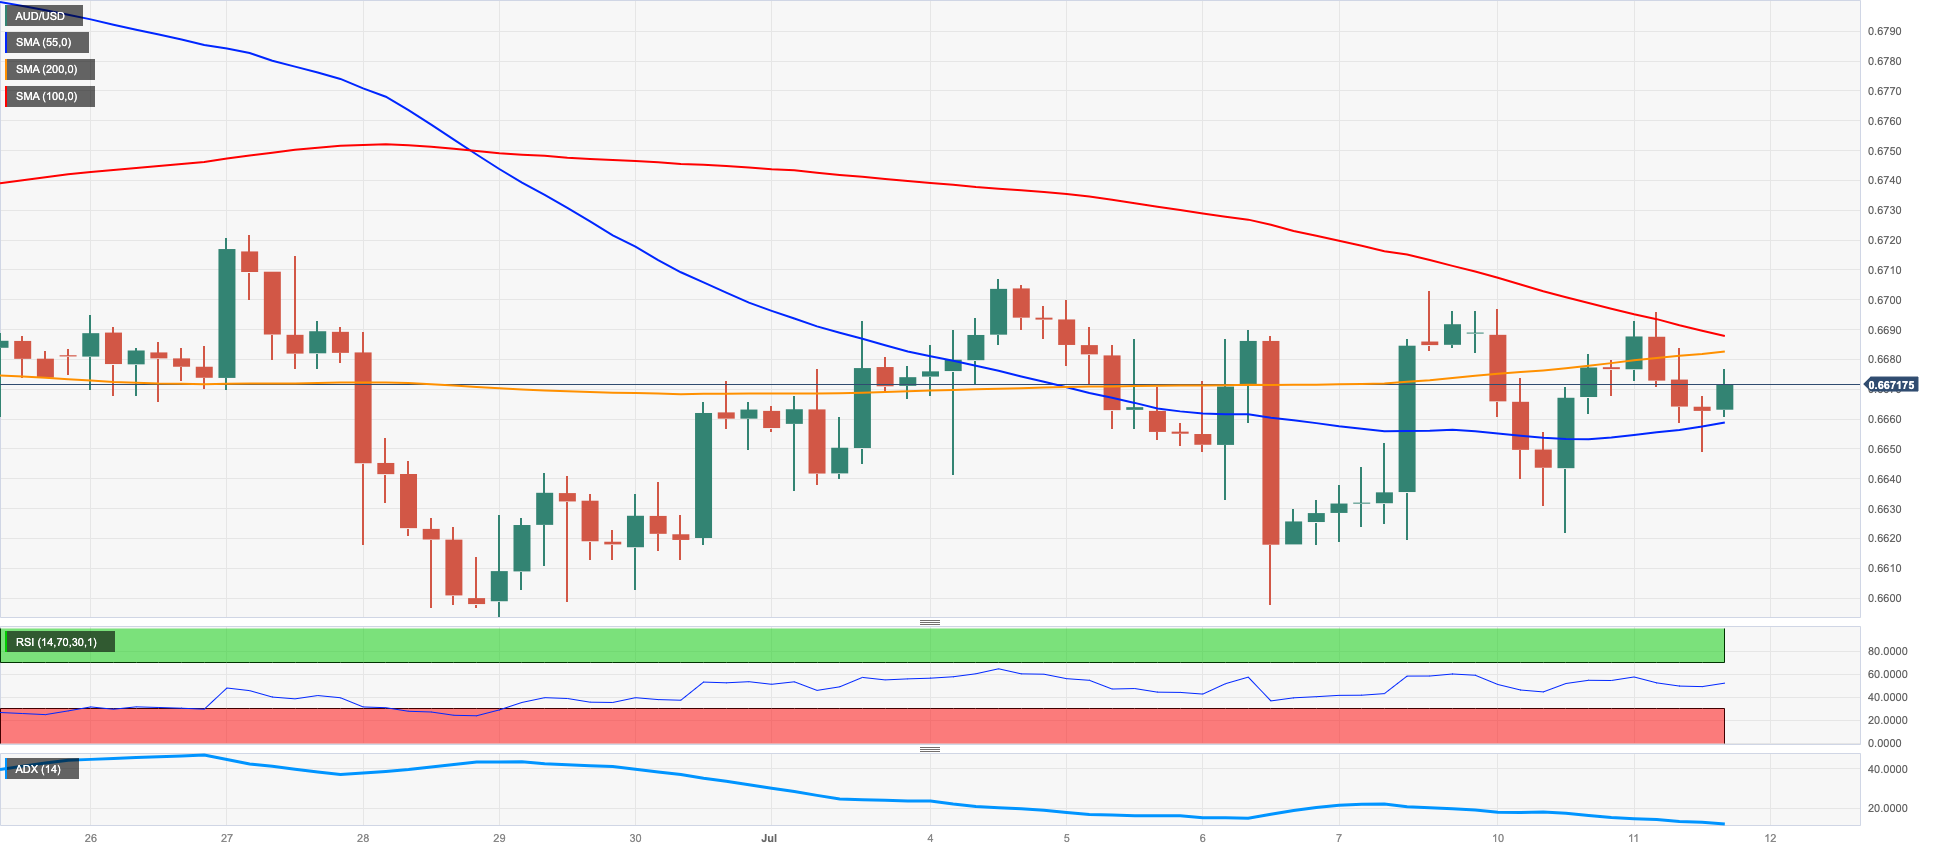
AUD/USD extended the pessimism seen at the beginning of the week and ended Tuesday’s session with modest losses in the sub-0.6700 region.
In the meantime, the 200-day SMA near 0.6700 seems to have become quite a tough barrier for AUD bulls for the time being.
The daily downtick in the pair came despite the negative performance of the greenback, although the generalized bearish mood in the commodity space seems to have weighed on the Aussie dollar on Tuesday.
In Oz, the Westpac Consumer Confidence Index improved to 81.3 in July (from 79.2), while Business Confidence tracked by NAB came in at 0 for the month of June (from -3).
The AUD/USD must first break above the key 200-day SMA at 0.6697 to allow for a rapid challenge of the weekly high of 0.6720 (June 27) prior to the June top of 0.6899 (June 16). Beyond that, the crucial 0.7000 level, the weekly high of 0.7029 (February 14), and the 2023 high of 0.7157 (February 2) are all key levels to monitor. Instead, a break below the weekly low of 0.6595 (June 29) might trigger a drop to the 2023 low of 0.6458 (May 31). The November 2022 low of 0.6272 (November 3) and the 2022 low of 0.6169 (October 13) are both south of here. The daily RSI deflated below the 48 mark.
Resistance levels: 0.6705 0.6720 0.6806 (4H chart)
Support levels: 0.6599 0.6579 0.6458 (4H chart)
GOLD
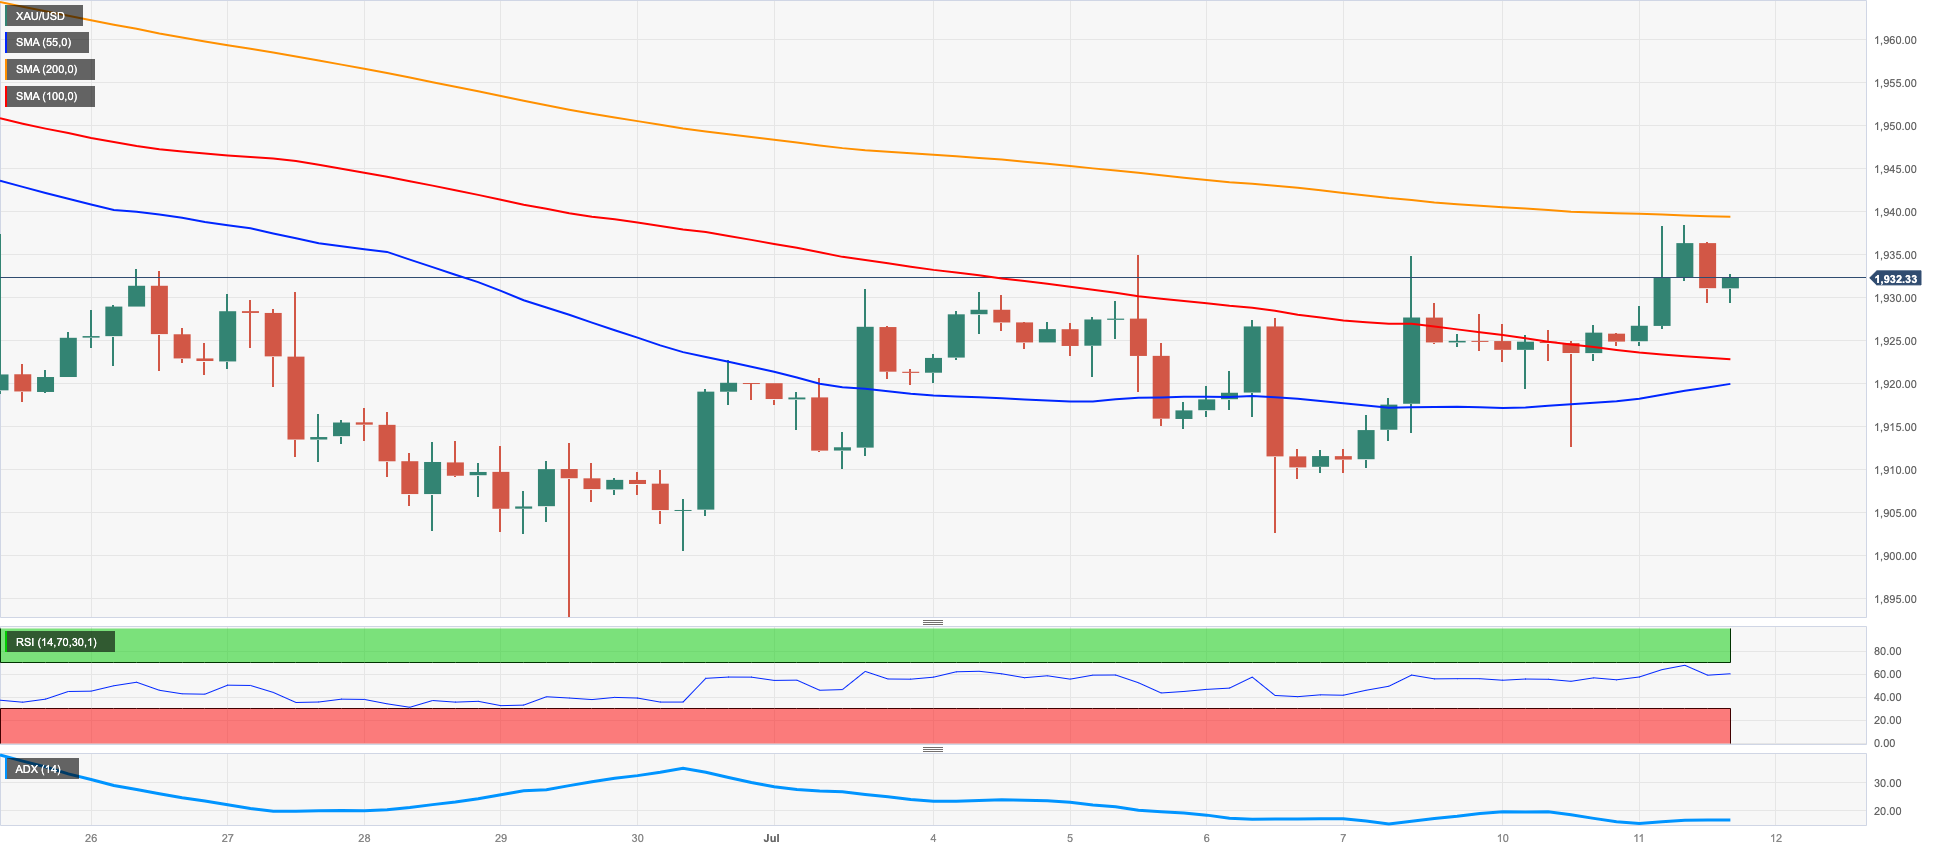
Prices of the troy ounce of gold briefly climbed to fresh multi-day highs near $1940, although they later receded and fell into the prevailing multi-session consolidative phase.
The improvement in the yellow metal came in response to further weakness in the greenback, while the generalized lack of direction in US yields across the curve seems to have also favoured bullion.
Moving forward, the precious metal is expected to remain under scrutiny ahead of the release of key US inflation figures tracked by the CPI on Wednesday.
Gold prices look to be settling into a phase of stabilization. The breakdown of this theme provides initial support at the June low of $1893 (29 June), before moving to the important 200-day SMA at $1867 and the 2023 low of $1804 (28 February), both of which are ahead of the vital $1800 barrier. The first up-barrier is at the provisional 100-day and 55-day SMAs of $1949 and $1962, respectively, before hitting the June high of $1983 (June 2), which precedes the critical $2000 mark. There is no strong northward resistance until the 2023 peak of $2067 (4 May), which follows the 2022 top of $2070 (8 March) and finally the all-time high of $2075 (7 August 2020).
Resistance levels: $1939 $1967 $1983 (4H chart)
Support levels: $1902 $1893 $1885 (4H chart)
CRUDE WTI
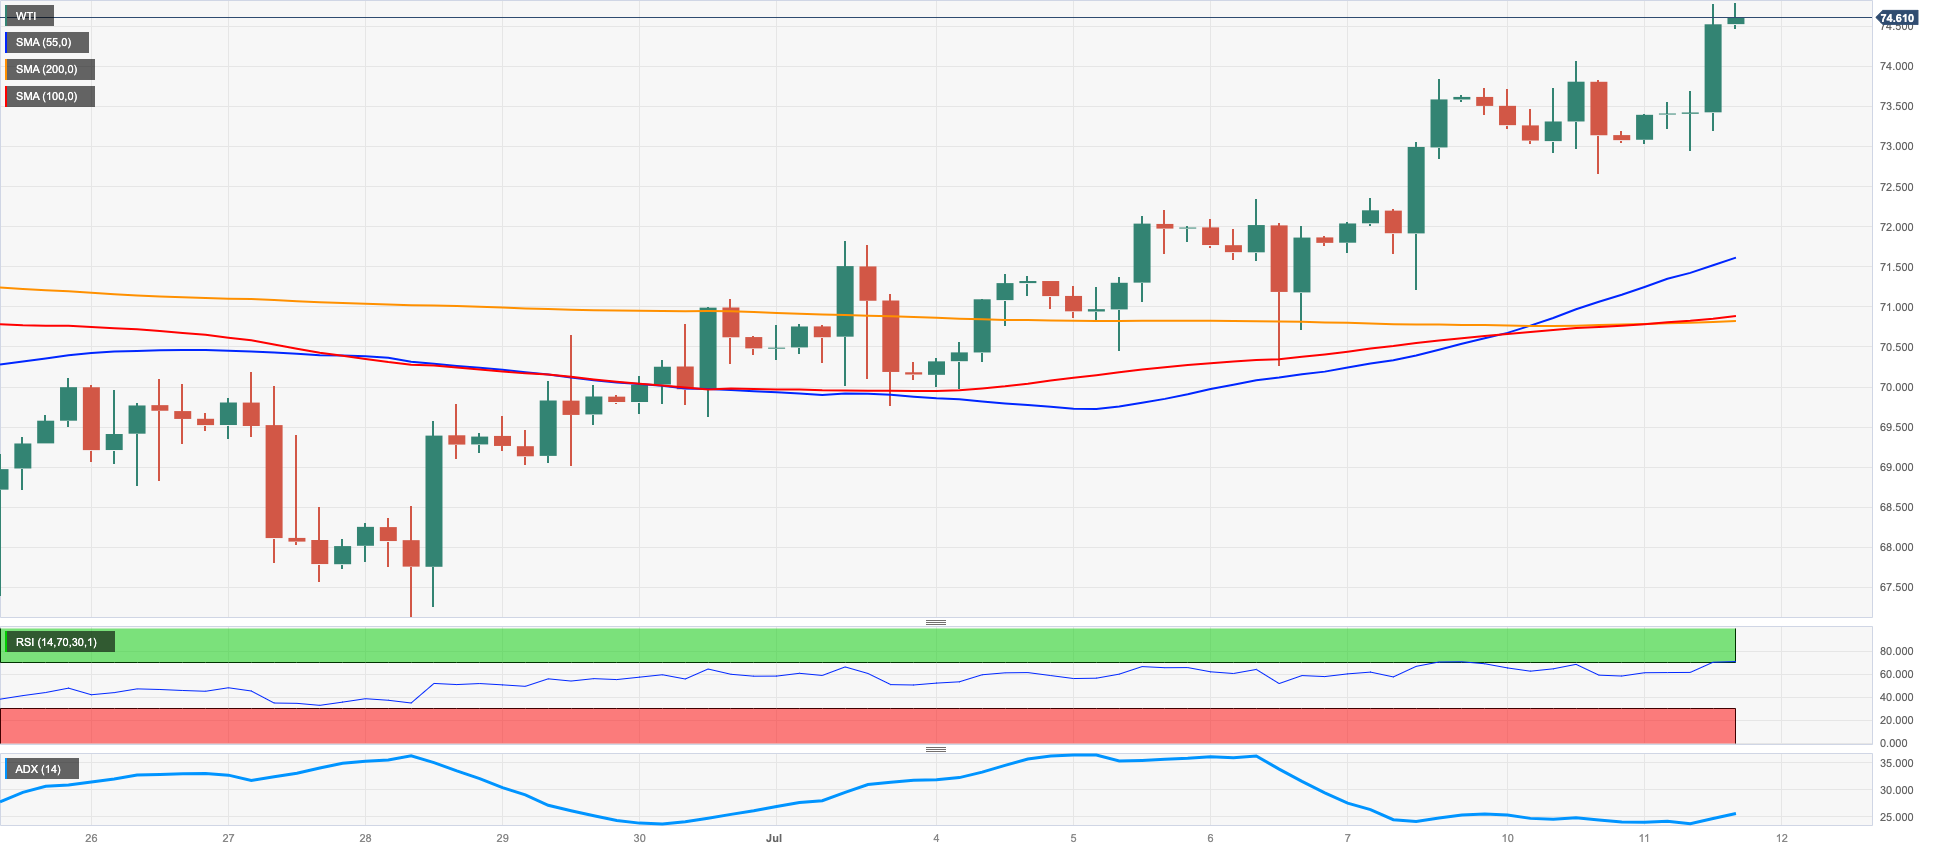
On Tuesday, WTI prices continued their upward rally, approaching the significant threshold of $75.00 per barrel. Simultaneously, they reached their highest levels in two months.
The decline in the value of the greenback, along with expectations of increased demand from China in the latter half of the week, as well as the reduction in oil output by Saudi Arabia and Russia, all played a role in driving the commodity's price higher on Tuesday.
Later in the session, the API will release its report on US crude oil inventories for the week ending July 7. Additionally, traders are anticipating the release of the US CPI for the month of June on Wednesday, which they will closely monitor.
The immediate resistance for WTI is the June high of $74.92 (June 5), followed by the 200-day SMA of $77.25 and the weekly high of $79.14 (April 24). The latter might break beyond the important $80.00 per barrel barrier, which is supported by the 2023 high of $83.49 (April 120) and the November 2022 high of $93.73 (November 7). On the other hand, the first point of contention comes at the interim 55-day SMA at $71.47 prior to the June low of $66.86 (June 13), the 2023 low of $63.61 (May 4), the December 2021 low of $62.46 (December 2), and the key level of $60.00 a barrel..
Resistance levels: $74.85 $76.89 $79.14 (4H chart)
Support levels: $70.73 $69.66 $67.01 (4H chart)
GER40
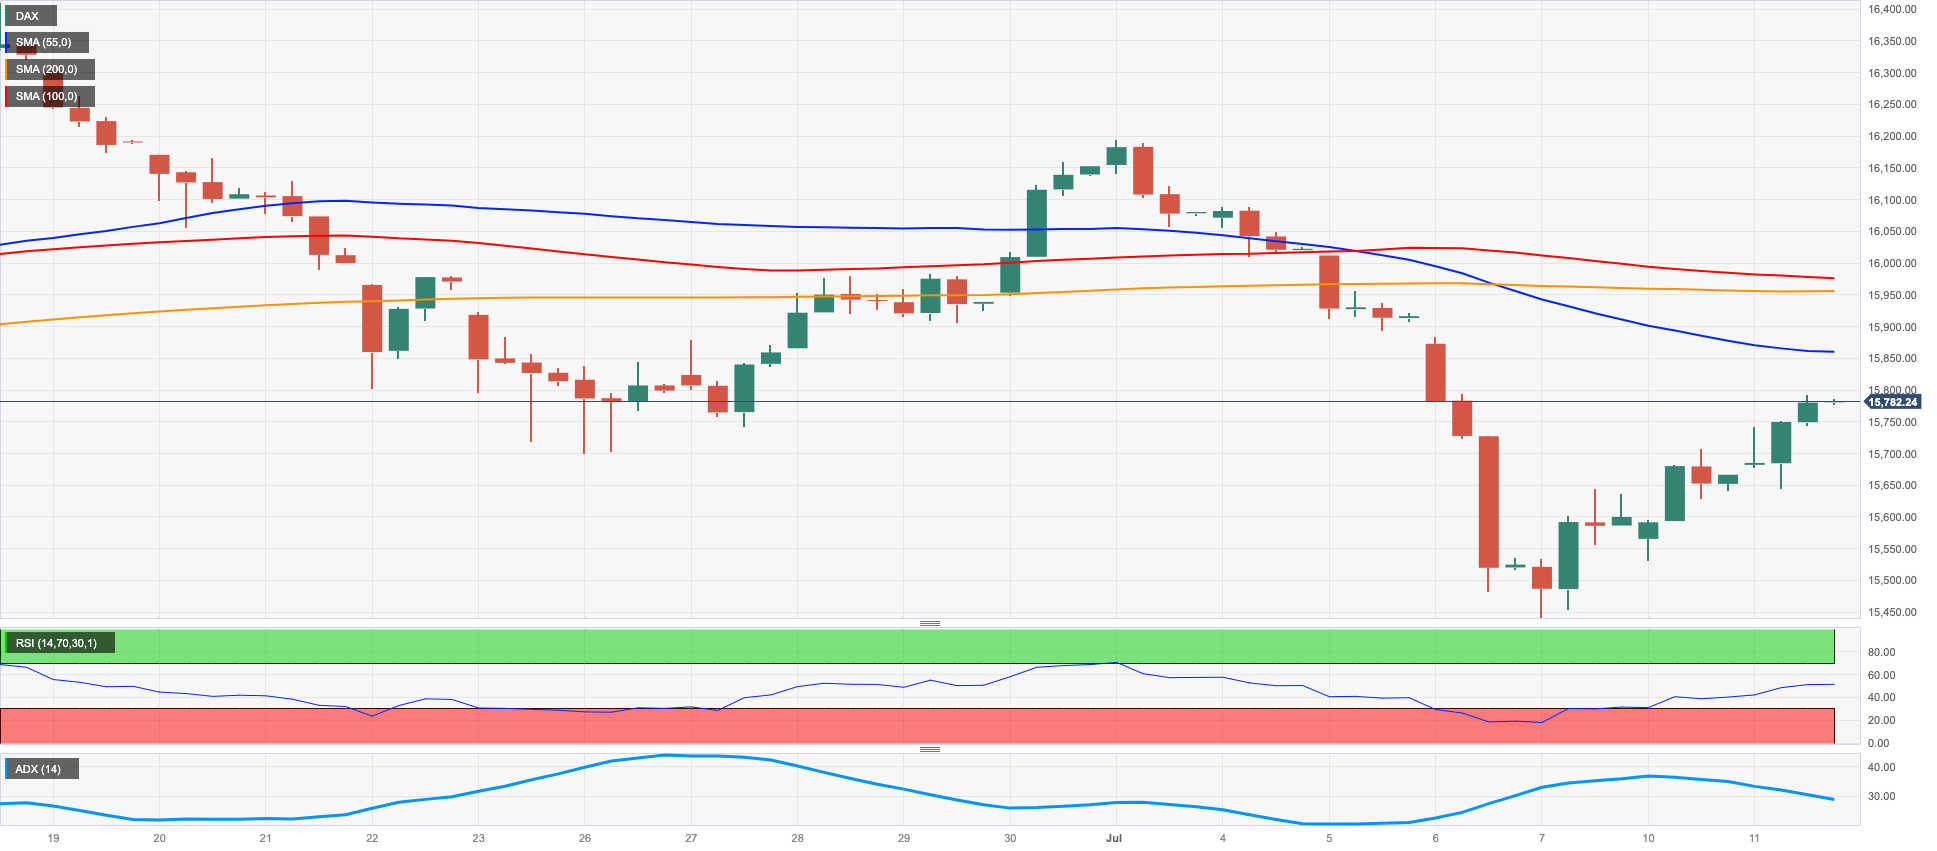
German equities extended Monday’s optimism and motivated the reference index DAX40 to advance for the third session in a row and regain the 15800 region on Tuesday.
The daily uptick in the index came on the back of reignited hopes of further stimulus in China, which should in turn help with the so far lagged economic recovery.
In addition, bets for another decline of the US CPI in June in combination with the likelihood that the Fed might be near the end of its tightening campaign also added to the sentiment.
In the German bonds market, the 10-year bund yields resumed the upside and revisited the area above 2.65%.
In Germany, final inflation figures showed the CPI rose 0.3% MoM in June and 6.4% YoY, while the Economic Sentiment tracked by the ZEW institute retreated to -14.7 in July.
The continuation of the rebound in the DAX40 is expected to meet the next hurdle at the transitory 55-day SMA of 15953 prior to the weekly high of 16209 (July 3) and the all-time high of 16427 (June 16). By contrast, there is initial support at the July low of 15456 on July 7 ahead of the 200-day SMA at 14909 and the March 20 bottom of 14458. The loss of the latter exposes a move to the December 2022 low of 13791. The daily RSI rose above the 45 mark.
Best Performers: Vonovia, Commerzbank, Zalando SE
Worst Performers: BMW ST, Deutsche Boerse, Beiersdorf AG
Resistance levels: 15807 15919 16209 (4H chart)
Support levels: 15456 14809 14458 (4H chart)
NASDAQ
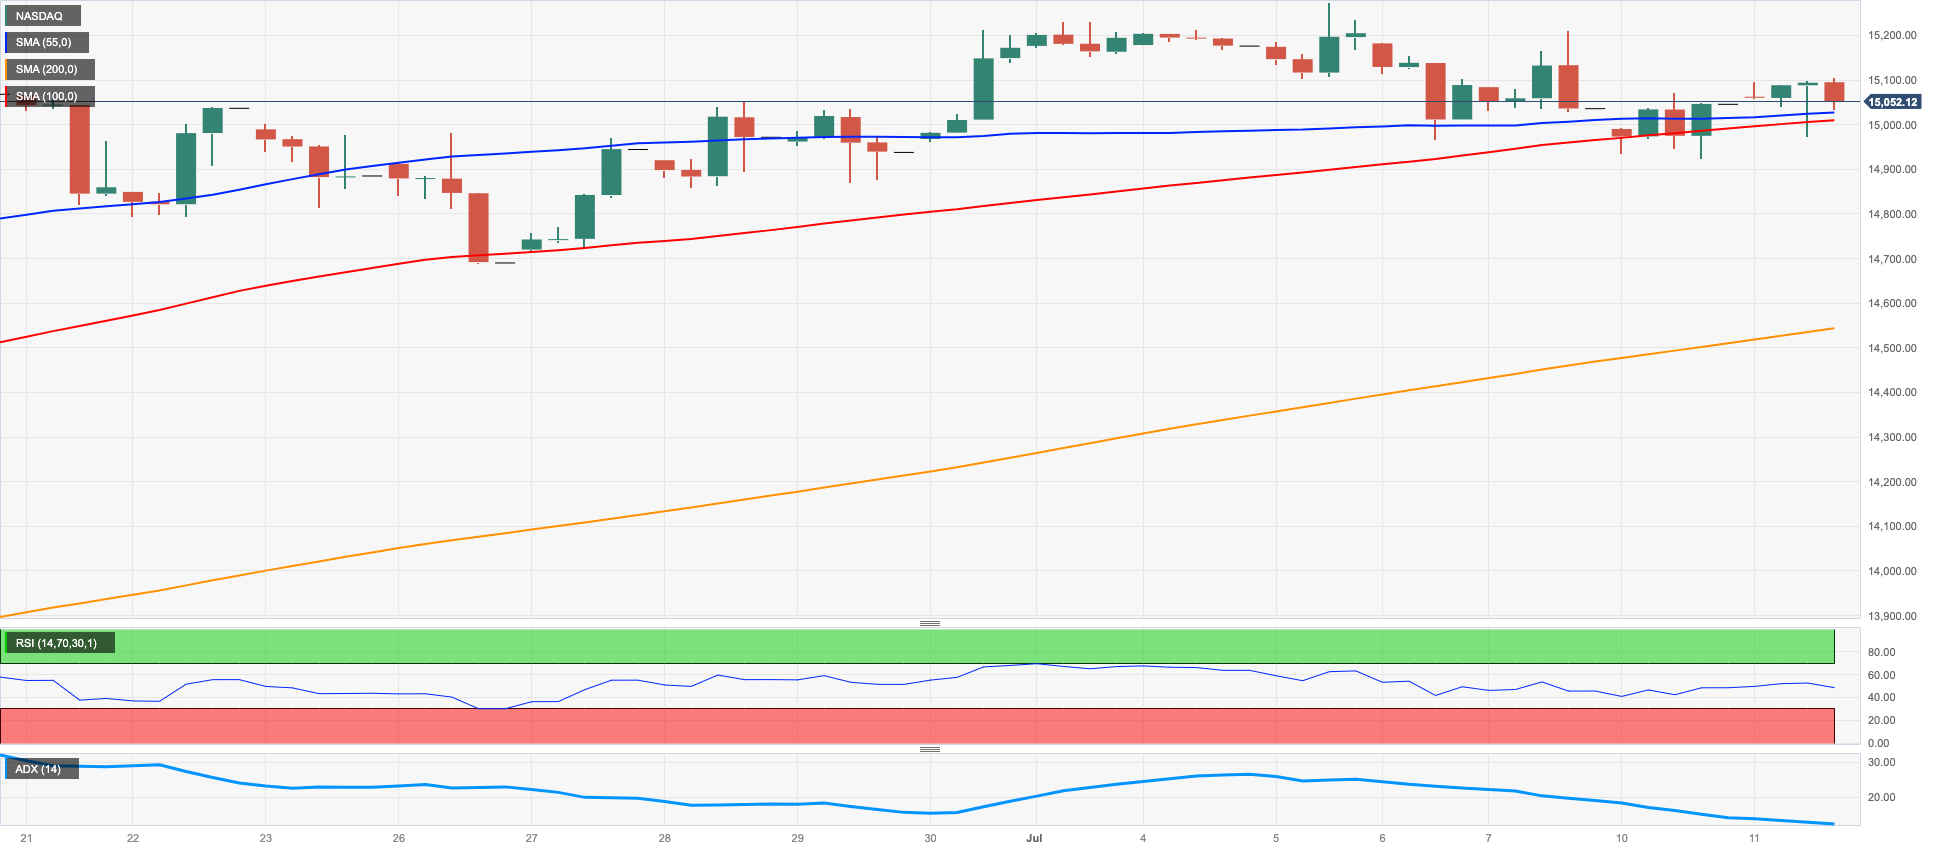
The tech benchmark Nasdaq 100 struggled to keep the trade above the key 15000 mark on Tuesday, extending the vacillating performance seen at the beginning of the week.
In the meantime, the index failed to capitalize on the selling pressure hitting the greenback as well as the marginal activity in US yields across the curve, while investors remained mostly optimistic ahead of the release of US inflation figures on Wednesday.
Further gains in the Nasdaq 100 needs to clear the 2023 high of 15284 (June 16), prior to the round milestone of 16000. On the contrary, immediate support comes at the weekly lows of 14687 (June 26) and 14283 (June 7), as well as the provisional 55-day SMA at 14140 and another weekly low of 13520 (May 24). A further loss may push the price below the May low of 12938 (May 4), the April low of 12724 (April 25), the 200-day SMA of 12459, and the March low of 11695 (March 13). The daily RSI looked stable near 61.
Top Gainers: Acitvision Blizzard, Electronic Arts, Datadog
Top Losers: Applied Materials, AMD, KLA Corp
Resistance levels: 15275 15284 16017 (4H chart)
Support levels: 14924 14687 14283 (4H chart)
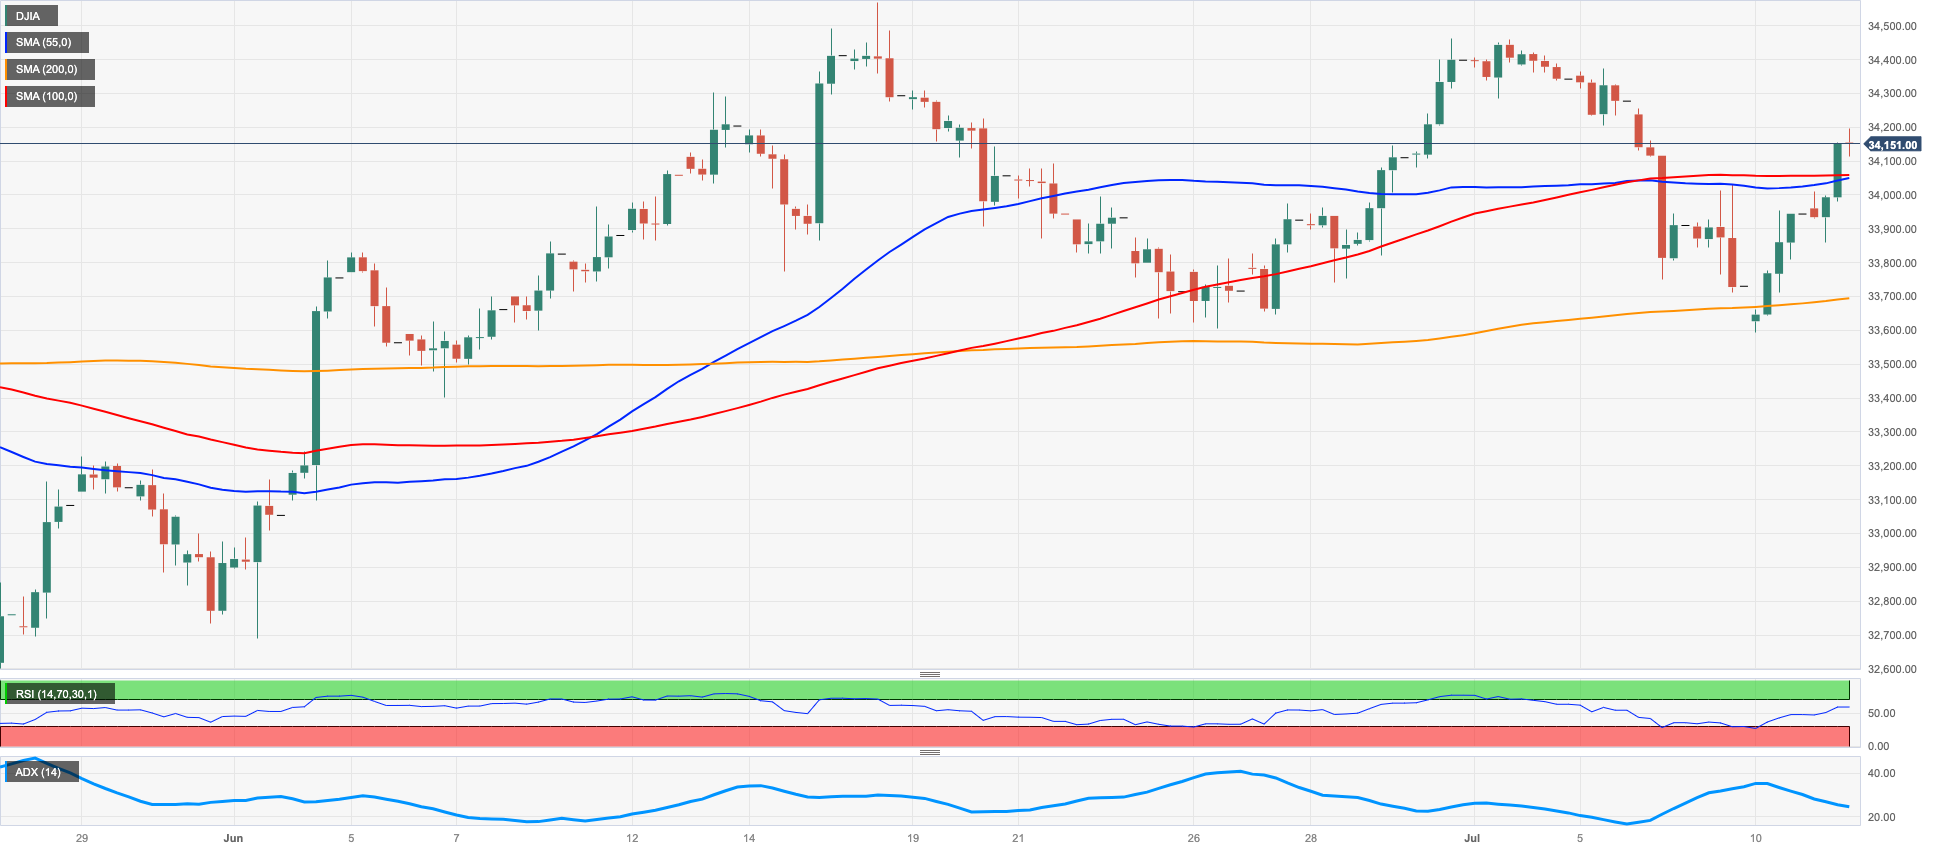
DOW JONES
The Dow Jones index increased for the second consecutive session on Tuesday, surpassing the 34000 level and continuing the strong start to the week.
The positive sentiment among investors persisted due to the expectation of a further decrease in US inflation, which will be revealed by the release of June's CPI on Wednesday.
Moreover, the optimistic outlook was supported by the impending corporate results from major US lenders later in the week.
All in all, the Dow Jones climbed 0.61% to 34150, the S&P500 rose 0.30% to 4422, and the tech-heavy Nasdaq Composite gained 0.15% to 13705.
A substantial Dow Jones bounce should return it to the June peak of 34467 (June 30), before the 2023 high of 34588 (June 16) and the December 2022 peak of 34712 (December 13). The April 2022 high of 35492 (April 21) lies north of here. Just the opposite, the weekly low of 33610 (June 26) is projected to provide early support prior to the interim 100-day SMA at 33367 and the key 200-day SMA at 33012. Lower levels of support from here include the May low of 32586 (May 25), the March low of 31429 (March 15), and the October 2022 low of 28660 (October 13). The day-to-day RSI has surpassed the 55 yardstick.
Top Performers: 3M, Salesforce Inc, American Express
Worst Performers: Merck&Co, Verizon, J&J
Resistance levels: 34467 34588 34712 (4H chart)
Support levels: 33610 33363 32586 (4H chart)
MACROECONOMIC EVENTS

All Information & Updates provided by:

All information relating to the financial markets available on this page has been prepared and issued by FXStreet (Forexstreet SL, Spain, Reg: B62498233) on the basis of publicly available information and all information believed to be reliable and does not conflict with Kuwaiti local laws, and all necessary care has been taken to before the company to ensure that the facts mentioned are correct from the source.
NCM Investment nor any of its directors or employees shall in any way be held responsible for the contents of this news, and the information contained on this page is intended only to provide clients with publicly available information and should not be construed as investment advice, report or analysis and/or constitute an offer or invitation to buy or sell financial instruments of any kind.
RISK WARNING: Forex and CFDs are highly risky leveraged products, as losses can exceed deposits. Please ensure you understand all the risks and take independent advice if necessary. NCM will segregate the clients based on the criteria of the regulator and its bylaws. NCM does not provide any advisory service; the material published does not constitute advice or a recommendation for a transaction in any financial instrument. NCM accepts no responsibility for any use of the content presented and any consequences of that use. Anyone acting on the information provided does so at their own risk.