
- Contact Us:
-

-

-

-


Daily Market Updates
13 Jul 2023
USDJPY
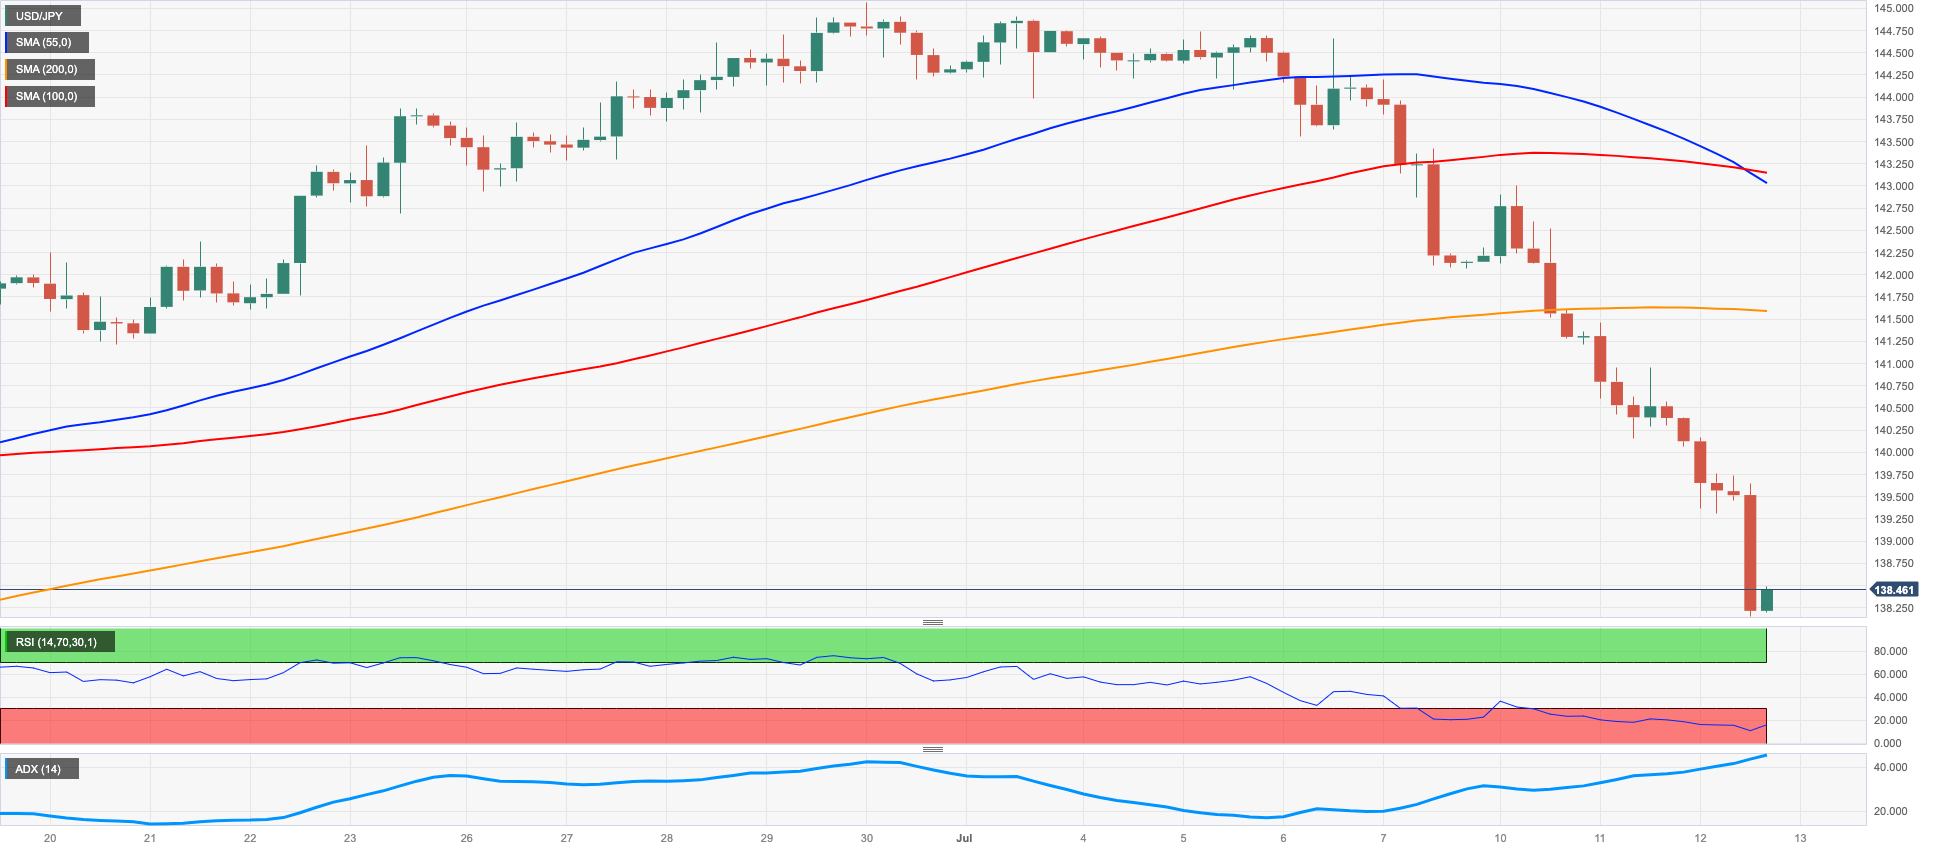
Further weakness in the greenback sponsored the fifth consecutive daily pullback in USD/JPY, this time breaking below the 139.00 support to print 5-week lows near the 138.00 neighbourhood midweek.
The pronounced decline in the dollar was magnified after US inflation figures rose less than anticipated in June, reinforcing market chatter around a potential end of the Fed’s tightening cycle in the second half of the year.
Further bearishness for the pair came from the bond markets, where US yields extended the retracement across the curve vs. a move to multi-week highs in the JGB 10-year yields.
In Japan, Machinery Orders contracted at an annualized 8.7% in May, while Producer Prices dropped 0.2% MoM in June and rose 4.1% from a year earlier.
USD/JPY is now expected to find support around the June low of 138.42 (June 1), with further support around the key 200-day SMA of 137.14. If the pair continues to fall, the interim 100-day SMA at 136.94, the weekly low at 133.01 (April 26), and minor support at 132.01 (April 13) may provide additional support ahead of the April low of 130.62 (April 5) and major support at 130.00. On the upside, the USD/JPY should first challenge the 2023 top of 145.07 (June 30), then the 2022 peak of 151.94 (October 21) and finally the round level of 152.00. The day-to-day RSI collapsed to the 32 area.
Resistance levels: 141.55 143.00 144.65 (4H chart)
Support levels: 138.15 137.49 135.64 (4H chart)
GBPUSD
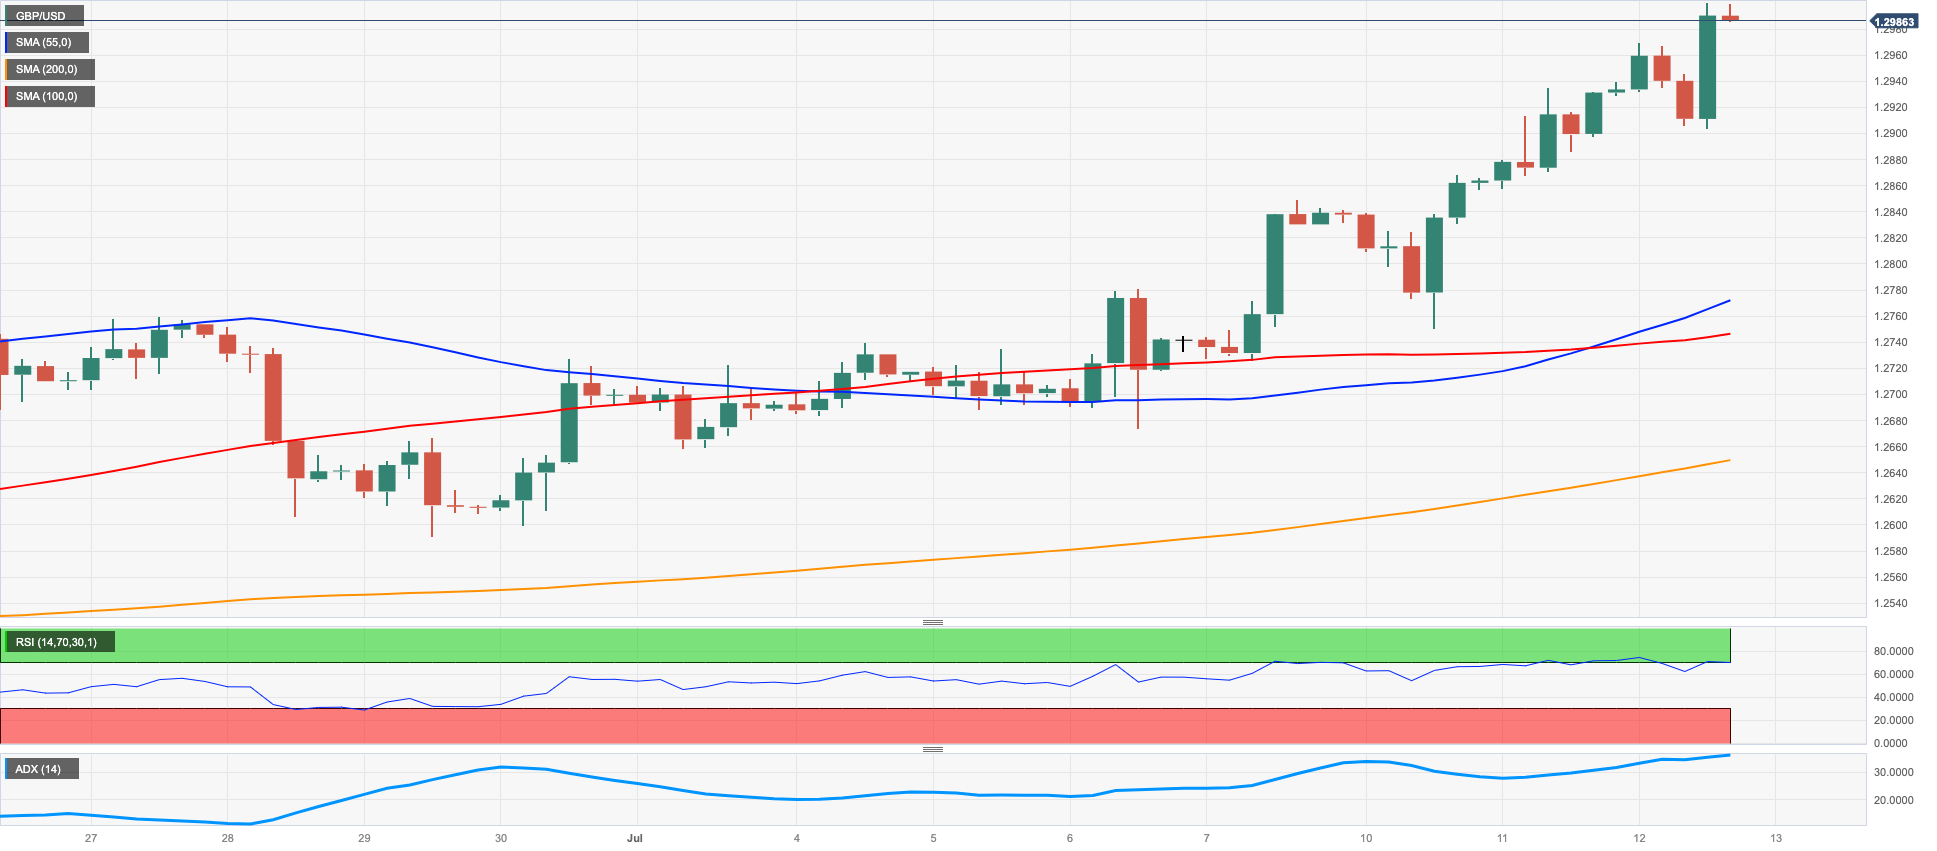
The sharp decline in the greenback sponsored another positive session in the British pound and pushed GBP/USD to finally revisit the psychological 1.3000 hurdle on Wednesday.
In the meantime, the quid appears supported by firmer bets of extra tightening by the BoE in the second half of the year, with investors pricing in rates peaking beyond the 6.0% threshold.
Still around the BoE, Governor A. Bailey commented that the increasing rates have caused strain on the financial system, and that households and businesses are now less inclined to reduce their spending. He also stated that the components of the global financial system are still susceptible to higher rates and geopolitical risks. According to him, the complete effects of the rate hikes will take some time to become apparent. However, he pointed out that the robust UK labor market has lessened the pressure on households resulting from higher rates at a time when the most recent employment figures indicate some signs of the labor market easing. Bailey also noted that the present level of wage increases is not aligned with the inflation target.
The breakout of the 2023 high of 1.3000 (July 12) may inspire GBP/USD to test the weekly peak of 1.3146 (April 14, 2022). On the other hand, the weekly low of 1.2590 (June 29) provides immediate support ahead of the interim 55-day SMA at 1.2588 and the 1.2540 zone, which corresponds to the 2021-2023 trend line. Following that is the June low of 1.2368 (June 5), the May low of 1.2308 (May 25), and the April low of 1.2274 (April 3). The loss of this level exposes a probable move to the 200-day SMA at 1.2178. The daily RSI trespassed the 70 barrier to enter into the overbought ground.
Resistance levels: 1.3000 1.3089 1.3146 (4H chart)
Support levels: 1.2903 1.2750 1.2673 (4H chart)
AUDUSD
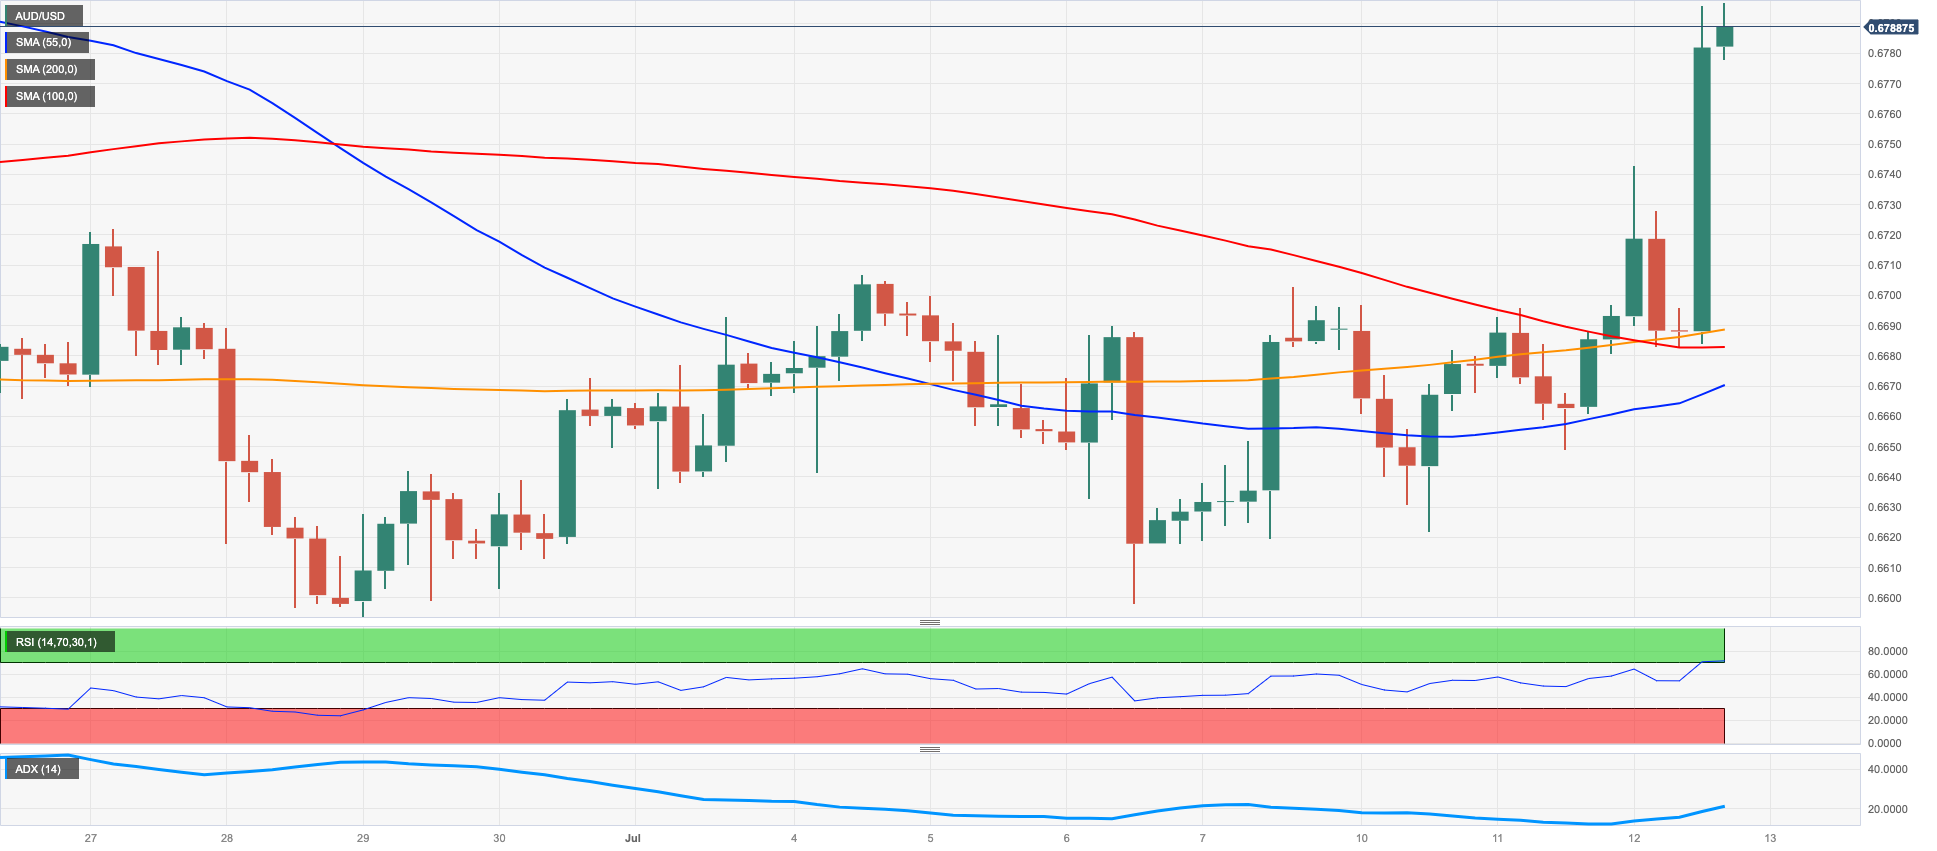
The dollar’s collapse helped AUD/USD extend its monthly upside to fresh 3-week tops, reaching the boundaries of 0.6800 the figure on Wednesday.
In fact, the selling bias in the greenback gathered extra impulse in the wake of the release of lower-than-estimated US inflation figures for the month of June, which boosted speculation of a sooner-than-expected end of the Fed’s tightening cycle.
Also contributing to the upbeat mood around the high-beta currency emerged the broad-based bullish session in the commodity universe, which saw copper prices and iron ore leave behind part of the recent bearishness.
In the Australian docket, the only release of note was the speech by RBA Governor P. Lowe, who argued that further tightening might be necessary to bring inflation back to the target. He also mentioned that the board would be presented with fresh economic forecasts and updated data during the August meeting. Lowe also acknowledged that monetary policy had been tightened considerably and quickly but added that its complete effects were yet to be experienced, as monetary policy works with a lag.
AUD/USD recorded a new July high at 0.6797 on July 12. The surpass of this level should open the door to a probable visit to the June peak of 0.6899 (June 16). Aside from that, the significant 0.7000 level, the weekly high of 0.7029 (February 14), and the 2023 high of 0.7157 (February 2) are also important milestones to watch. A break below the weekly low of 0.6595 (June 29) may instead result in a slide to the 2023 low of 0.6458 (May 31). The November 2022 low of 0.6272 (November 3) and the October 2022 low of 0.6169 (October 13) are both south of here. The daily RSI leap to the 60 zone.
Resistance levels: 0.6796 0.6899 0.7029 (4H chart)
Support levels: 0.6599 0.6579 0.6458 (4H chart)
GOLD
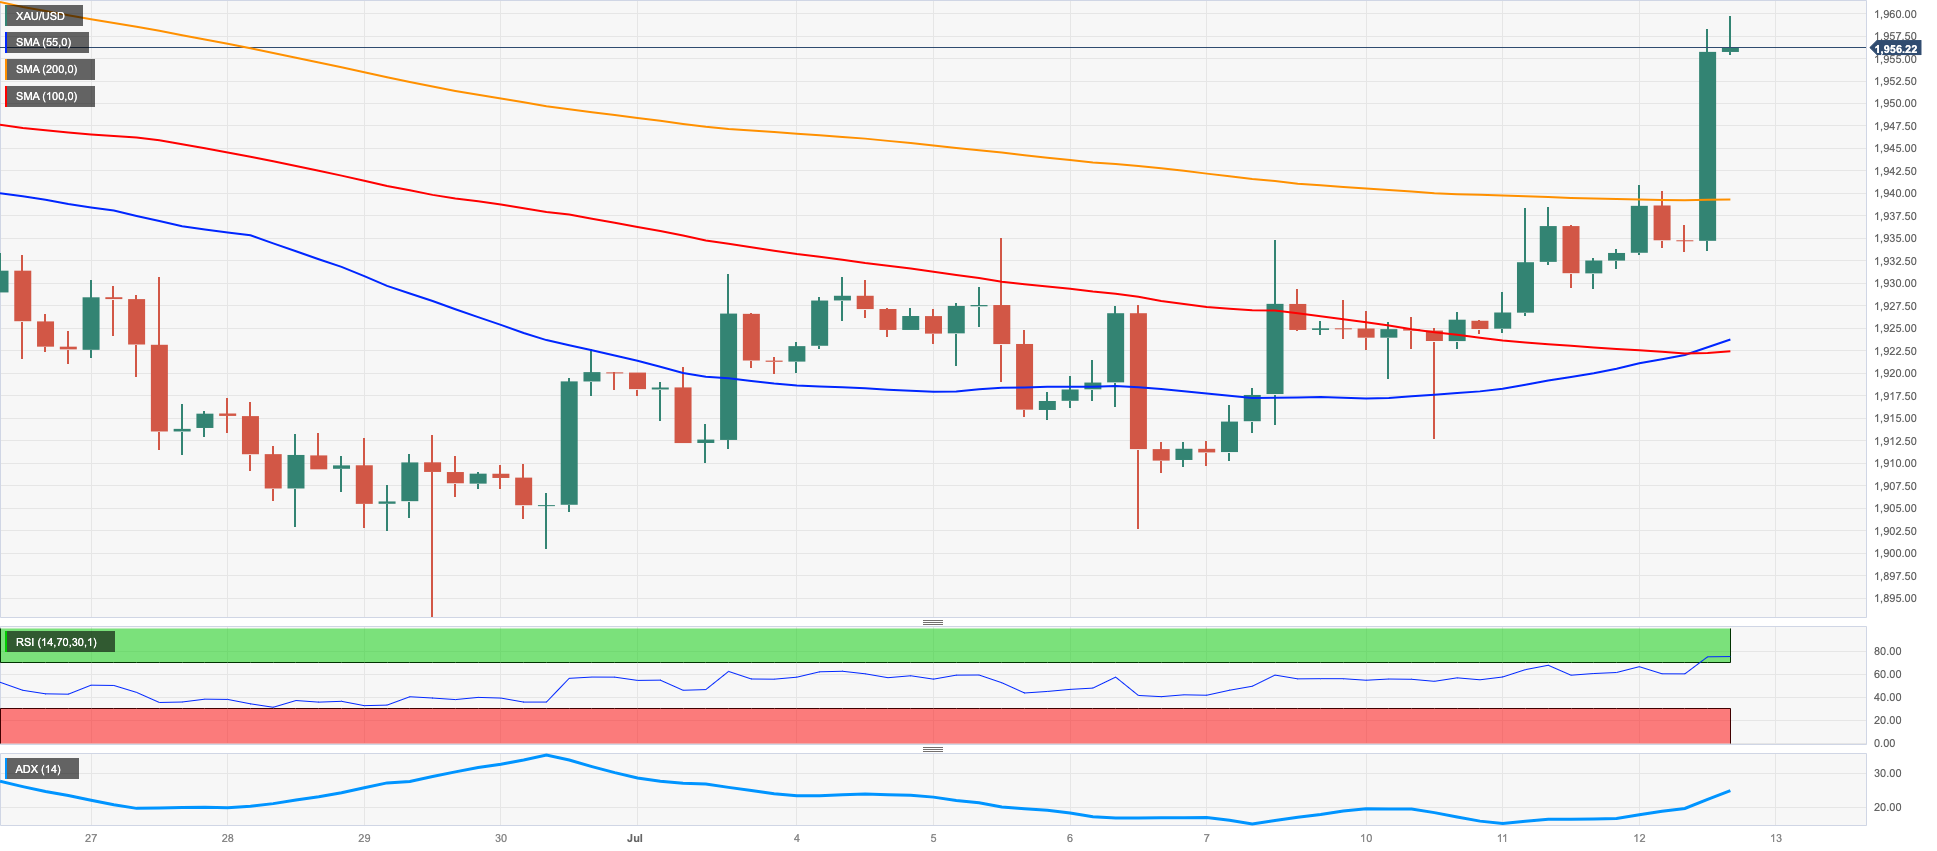
Gold prices added to Tuesday’s advance and rose markedly to 4-week peaks near the $1960 mark per troy ounce on Wednesday.
The sharp uptick in the precious metal came on the back of the pronounced retracement in the greenback, which was particularly magnified after another release of US inflation figures confirmed the so-far persistence of disinflationary pressures.
In addition, declining US yields across the curve also contributed to the upside bias in the yellow metal midweek.
Gold seems to have broken above the multi-session consolidative phase. That said, further upside now faces initial up-barrier at the provisional 55-day SMA of $1961, ahead of the June high of $1983 (June 2), which precedes the key $2000 target. There is no significant northward resistance until the 2023 peak of $2067 (4 May), which comes after the 2022 top of $2070 (8 March) and before the all-time high of $2075 (7 August 2020). Having said that, immediate contention aligns at the June low of $1893 (29 June), before heading to the significant 200-day SMA at $1868 and the 2023 low of $1804 (28 February), both of which are ahead of the crucial $1800 barrier. The
Resistance levels: $1958 $1967 $1983 (4H chart)
Support levels: $1902 $1893 $1885 (4H chart)
CRUDE WTI
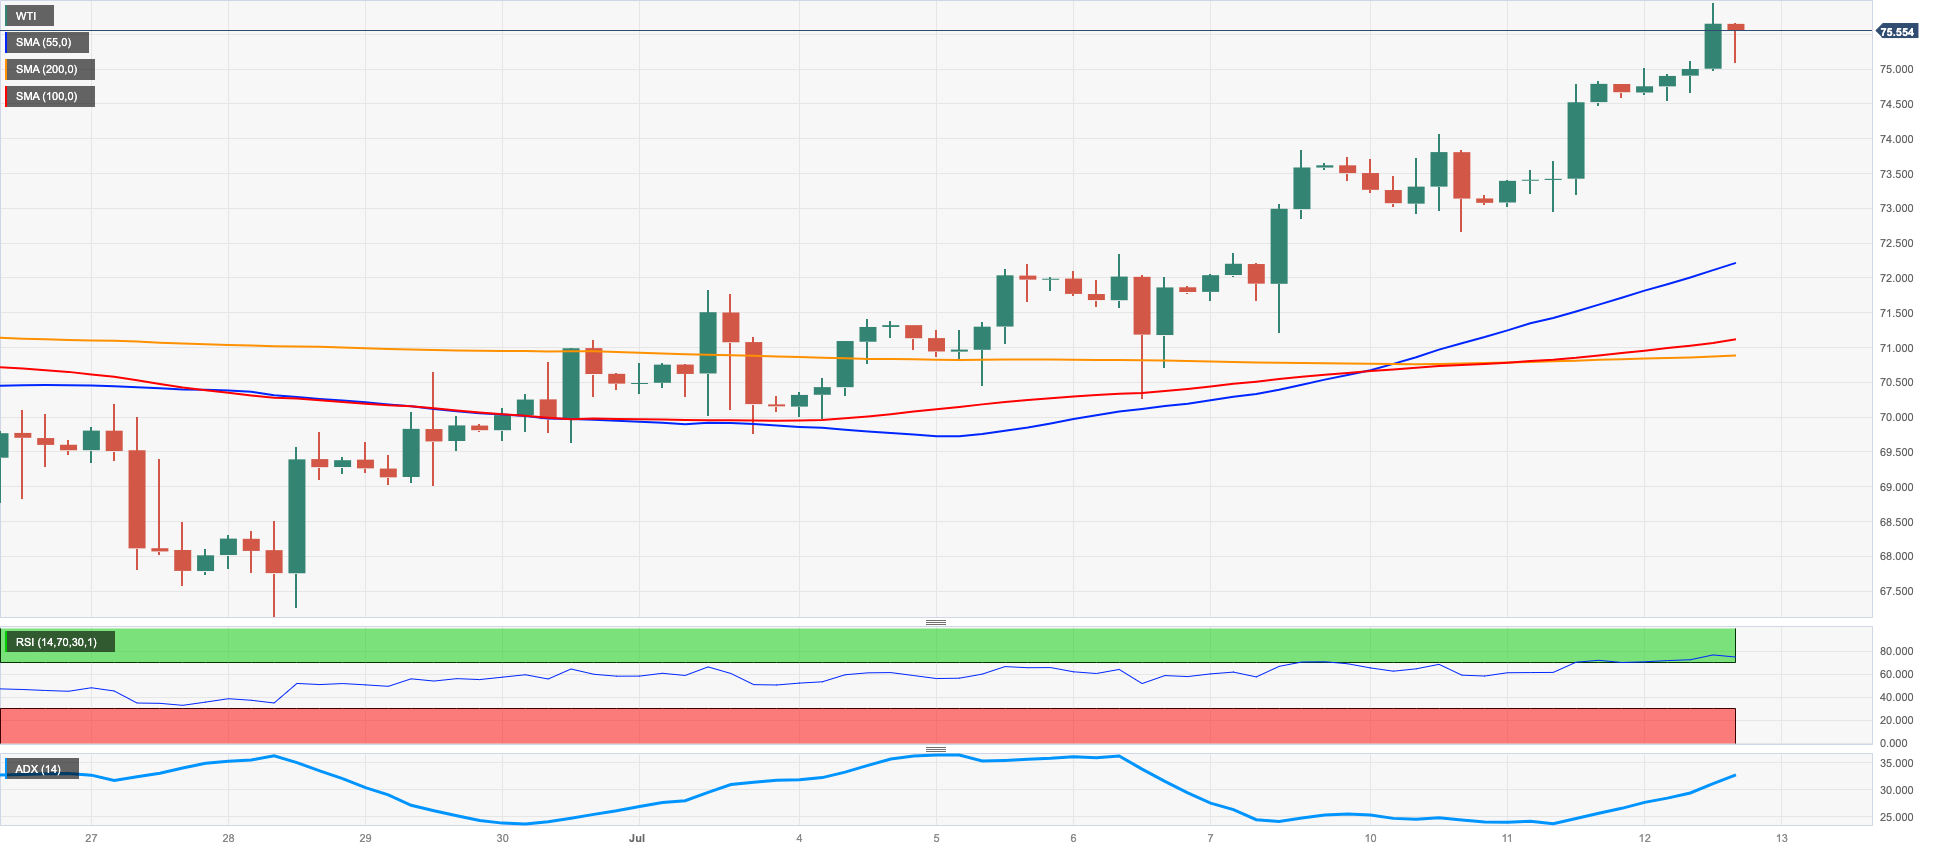
On Wednesday, WTI prices climbed for the second day in a row, briefly surpassing the $76.00 per barrel mark for the first time since early May. So far, the positive momentum in the commodity market has been sustained for three weeks in a row.
This uptick was supported by a weaker dollar and a shift in sentiment among traders, who are now less concerned about the Federal Reserve's long-term stance on tightening.
The IEA's projections on Tuesday of a tight oil market in the second half of the year also contributed to the upbeat sentiment.
Despite a larger-than-anticipated build in US crude oil inventories reported by the EIA on Wednesday, traders were able to offset this negative news with the positive factors mentioned above.
On this, the agency reported that US crude oil inventories increased more than expected by 5.946M barrels in the week to July 7, while supplies at Cushing shrank by 1.605M barrels, Weekly Distillate Stocks went up by 4.815M barrels and gasoline stockpiles dropped marginally by 0.003M barrels.
WTI now needs to clear the July high at $76.11 (July 12) to allow for a test of the key 200-day SMA of $77.22 and the weekly high of $79.14 (April 24). The latter might break beyond the crucial $80.00 per barrel barrier, which is supported by the 2023 high of $83.49 (April 12) and the November 2022 high of $93.73 (November 7). On the flip side, the provisional 55-day SMA at $71.44, however, precedes the June low of $66.86 (June 13), the 2023 low of $63.61 (May 4), the December 2021 low of $62.46 (December 2), and the crucial level of $60.00 a barrel.
Resistance levels: $76.11 $76.89 $79.14 (4H chart)
Support levels: $72.64 $70.82 $67.01 (4H chart)
GER40
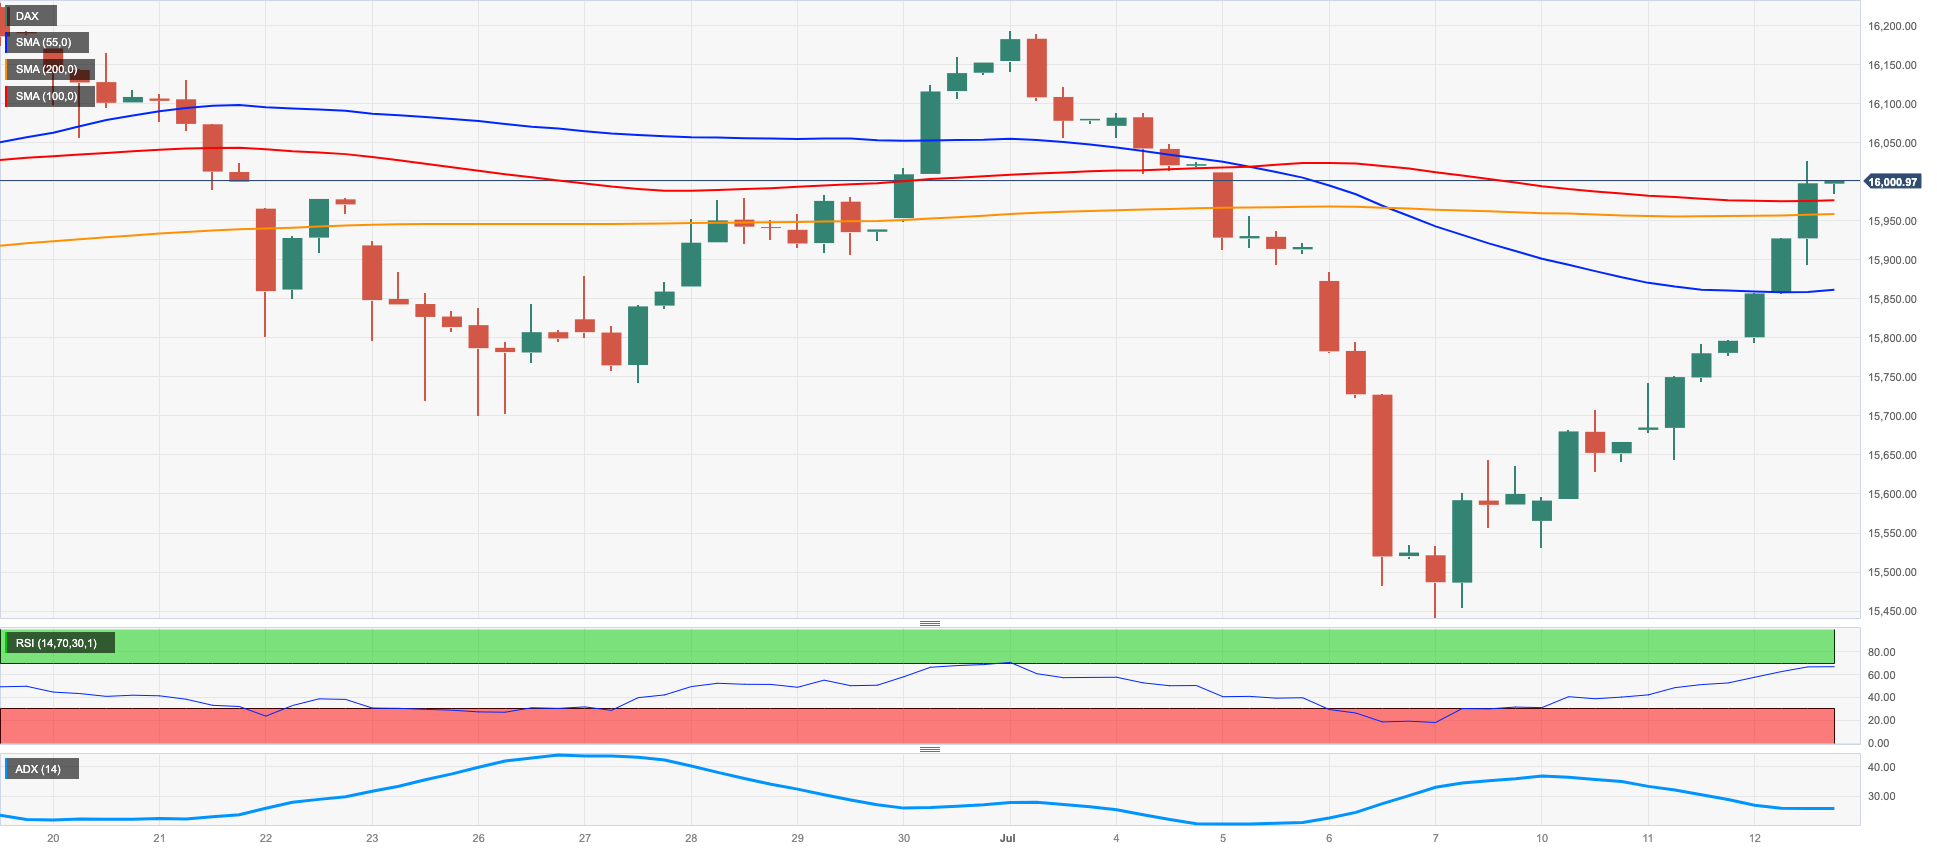
Germany’s stock benchmark, the DAX40, rose for the fourth session in a row and reclaimed the 16000 mark and beyond on Wednesday. The move higher in the index came in line with the generalized upbeat tone in stocks in the old continent.
The persistent risk-on mood in combination with lower-than-expected US inflation figures boosted the sentiment among European investors on Wednesday, lending extra wings to the index as market participants now seem to perceive that the end of the Fed hiking cycle seems closer.
Mirroring the performance of their American peers, the German 10-year Bund yields dropped to multi-session lows and hovered around the 2.50% zone.
The DAX40's comeback is likely to reach the weekly top of 16209 (July 3) ahead of the all-time high of 16427 (June 16). In comparison, there is initial support at the July low of 15456 (July 7), which is ahead of the 200-day SMA at 14929 and weekly low 14458 (March 20). The drop below the latter opens the door to a decline to the December 2022 low of 13791 (December 20). The daily RSI surpassed the 53 hurdle.
Best Performers: Zalando SE, Vonovia, Infineon
Worst Performers: Deutsche Bank AG, Beiersdorf AG, Bayer
Resistance levels: 16044 16209 16427 (4H chart)
Support levels: 15456 14809 14458 (4H chart)
NASDAQ
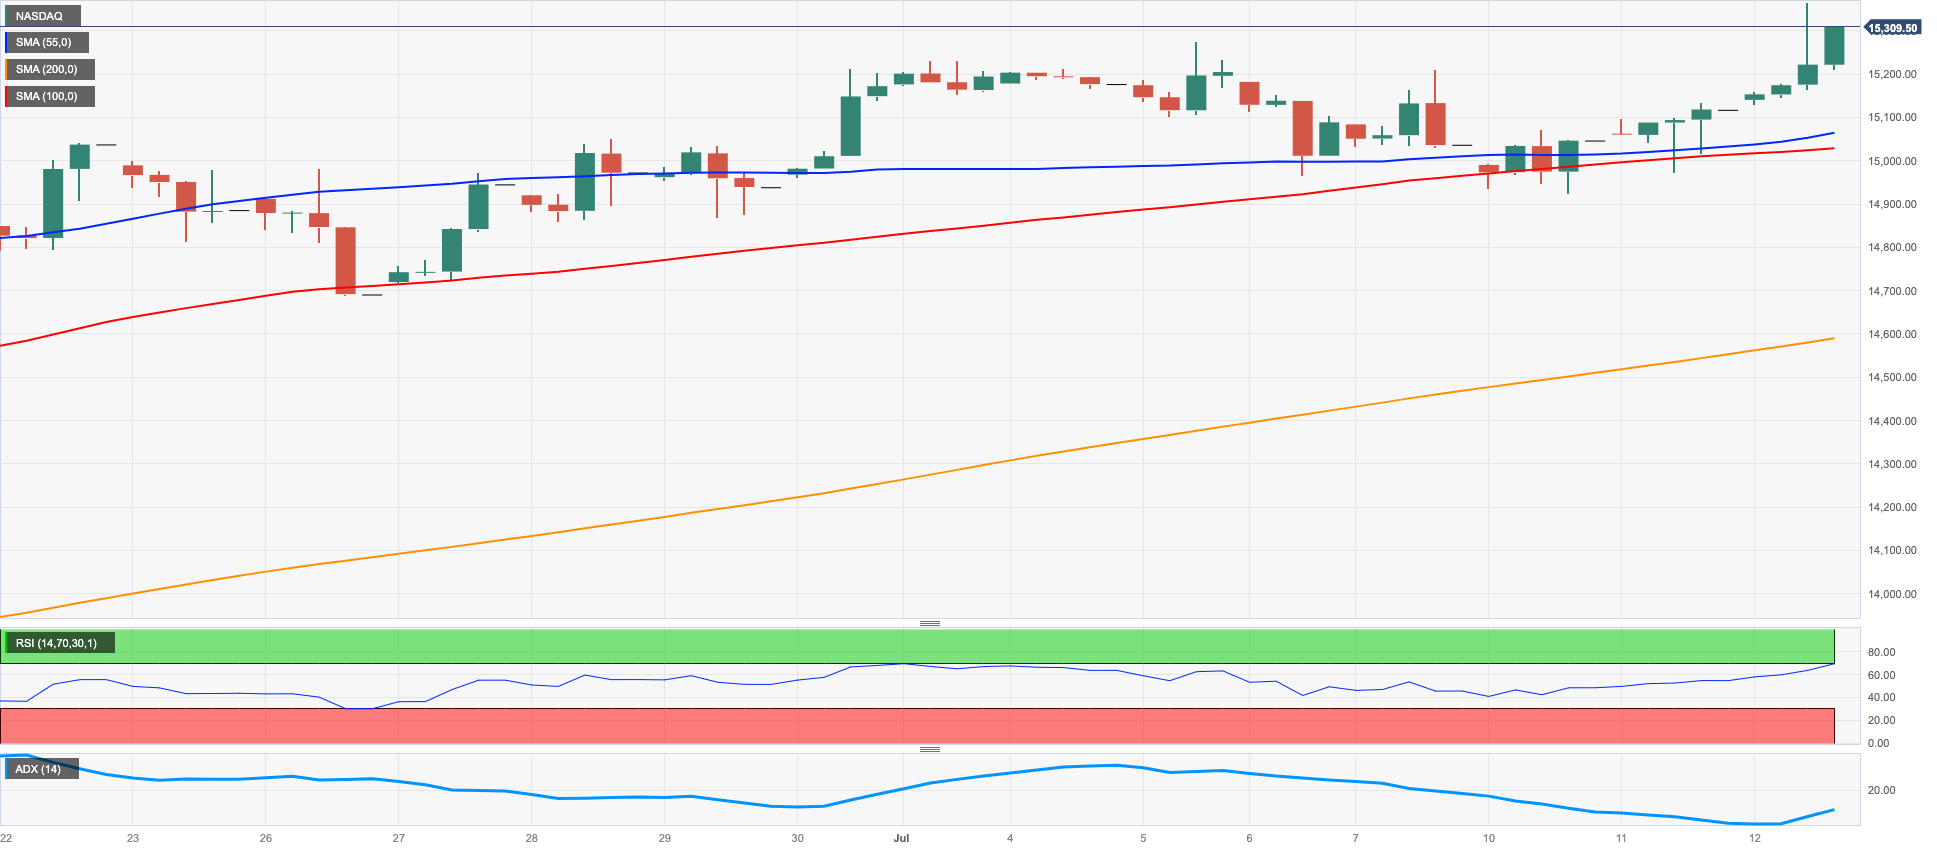
US stocks tracked by the reference Nasdaq 100 climbed further and clinched a new 2023 high at 15364 on Wednesday.
The optimism around the tech sector improved further on the back of the persistent sell-off in the dollar, while decreasing US yields across the curve and the prospects that the Fed might end its hiking campaign soon also propped up the upside bias.
More Nasdaq 100 gains are required to clear the 2023 high of 15364 (July 12) to pave the way for a potential visit to the round milestone of 16000. Immediate support, on the other hand, may be found around the weekly lows of 14687 (June 26) and 14283 (June 7), as well as the temporary 55-day SMA at 14183 and another weekly low of 13520 (May 24). A further decline may send the price below the May low of 12938 (May 4), the April low of 12724 (April 25), the 200-day SMA at 12478, and the March low of 11695 (March 13). The daily RSI rose past the 66 yardstick.
Top Gainers: PDD Holdings DRC, JD.com Inc Adr, Enphase
Top Losers: Lucid Group, Palo Alto Networks, Zscaler
Resistance levels: 15364 16017 16607 (4H chart)
Support levels: 14924 14687 14283 (4H chart)
DOW JONES
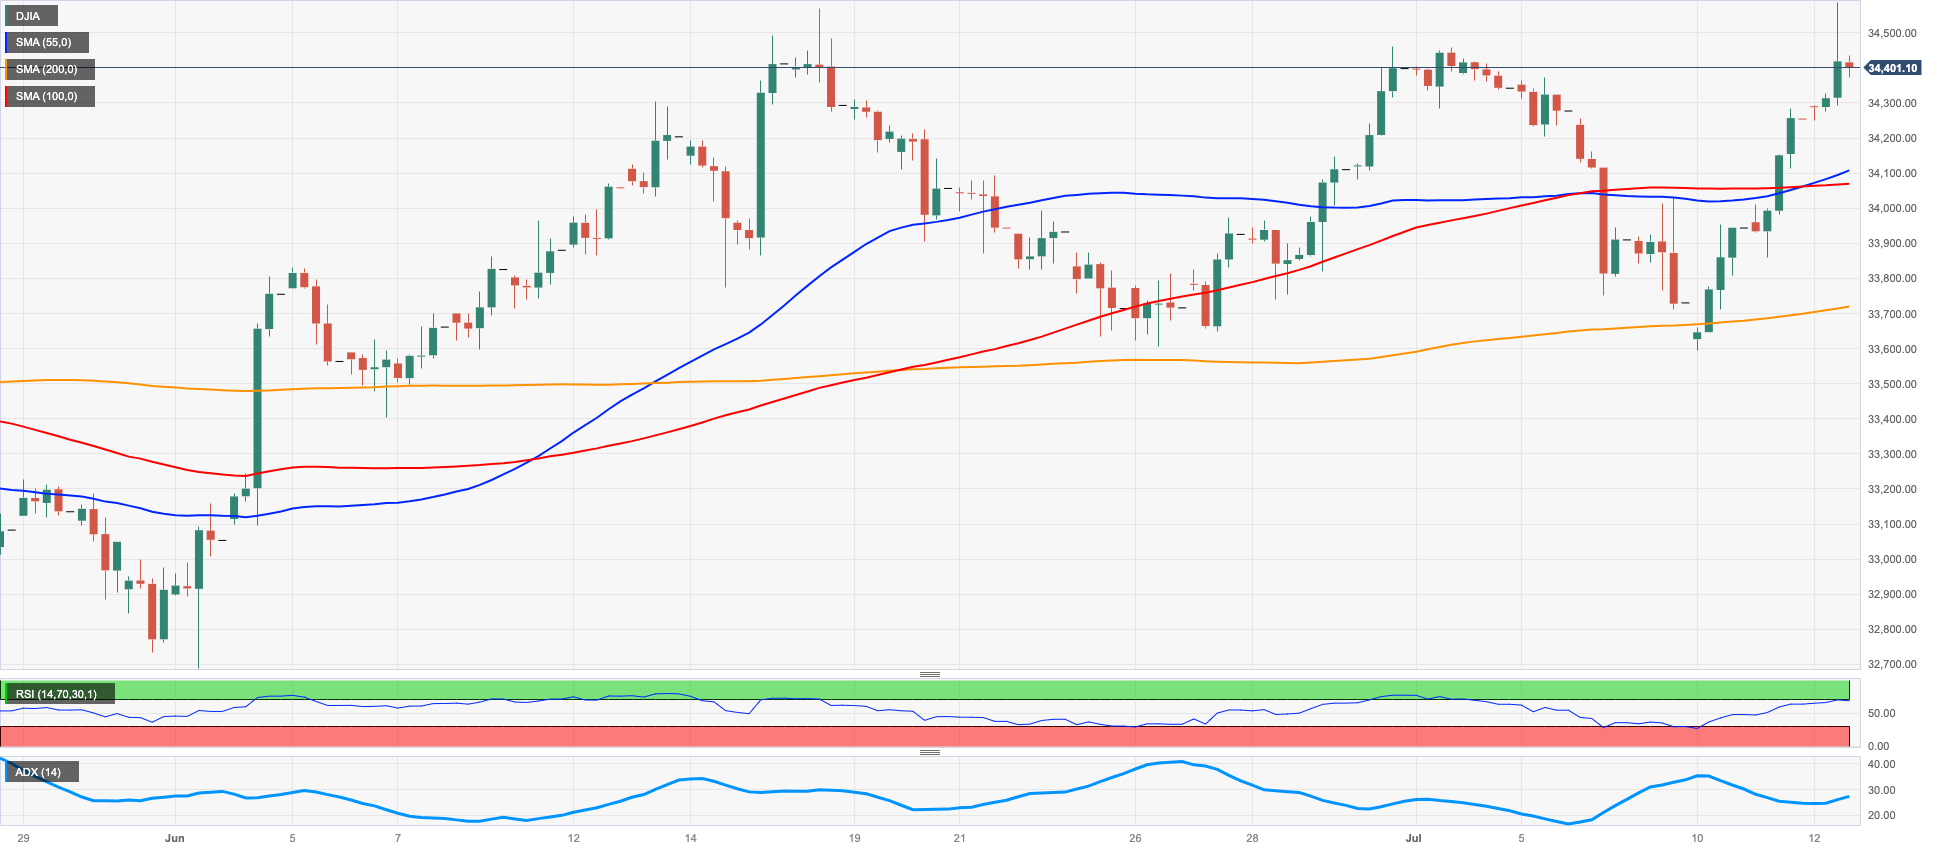
US equities measured by the Dow Jones rose for the third straight session on Wednesday, extending further the recent breakout of the key 34000 yardstick.
Lower-than-expected US inflation figures bolstered investors’ hopes that the Fed’s tightening era could be nearing its end, despite the central bank's largely anticipated hike in the Fed Funds Target Range (FFTR) by another quarter point at its July 26 event.
In addition, traders remained cautious ahead of the release of Producer Prices on Thursday, while banks are expected to kick off the earnings season on Friday.
On the whole, the Dow Jones gained 0.38% to 34392, the S&P500 climbed 0.76% to 4472, and the tech-focused Nasdaq Composite rose 1.01% to 13898.
The rebound in the Dow Jones faltered just ahead of the 2023 high of 34588 (June 16). The surpass of the latter could motivate a test of the December 2022 peak of 34712 (December 13) to emerge on the horizon ahead of the April 2022 high of 35492 (April 21). On the contrary, the weekly low of 33610 (June 26) is expected to give early support before the interim 100-day SMA of 33371 and the key 200-day SMA of 33034. Lower levels of support from here include the May 25 low of 32586, the 2023 low of 31429 (March 15), and the 2022 low of 28660 (October 13). The RSI for the day rose to the proximity of the 60 level.
Top Performers: Goldman Sachs, Home Depot, Microsoft
Worst Performers: Cisco, UnitedHealth, Travelers
Resistance levels: 34588 34712 35492 (4H chart)
Support levels: 33705 33366 32586 (4H chart)
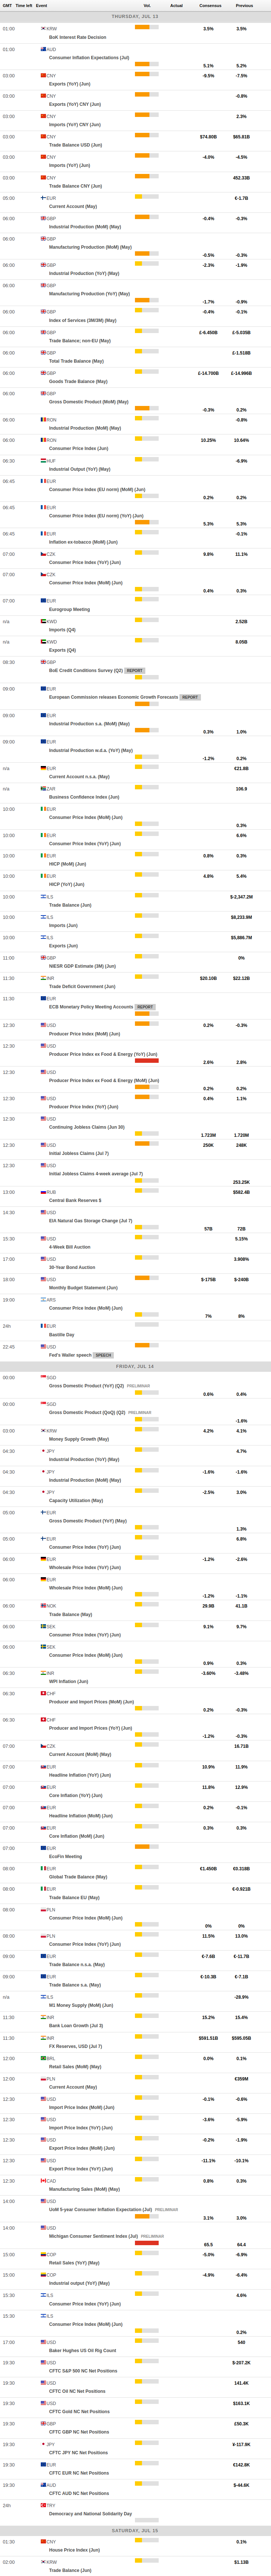
MACROECONOMIC EVENTS
All Information & Updates provided by:

All information relating to the financial markets available on this page has been prepared and issued by FXStreet (Forexstreet SL, Spain, Reg: B62498233) on the basis of publicly available information and all information believed to be reliable and does not conflict with Kuwaiti local laws, and all necessary care has been taken to before the company to ensure that the facts mentioned are correct from the source.
NCM Investment nor any of its directors or employees shall in any way be held responsible for the contents of this news, and the information contained on this page is intended only to provide clients with publicly available information and should not be construed as investment advice, report or analysis and/or constitute an offer or invitation to buy or sell financial instruments of any kind.
RISK WARNING: Forex and CFDs are highly risky leveraged products, as losses can exceed deposits. Please ensure you understand all the risks and take independent advice if necessary. NCM will segregate the clients based on the criteria of the regulator and its bylaws. NCM does not provide any advisory service; the material published does not constitute advice or a recommendation for a transaction in any financial instrument. NCM accepts no responsibility for any use of the content presented and any consequences of that use. Anyone acting on the information provided does so at their own risk.