
- Contact Us:
-

-

-

-


Daily Market Updates
14 Jul 2023
USDJPY
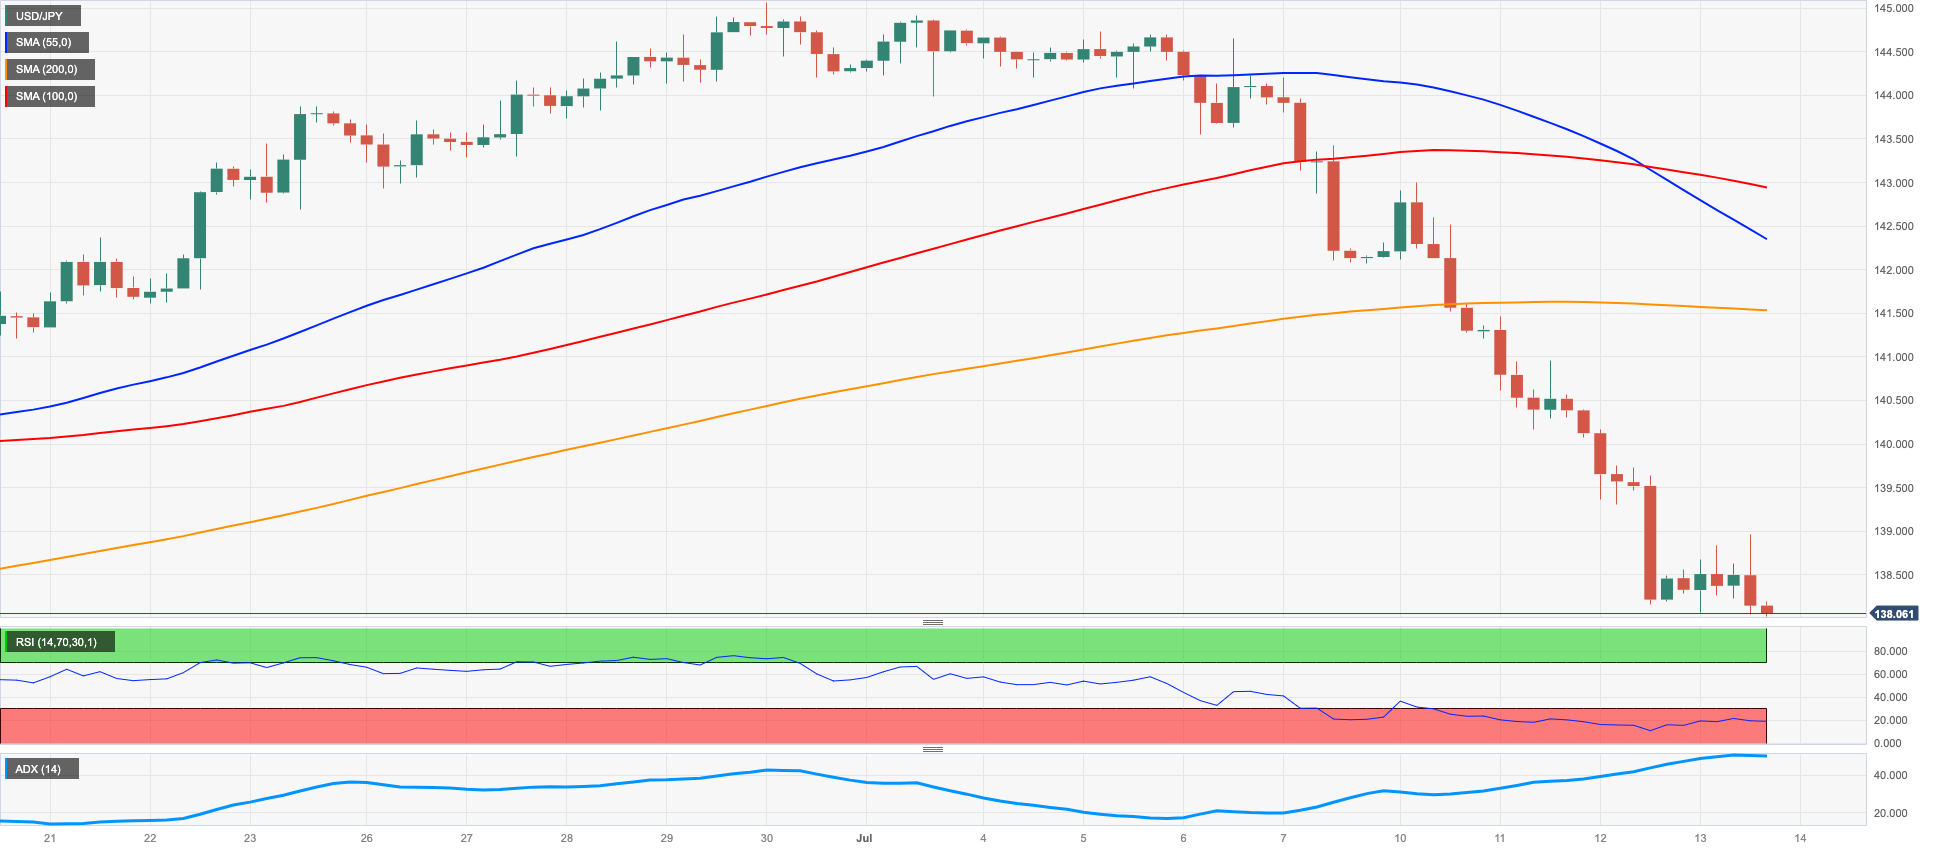
USD/JPY extended the pronounced monthly pullback to the boundaries of the 138.00 neighbourhood, or fresh 2-month lows, in response to the equally acute retracement in the greenback and further weakness in US yields across the curve.
So far this month, the pair has depreciated nearly 5% against the backdrop of omnipresent unease regarding the likelihood of FX intervention by Japanese authorities as well as rising speculation that the Fed might end its hiking cycle in the relatively short-term horizon.
In light of the price action observed in the last couple of weeks, Japan’s Top Currency Diplomat Kanda, mentioned that there is an observation indicating the rapid unwinding of speculative yen short positions. In addition, he added that their team is closely monitoring the movements in the FX market, at the same time that he acknowledged that the market is currently witnessing a decrease in the momentum of yen carry trades.
The Japanese docket showed Foreign Bond Investment shrinking by ¥950.5B in the week to July 8, in what was the sole data release in the Land of the Rising Sun.
Extra losses might force USD/JPY to challenge the crucial 200-day SMA of 137.10, an area that is also underpinned by the provisional 100-day SMA at 136.97. If the pair falls further, the weekly low at 133.01 (April 26), and minor support at 132.01 (April 13) may provide additional support before the April low of 130.62 (April 5) and major support at 130.00. On the upside, the USD/JPY should initially test the 2023 high of 145.07 (June 30), followed by the 2022 high of 151.94 (October 21), and ultimately the round level of 152.00. The day-to-day RSI collapsed to the vicinity of 31.
Resistance levels: 141.49 143.00 144.65 (4H chart)
Support levels: 138.02 137.49 135.64 (4H chart)
GBPUSD
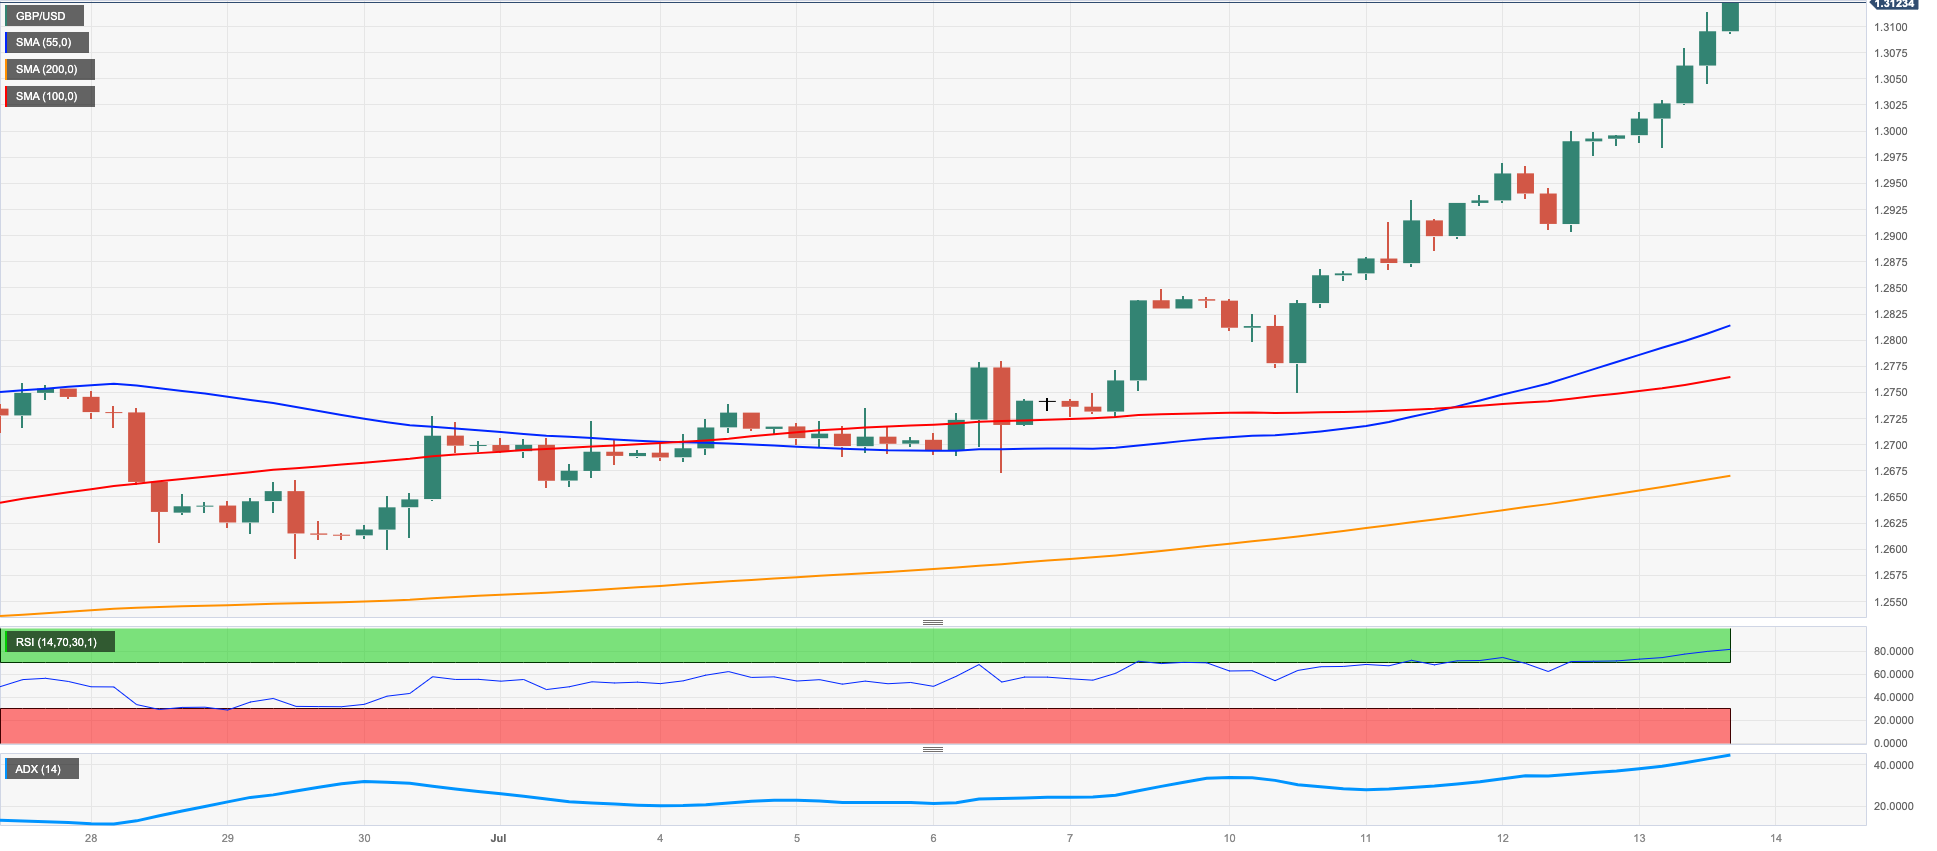
The greenback extended the rout for yet another session on Thursday and bolstered the move higher in GBP/USD past 1.3100 the figure for the first time since April 2022.
By the same token, the USD Index (DXY) plummeted to new lows in the sub-100.00 region. The sharp downtick in the buck was also magnified after US Producer Prices also fell short of estimates for the month of June.
In the domestic macro scenario, expectations of further tightening by the BoE in the second half of the year continue to underpin the strong upside momentum around the quid, with investors pricing in rates peaking beyond the 6.0% threshold.
In the UK, the GDP 3-Month Avg came in flat in May, while the GDP contracted 0.4% in the year to May. Additional data for the month of May saw the trade deficit widen to £6.578B, the Construction Output expand 0.2% YoY, the GDP drop 0.1% MoM, Industrial Production contract at an annualized 2.3% and Manufacturing Production shrink 1.2% over the last twelve months.
The breakout of the 2023 high of 1.3124 (July 12) may prompt GBP/USD to challenge the weekly highs of 1.3146 (April 14, 2022) and 1.3298 (March 23, 2022). The weekly low of 1.2590 (June 29) and the interim 55-day SMA, on the other hand, provides immediate support ahead of the 1.2540 zone, which corresponds to the 2021-2023 trend line. The June low of 1.2368 (June 5), the May low of 1.2308 (May 25), and the April low of 1.2274 (April 3) follow. If the latter is breached, a move to the 200-day SMA at 1.2188 is likely. The daily RSI rose past 78, indicating an extreme overbought condition.
Resistance levels: 1.3124 1.3146 1.3166 (4H chart)
Support levels: 1.2903 1.2750 1.2673 (4H chart)
AUDUSD
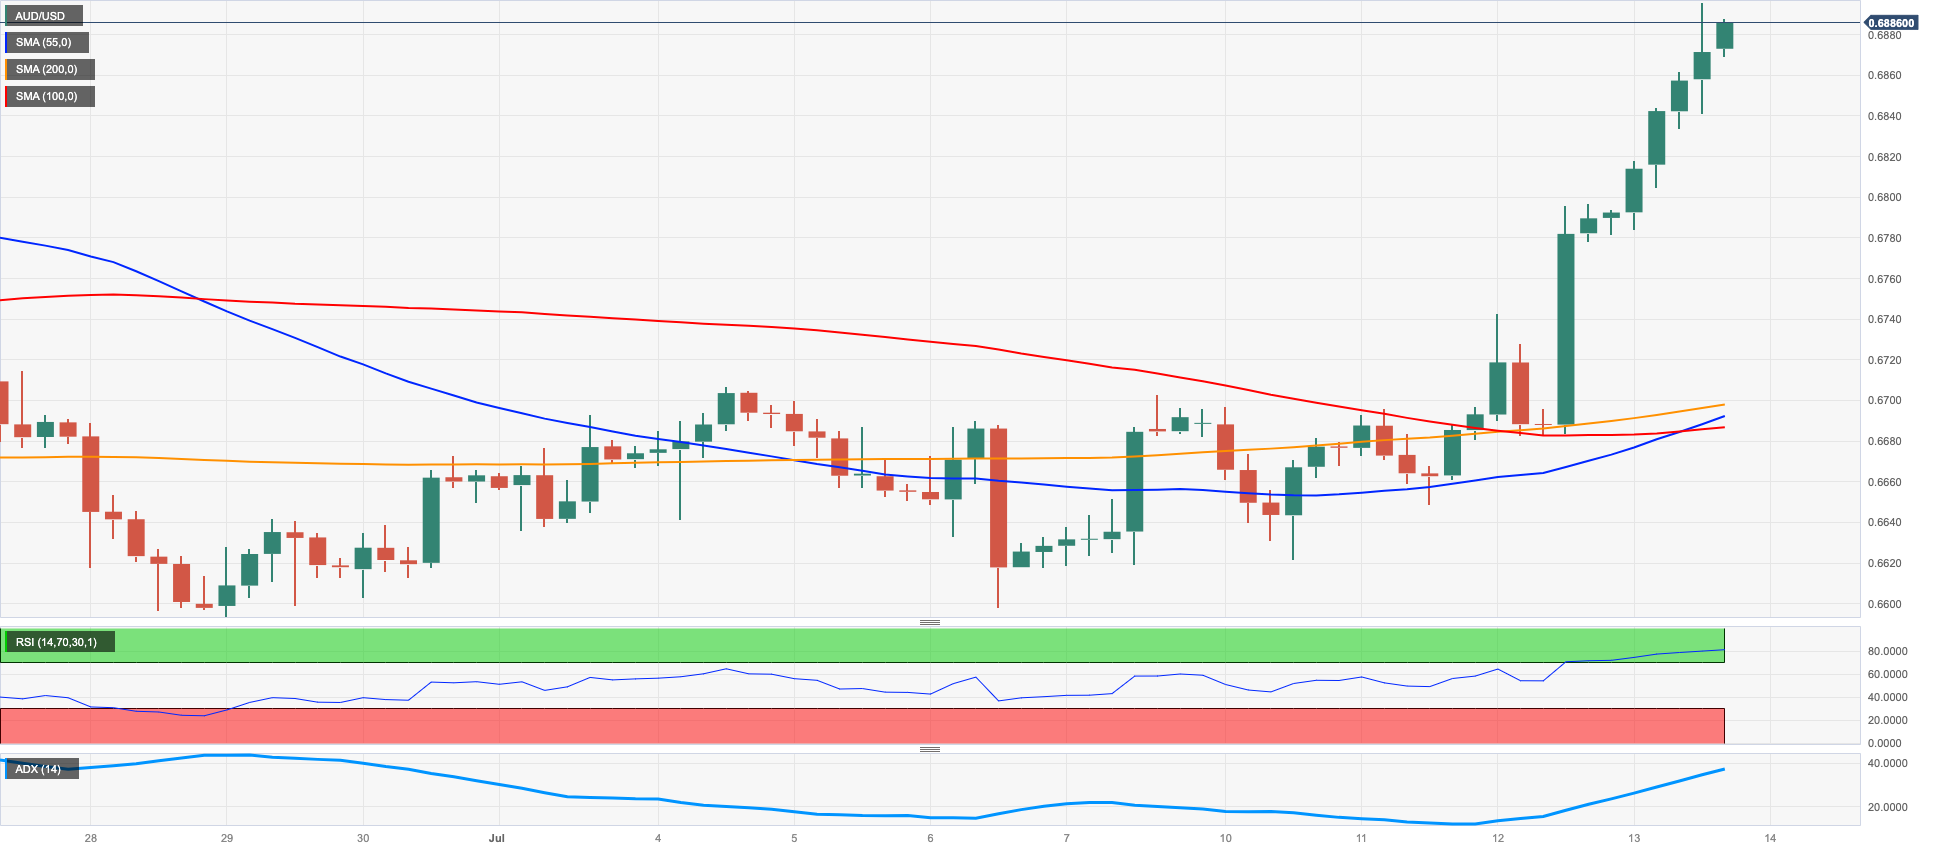
AUD/USD added to the needle-like weekly upside and flirted once again with the 0.6900 region, or 5-month peaks, on Thursday.
In line with the rest of the risk-associated universe, the Aussie dollar regained strong upside traction in response to the meltdown of the greenback, which dragged the USD Index (DXY) back to levels last seen in April 2022 below the key 100.00 support.
The marked recovery in the commodity galaxy also underpinned the bid bias in the pair and helped offset poor prints from the Chinese trade balance readings.
In Oz, Consumer Inflation Expectations surprised to the upside and rose 5.2% in July.
The June high of 0.6899 (June 16) emerges as the immediate hurdle for AUD/USD. Aside from that, the critical 0.7000 level, the weekly high of 0.7029 (February 14), and the 2023 top of 0.7157 (February 2) are all noteworthy milestones to keep an eye on. If the price falls below the weekly low of 0.6595 (June 29), it may fall to the 2023 low of 0.6458 (May 31). The low for November 2022 is 0.6272 (November 3) while the low for October 2022 is 0.6169 (October 13). The daily RSI climbed past the 66 yardstick.
Resistance levels: 0.6894 0.6920 0.7029 (4H chart)
Support levels: 0.6690 0.6599 0.6579 (4H chart)
GOLD
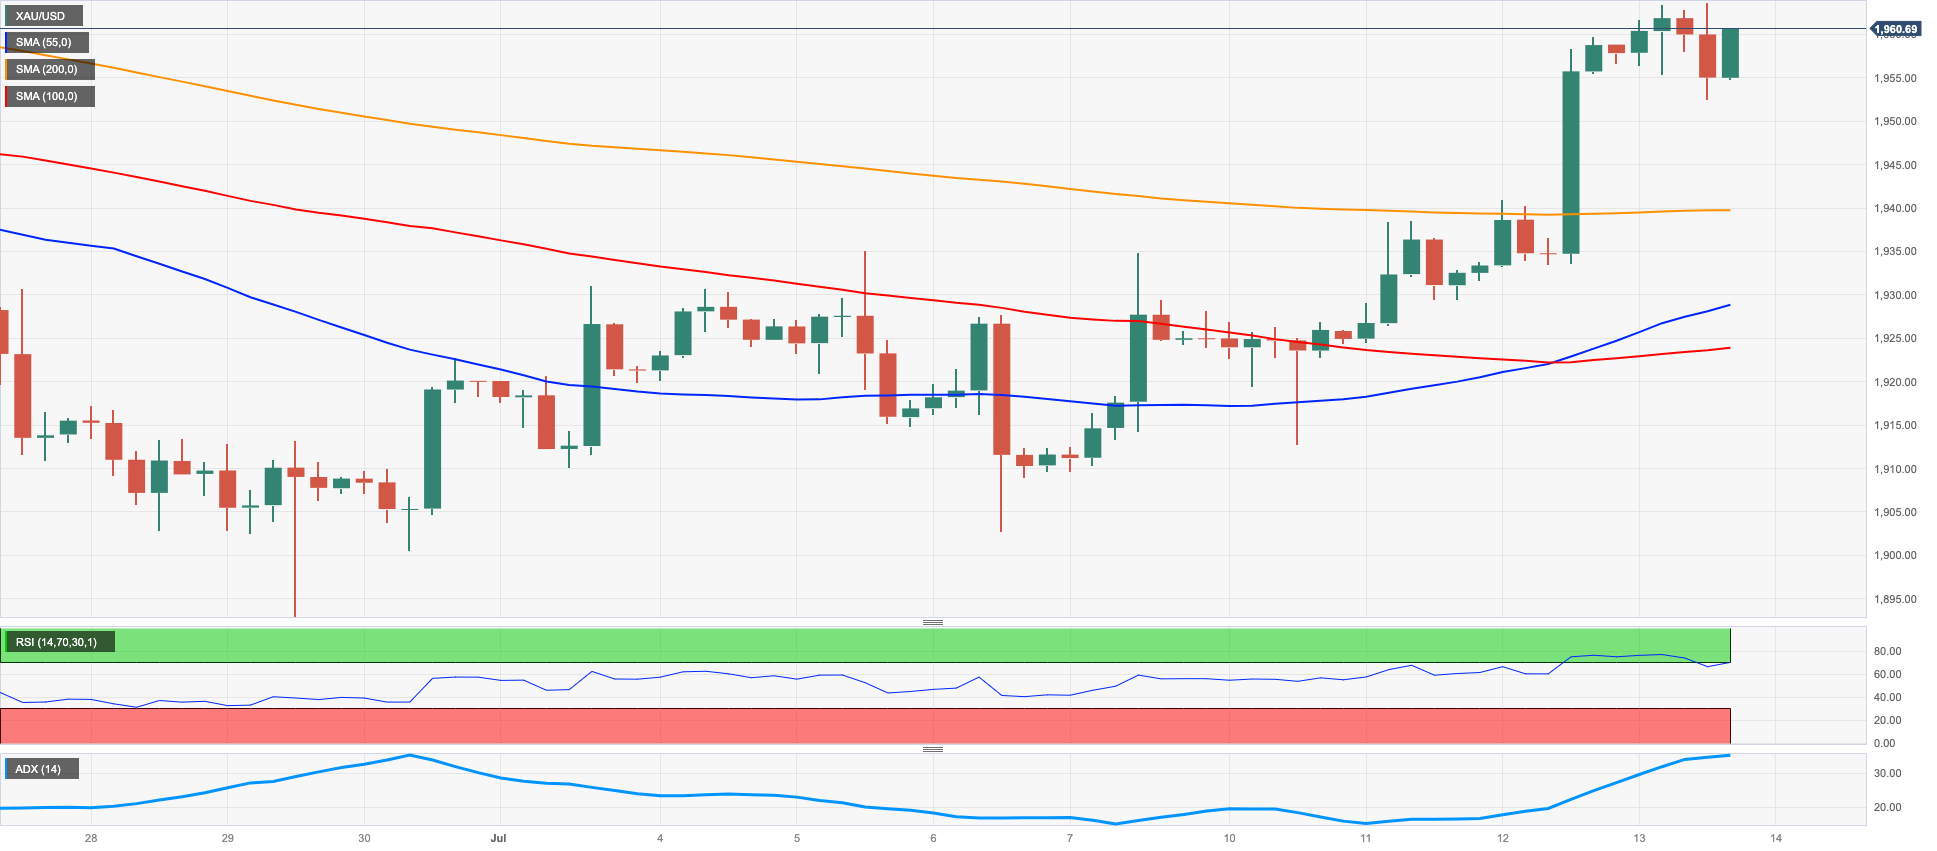
The price of a troy ounce of the yellow metal added to the weekly recovery and advanced marginally beyond the $1960 mark on Thursday.
In the meantime, the small uptick in bullion came somewhat in contrast to the noticeable drop in the greenback to 15-month lows in the sub-100.00 level when gauged by the USD Index (DXY).
Extra gains in the precious metal were also bolstered by a further decline in US yields across the curve, as speculation that the Fed might end its normalization programme in the near term continued to run high.
Gold appears to have broken out of its multi-session consolidation period. However, additional upward now meets an early up-barrier at the July peak at $1963 (July 13), which precedes the June top at $1983 (June 2) and the crucial $2000 goal. There will be no strong northward resistance until the 2023 high of $2067 (May 4), which follows the 2022 top of $2070 (March 8) and before the all-time high of $2075 (August 7 2020). Instead, immediate support is at the June low of $1893 (June 29), before moving to the major 200-day SMA at $1870 and the 2023 low of $1804 (February 28), both of which are ahead of the critical $1800 barrier.
Resistance levels: $1963 $1968 $1983 (4H chart)
Support levels: $1939 $1912 $1893 (4H chart)
CRUDE WTI
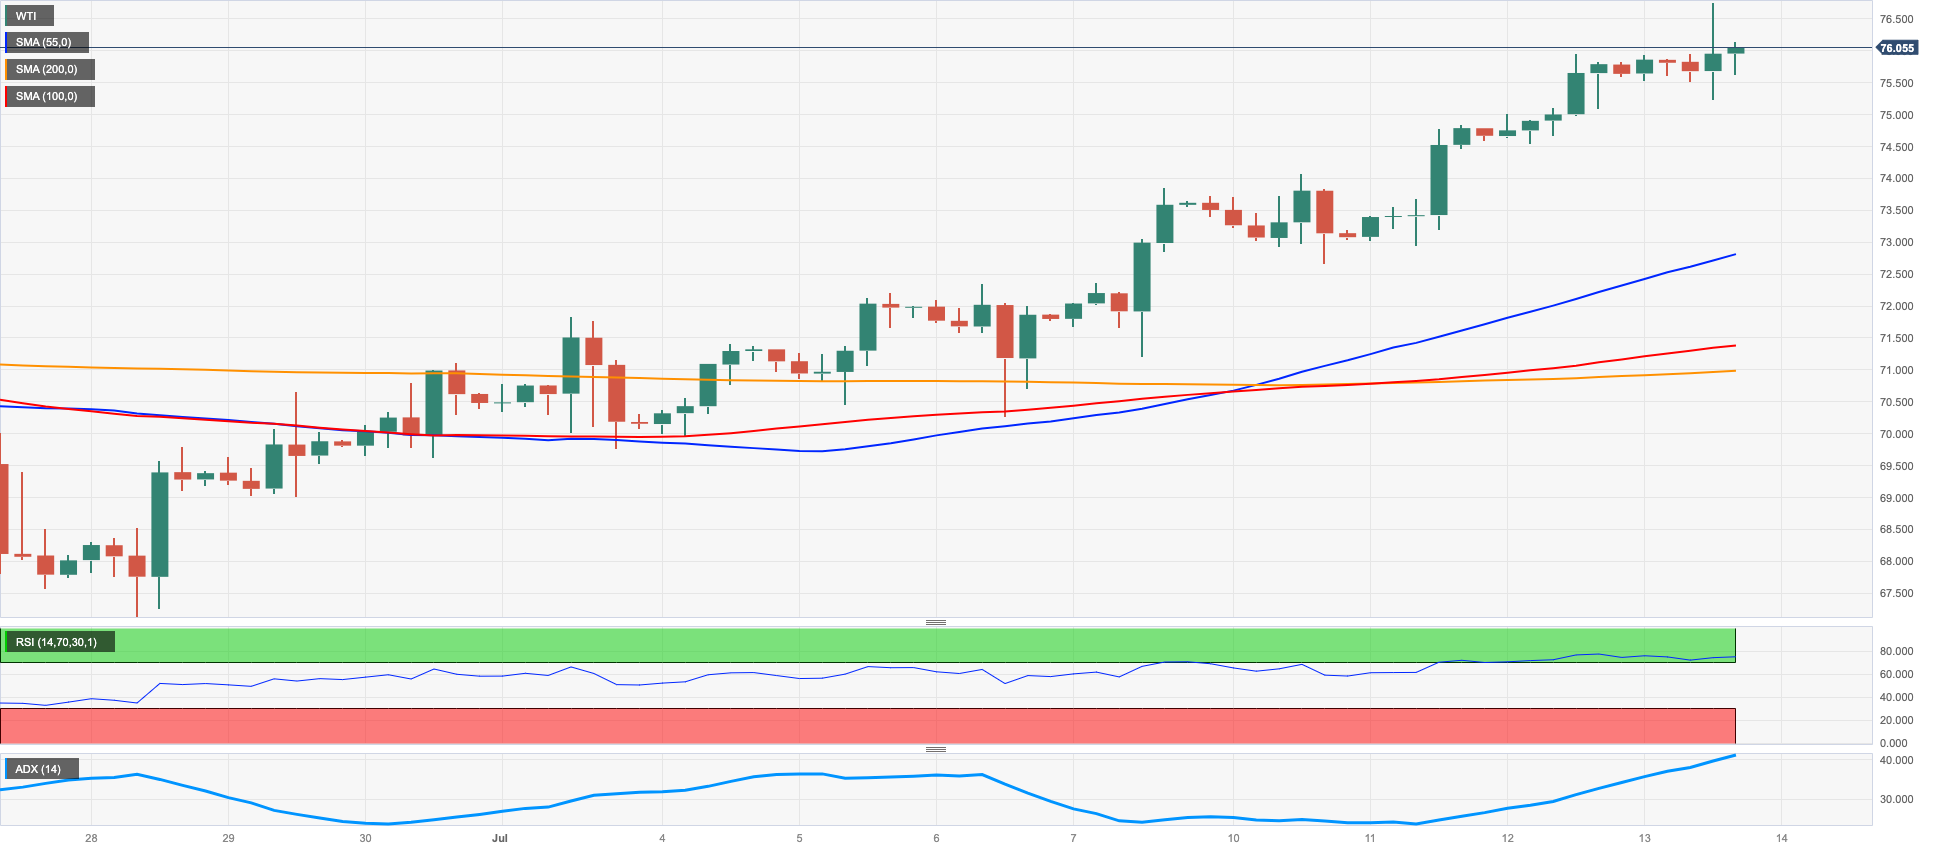
In line with the rest of the commodity complex, prices of the West Texas Intermediate (WTI) advanced further and clinched new multi-week tops near the key $77.00 mark per barrel on Thursday.
The fierce drop in the greenback sustained important gains in USD-denominated assets, while expectations that the Fed’s tightening campaign might nearing its end also boosted the mood among traders and helped bypass a mixed tone from the IEA’s report.
On the latter, the agency predicted that global oil demand will increase by 2.2 mbpd in 2023 to reach a record high of 102.1 mbpd. The report also forecasts that demand growth in 2024 is expected to slow to 1.1 mbpd, as vehicle electrification and greater efficiency take hold. Furthermore, the report highlighted that China's economic recovery is losing steam after a strong start to the year.
WTI must now break over the July high of $76.86 (July 13) to challenge the important 200-day SMA of $77.21 ahead of the weekly top of $79.14 (April 24). The latter might burst beyond the important $80.00 per barrel barrier, which is supported by the 2023 peak of $83.49 (April 12) and the November 2022 top of $93.73 (November 7). Just the opposite, immediate contention emerges at the intermediary 100-day and 55-day SMAs of $73.52 and $71.48, respectively, prior to the June low of $66.86 (June 13), the 2023 low of $63.61 (May 4), the December 2021 low of $62.46 (December 2), and the critical level of $60.00 per barrel.
Resistance levels: $76.11 $76.89 $79.14 (4H chart)
Support levels: $72.64 $70.82 $67.01 (4H chart)
GER40
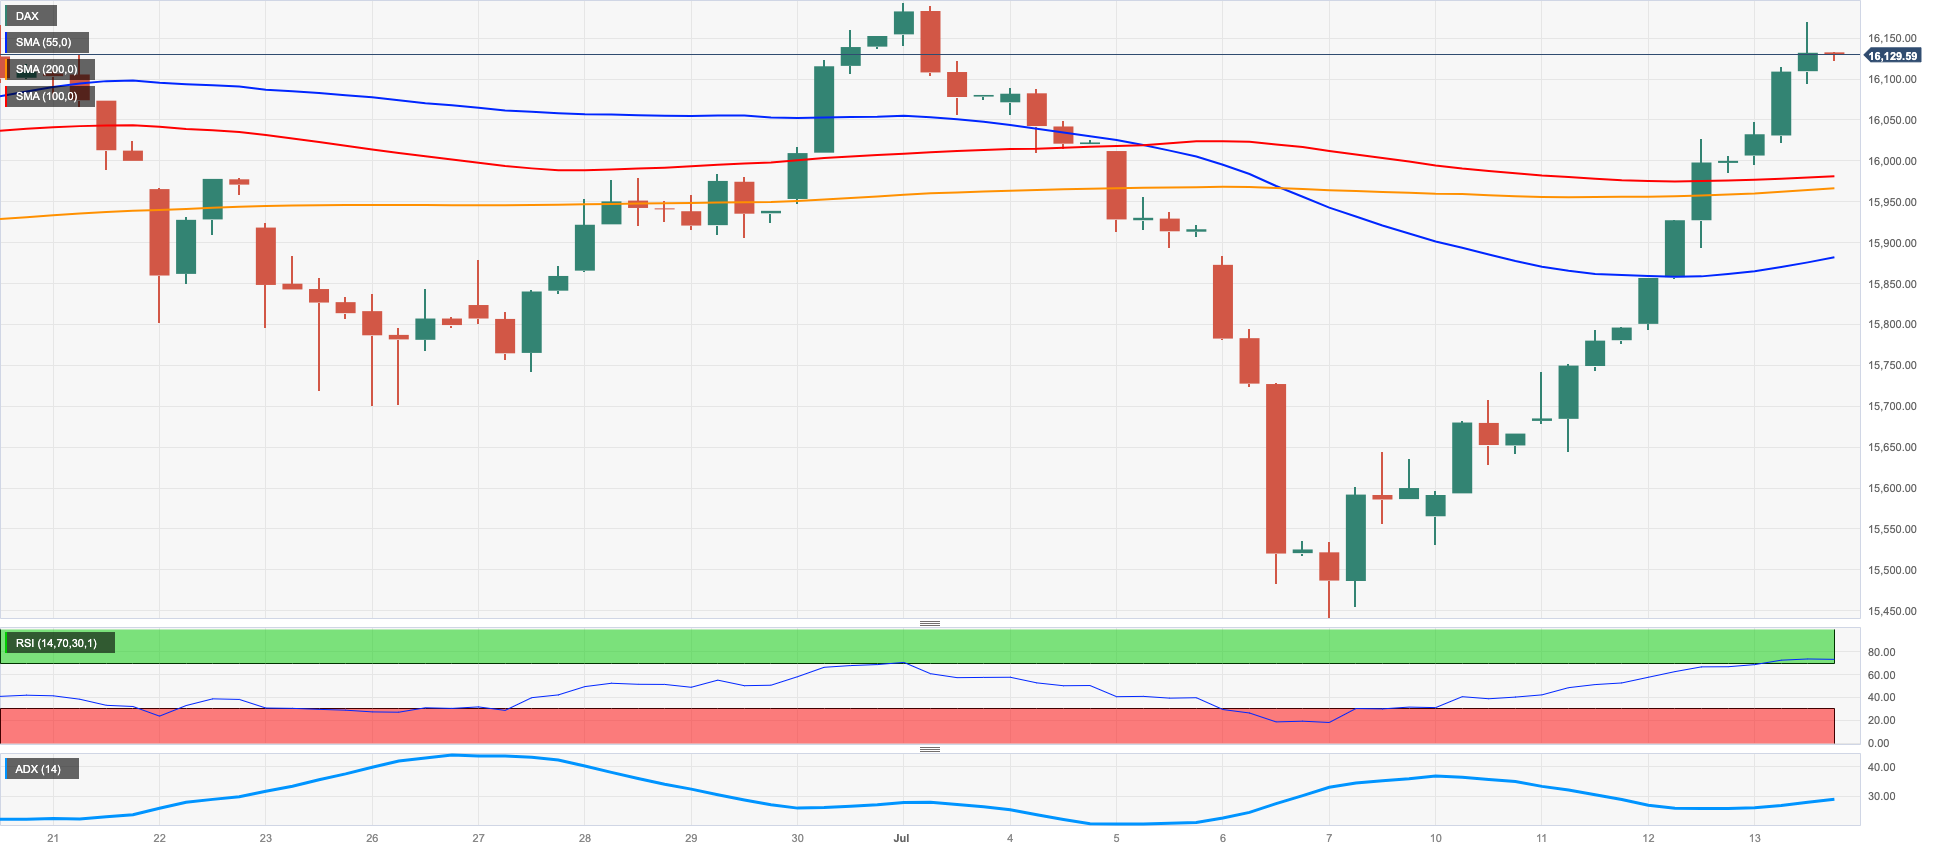
The DAX40, which tracks German stocks, rose for the fifth session in a row on Thursday, this time bolstered by broad-based optimism in the global markets.
Indeed, lower-than-expected US inflation figures during the last month underpinned the recovery in the index and reignited market chatter that the Fed’s normalization process could be ending soon.
The daily uptick in the index also came on the back of another negative session in the German 10-year Bund yields, which this time dropped further to the 2.45% region (from Monday’s tops near 2.70%).
In the docket, Germany’s Current Account surplus shrank to €8.9B in May (from €22.4B).
The DAX40's recovery is expected to hit a weekly high of 16209 (July 3) before reaching an all-time top of 16427 (June 16). In comparison, initial support is at the July low of 15456 (July 7), which is above the 200-day SMA at 14949 and the weekly low of 14458 (March 20). Dropping below the latter allows for a slide to the December 2022 low of 13791 (December 20). The daily RSI advanced further and approached 57.
Best Performers: Commerzbank, Infineon, SAP
Worst Performers: Daimler Truck Holding, BASF, Merck
Resistance levels: 16185 16209 16427 (4H chart)
Support levels: 15456 14809 14458 (4H chart)
NASDAQ
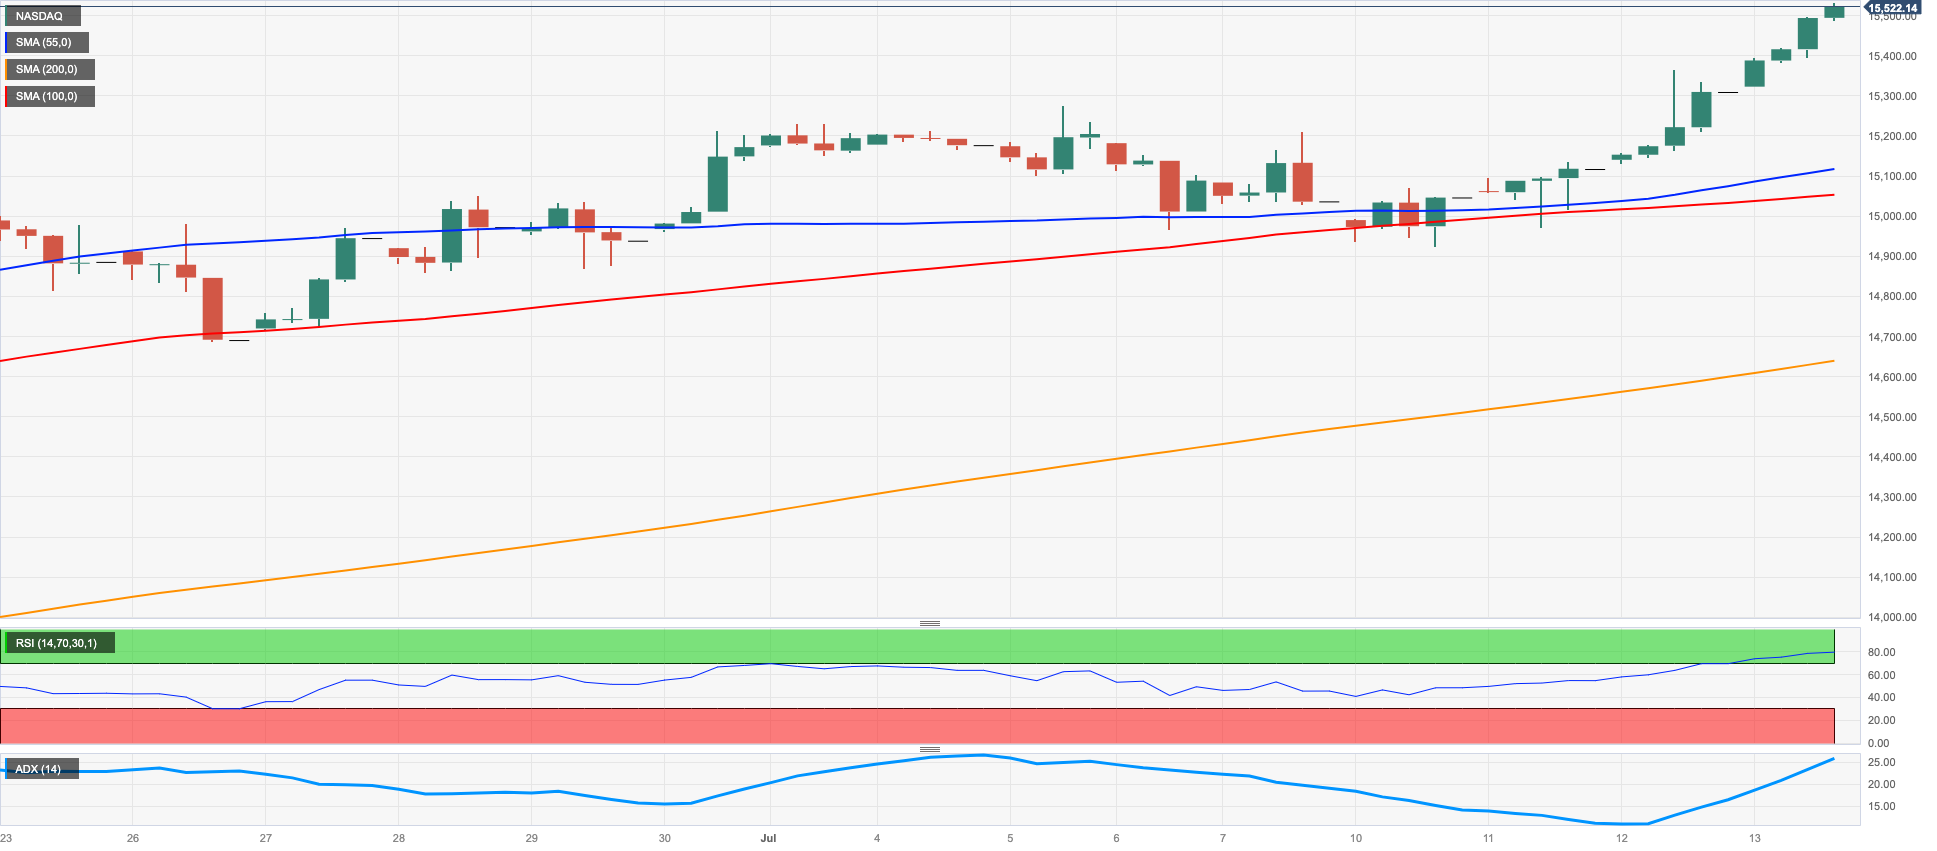
Tech equities measured by the Nasdaq 100 rose to new 2023 peaks past the 15500 level on Thursday, keeping the weekly rebound well in place for the fourth session in a row.
The deep pullback in the greenback to multi-month lows in combination with declining US yields across the curve bolstered the mood in the US tech sector, while hopes that the July’s rate hike by the Fed might be the last one also contributed to the strong momentum.
The breakout of the 2023 high of 15532 (July 13) should motivated the Nasdaq 100 to challenge the round milestone of 16000. On the other hand, immediate support is found near the weekly lows of 14687 (June 26) and 14283 (June 7), as well as the interim 55-day SMA at 14230 and another weekly low of 13520 (May 24). A further loss may push the price below the May low of 12938 (May 4), the April low of 12724 (April 25), the 200-day SMA of 12478, and the March low of 11695 (March 13). The daily RSI trespassed the 70 threshold and entered the overbought land.
Top Gainers: PDD Holdings DRC, Zscaler, Alphabet A
Top Losers: Fastenal, Walgreen Boots, Illumina
Resistance levels: 15532 16017 16607 (4H chart)
Support levels: 14924 14687 14283 (4H chart)
DOW JONES
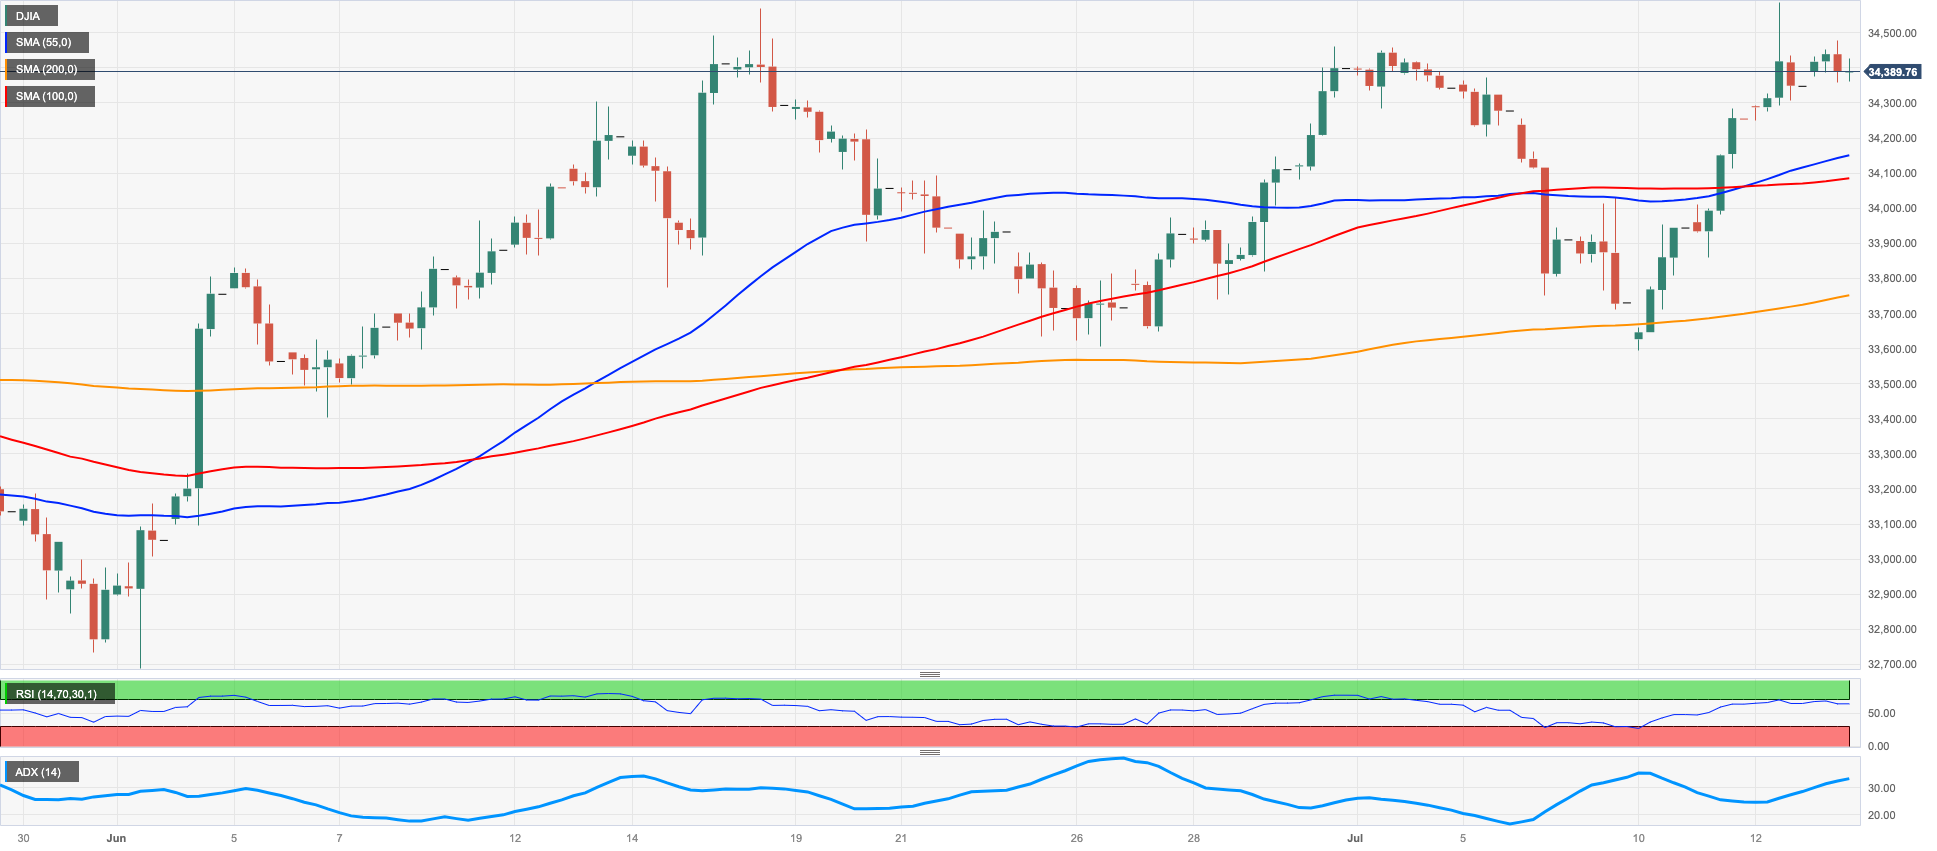
The generalized improvement in investors’ sentiment motivated equities tracked by the Dow Jones to clinch their fourth consecutive session with gains on Thursday.
The uptrend in the US reference index remained well and sound and was bolstered further after US Producer Prices rose less than initially estimated in June, which in turn underpinned speculation that the Fed might be done hiking rates, despite the 25 bps rate raise already priced in on July 26.
All in all, the Dow Jones rose 0.16% to 34401, the S&P500 gained 0.66% to 4501, and the tech-reference Nasdaq Composite climbed 1.37% to 14108.
The Dow Jones continues to initially target the 2023 high of 34588 (June 16). If the latter is surpassed, a test of the December 2022 top of 34712 (December 13) might be on the horizon ahead of the April 2022 peak of 35492 (April 21). On the contrary, the weekly low of 33610 (June 26) is projected to provide early support before the provisional 100-day SMA of 33378 and the crucial 200-day SMA of 33058. Lower levels of support from here include the May low of 32586 (May 25), the 2023 low of 31429 (March 15), and the 2022 low of 28660 (October 13). The RSI for the day rose past the 59 mark.
Top Performers: Cisco, Salesforce Inc, Microsoft
Worst Performers: Walgreen Boots, Chevron, Travelers
Resistance levels: 34588 34712 35492 (4H chart)
Support levels: 33705 33371 32586 (4H chart)
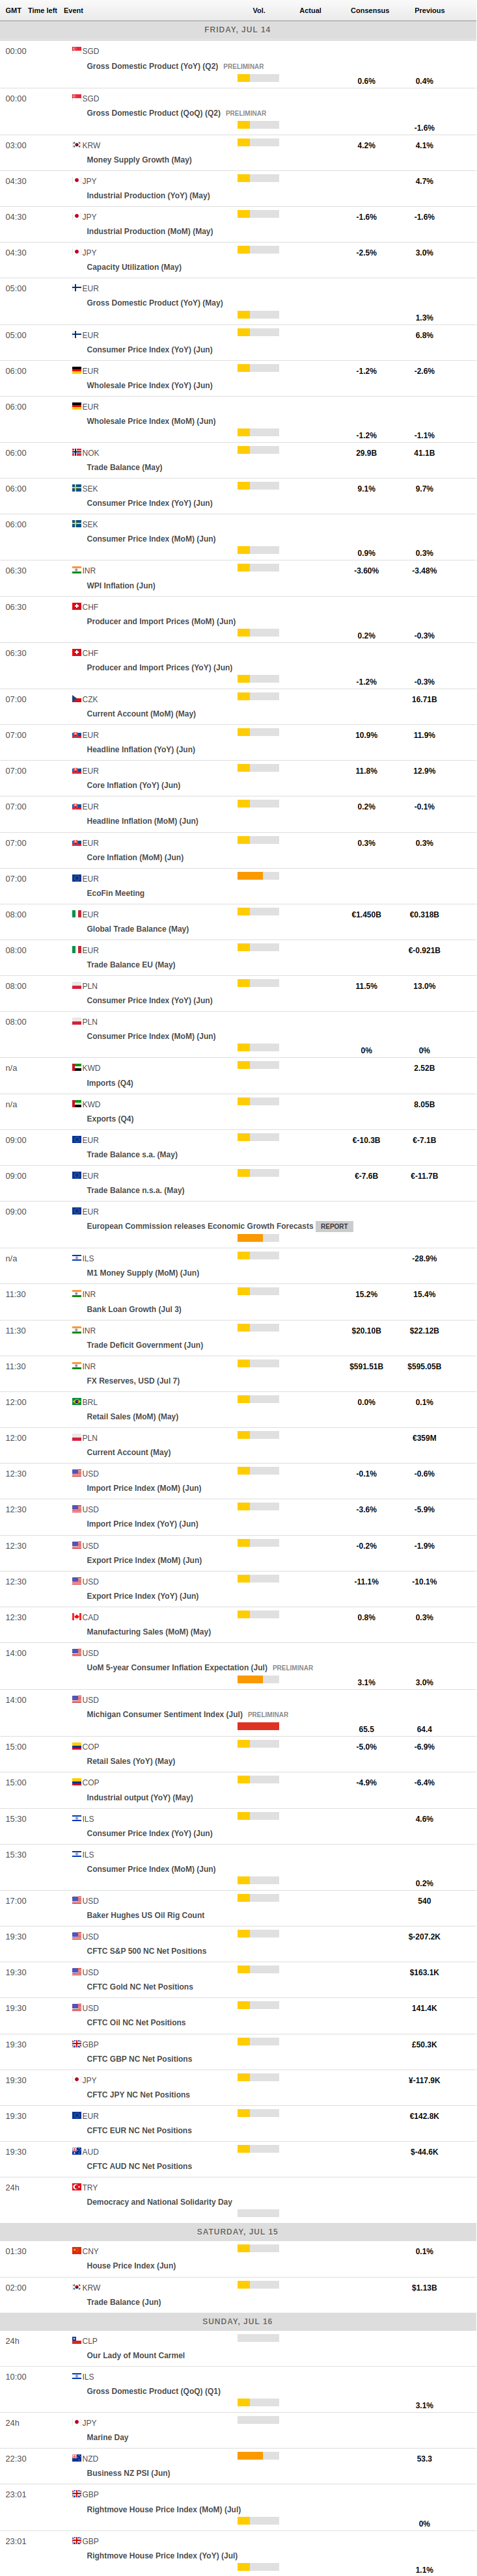
MACROECONOMIC EVENTS
All Information & Updates provided by:

All information relating to the financial markets available on this page has been prepared and issued by FXStreet (Forexstreet SL, Spain, Reg: B62498233) on the basis of publicly available information and all information believed to be reliable and does not conflict with Kuwaiti local laws, and all necessary care has been taken to before the company to ensure that the facts mentioned are correct from the source.
NCM Investment nor any of its directors or employees shall in any way be held responsible for the contents of this news, and the information contained on this page is intended only to provide clients with publicly available information and should not be construed as investment advice, report or analysis and/or constitute an offer or invitation to buy or sell financial instruments of any kind.
RISK WARNING: Forex and CFDs are highly risky leveraged products, as losses can exceed deposits. Please ensure you understand all the risks and take independent advice if necessary. NCM will segregate the clients based on the criteria of the regulator and its bylaws. NCM does not provide any advisory service; the material published does not constitute advice or a recommendation for a transaction in any financial instrument. NCM accepts no responsibility for any use of the content presented and any consequences of that use. Anyone acting on the information provided does so at their own risk.