
- Contact Us:
-

-

-

-


Daily Market Updates
17 Jul 2023
USDJPY
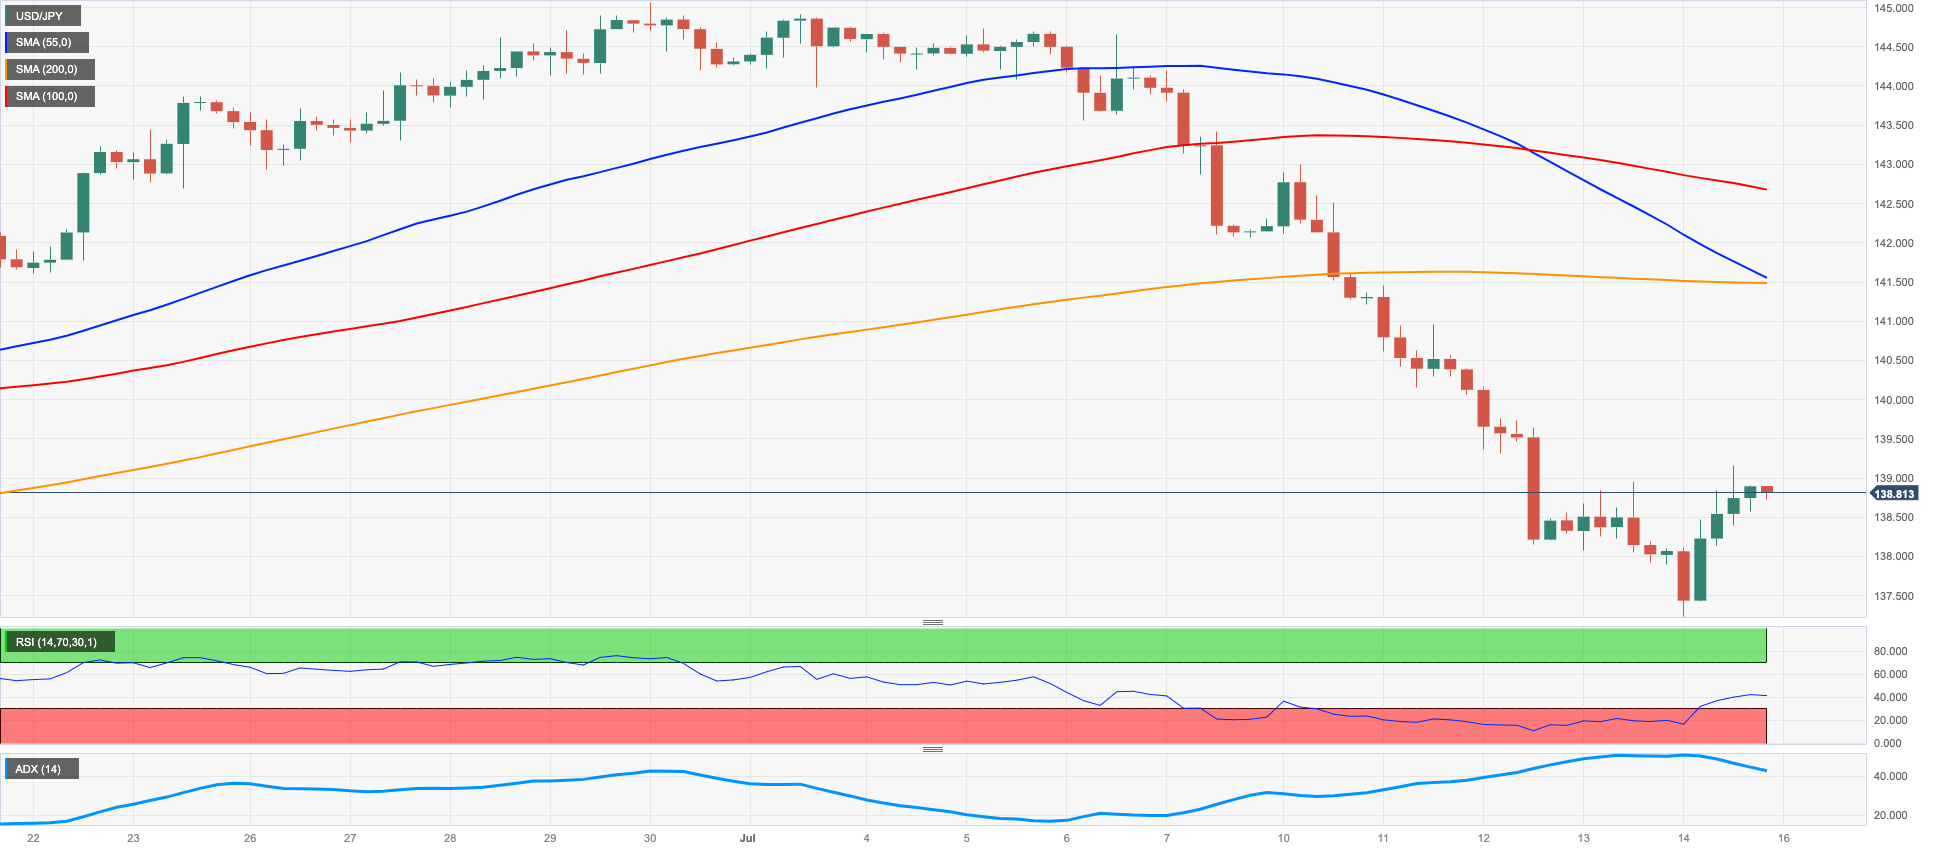
After several days of decline, USD/JPY finally experienced a much-needed break and rose significantly on Friday, bouncing back from new 2-month lows near 137.20, an area also coincident with the critical 200-day SMA.
This increase was accompanied by a slight bullish move in the US dollar and a moderate rebound in US yields across the board, in contrast to the rise in JGB 10-year yields.
Furthermore, the recent uptick in domestic yields was likely due to speculation in the markets that the BoJ might make changes to the current Yield Curve Control (YCC) program at its upcoming event on July 27-28, along with revisions to the inflation forecasts.
In Japan, the final figures showed that Industrial Production rose by 4.2% YoY in May, a significant improvement from the previous -0.7% YoY figure.
Extra losses may cause USD/JPY to test the critical 200-day SMA of 137.07, which is also supported by the transitory 100-day SMA of 137.00. If the pair continues to decline, the weekly low of 133.01 (April 26) and minor support of 132.01 (April 13) may give additional support before the April low of 130.62 (April 5) and major support of 130.00. On the upside, the USD/JPY should first challenge the 2023 high of 145.07 (June 30) ahead of the 2022 peak of 151.94 (October 21) and finally the round level of 152.00. The day-to-day RSI leapt past 38.
Resistance levels: 139.14 141.43 143.00 (4H chart)
Support levels: 137.49 137.23 133.74 (4H chart)
GBPUSD
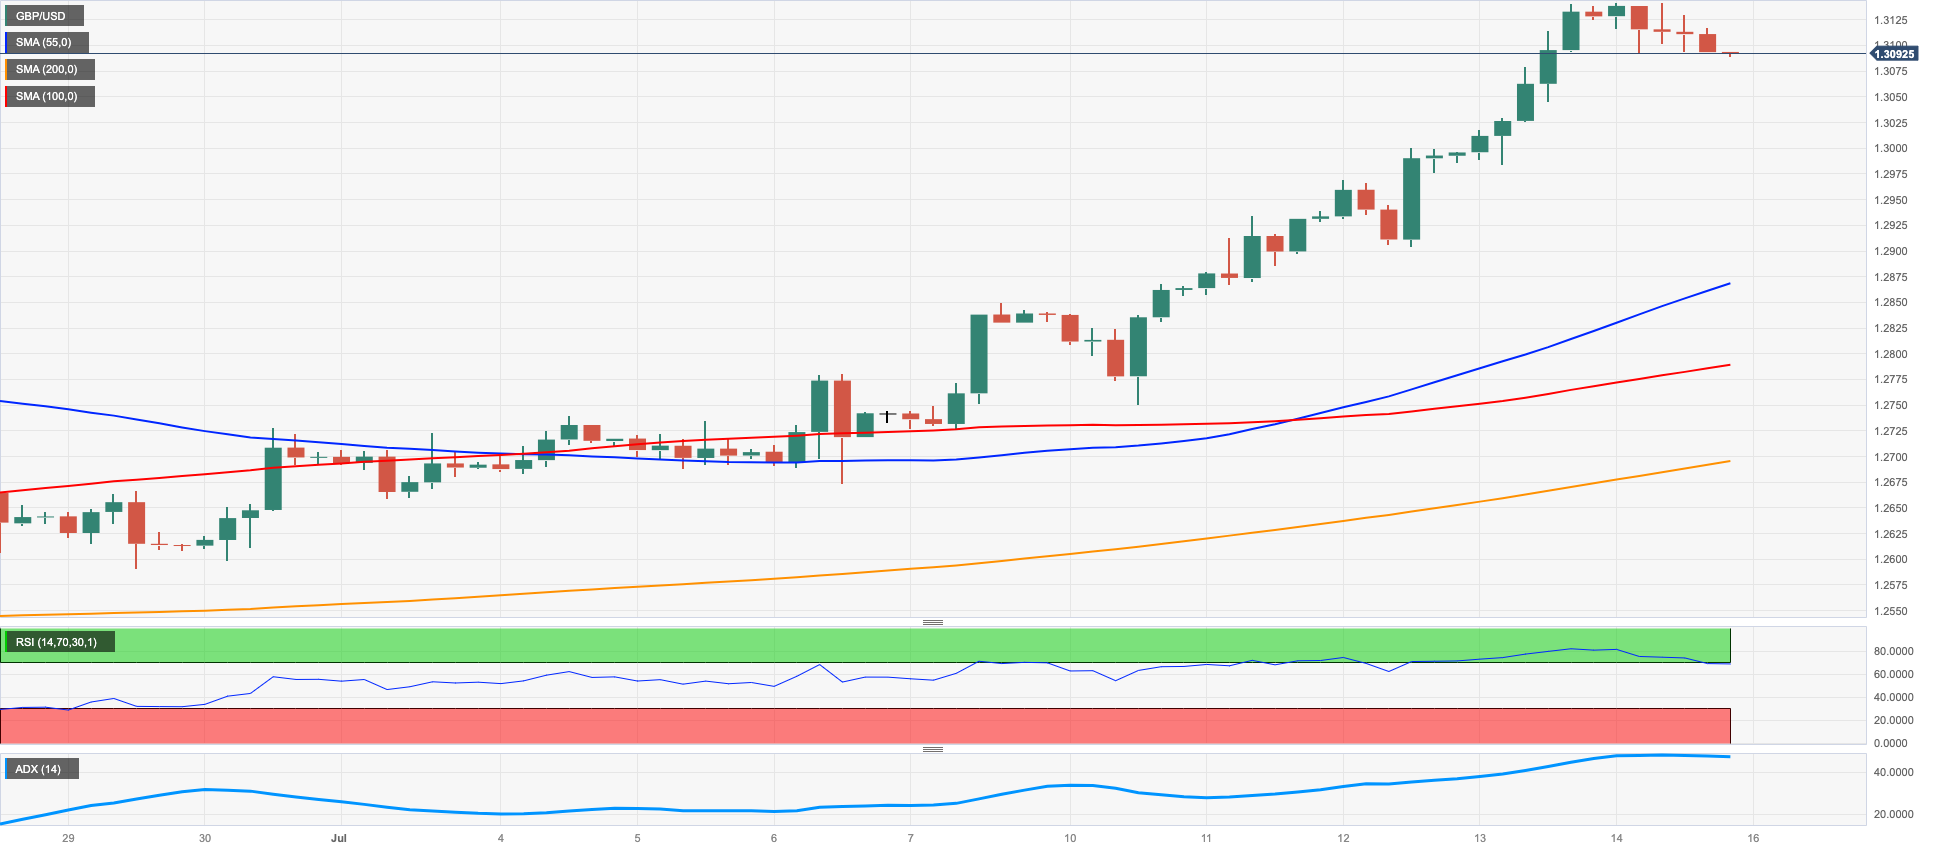
The greenback attempted to recover slightly, causing GBP/USD to give up some of its recent strong gains. However, the pair still managed to reach a new 2023 high in the 1.3140/45 band at the end of the week.
Cable has now ended a 6-day winning streak and is up more than 3% since the start of the month.
The pound's strong performance is being driven by growing speculation that the BoE will continue to tighten monetary policy beyond the summer, in light of elevated inflation and a tight labor market. This stands in contrast to the view that the Fed may be nearing the end of its rate-hiking cycle.
If the 2023 high of 1.3142 (July 14) is broken, GBP/USD may attempt the weekly highs of 1.3146 (April 14, 2022) and 1.3298 (March 23, 2022). On the flip side, the transitory 55-day SMA at 1.2611 and the weekly low of 1.2590 (June 29) provide immediate support ahead of the 1.2540 zone, which corresponds to the 2021-2023 trend line. Following that is the June low of 1.2368 (June 5), the May low of 1.2308 (May 25), and the April low of 1.2274 (April 3). If the latter is violated, the price is expected to head to the 200-day SMA around 1.2198. The daily RSI stayed above 74, suggesting that the market remained extremely overbought.
Resistance levels: 1.3142 1.3146 1.3166 (4H chart)
Support levels: 1.2903 1.2750 1.2680 (4H chart)
AUDUSD
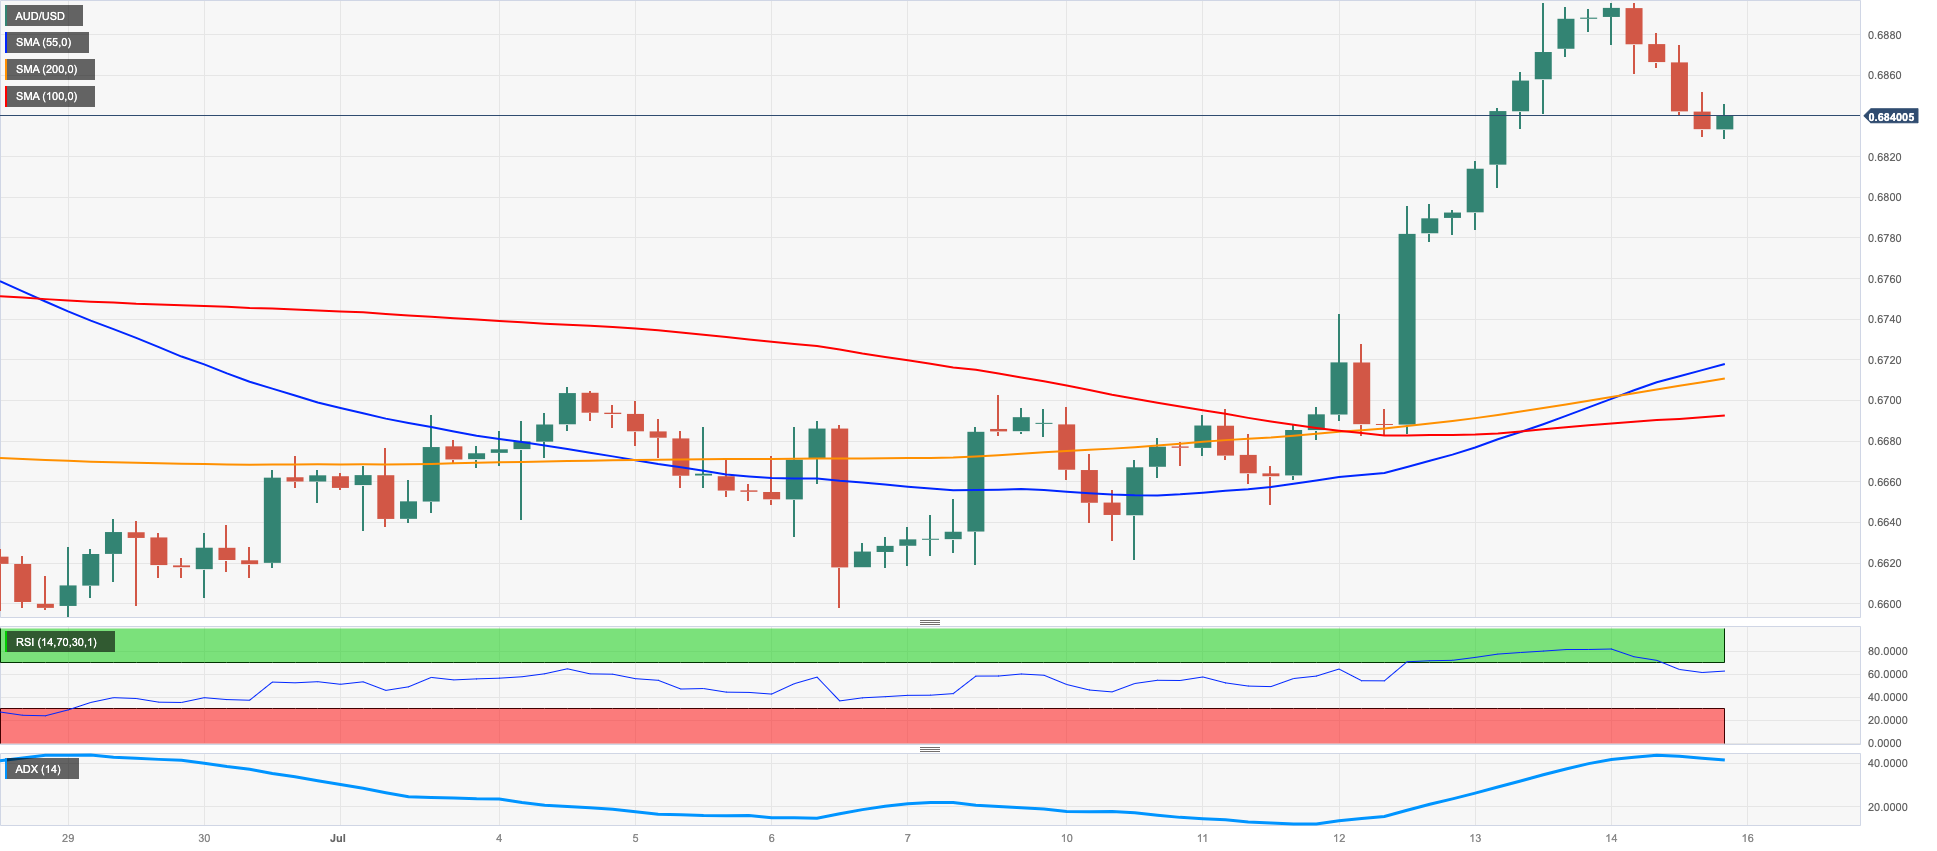
AUD/USD failed to maintain its upward movement towards the 0.6900 level and eventually gave in to the limited recovery of the US dollar at the end of the week.
Nevertheless, despite the daily setback, the pair managed to secure a second consecutive week of gains, benefiting from the weakening greenback as expectations grew that the Federal Reserve's tightening cycle could come to an end sooner rather than later.
Additionally, the slight correction in the commodity universe also negatively affected the sentiment surrounding the Aussie dollar towards the end of the week.
Although there were no data releases in Australia, Treasurer Chalmers announced the appointment of Deputy Governor M. Bullock as the successor to P. Lowe, who will take over as the head of the Reserve Bank of Australia from September 18.
The immediate obstacle for AUD/USD is the June high of 0.6899 (June 16). Aside from that, the important 0.7000 level, the weekly high of 0.7029 (February 14), and the 2023 high of 0.7157 (February 2) are also significant milestones to watch. If the price goes below the critical 200-day SMA at 0.6704, it could then revisit the weekly low of 0.6595 (June 29) ahead of the 2023 low of 0.6458 (May 31). The November 2022 low is 0.6272 (November 3), while the 2022 low is 0.6169 (October 13). The daily RSI eased to the sub-61 region.
Resistance levels: 0.6894 0.6920 0.7029 (4H chart)
Support levels: 0.6700 0.6599 0.6579 (4H chart)
GOLD
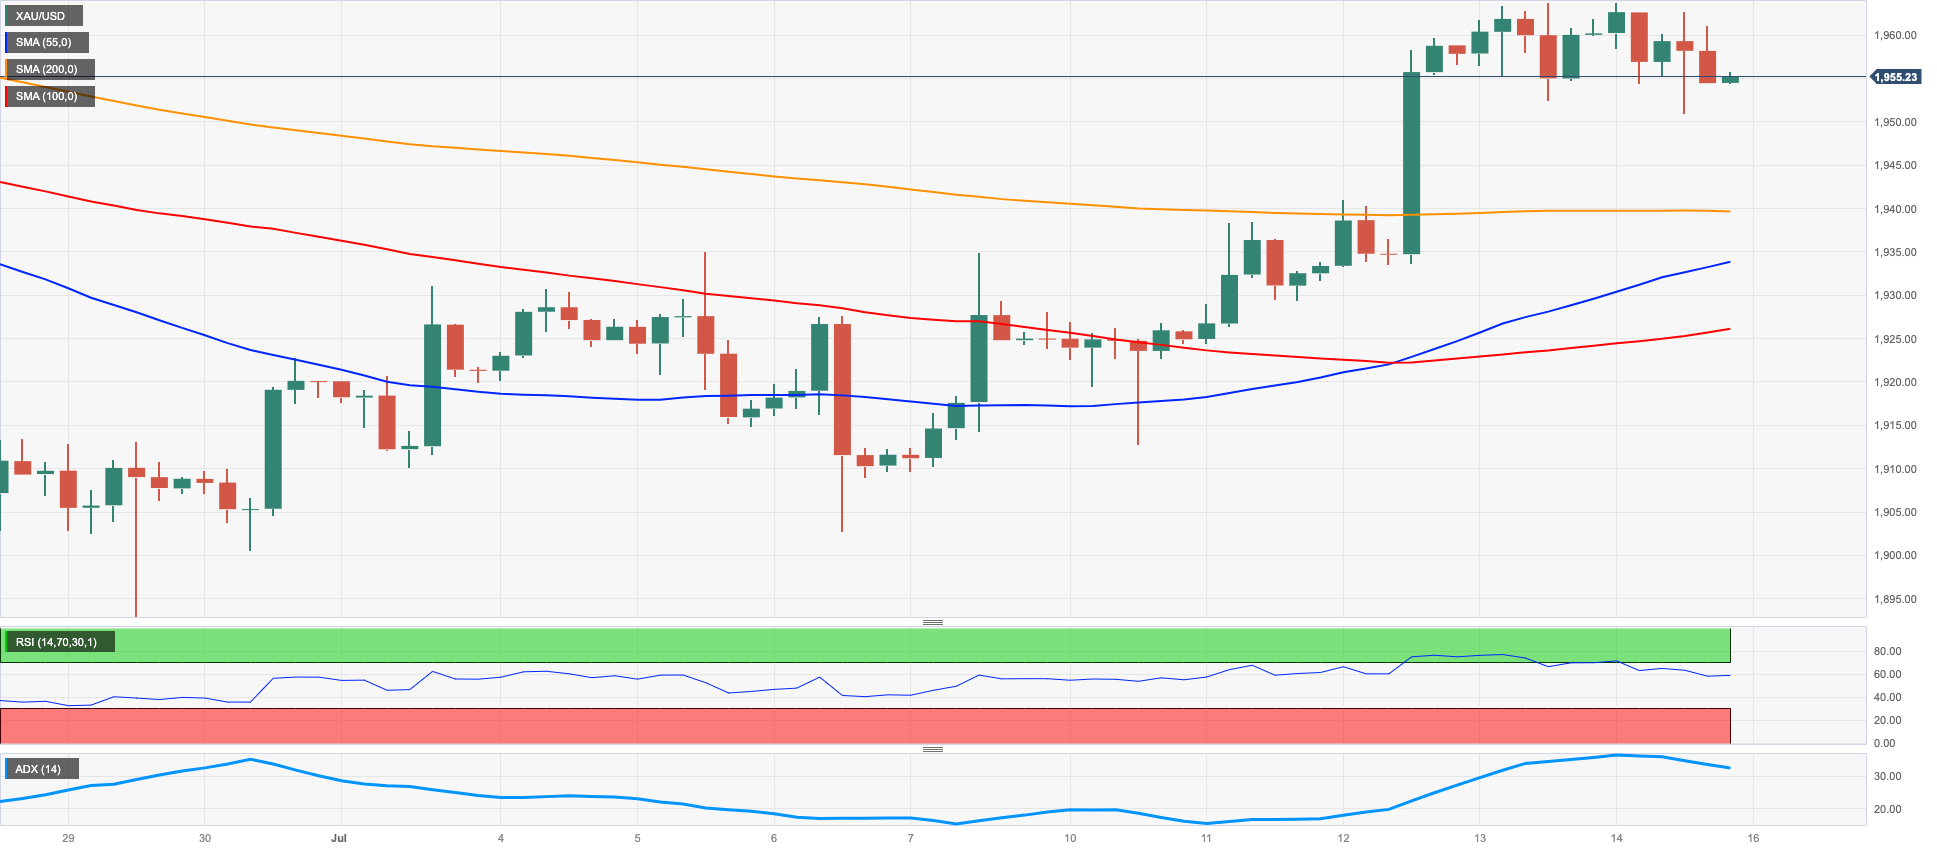
Gold prices remained within a familiar range and fell slightly on the back of a mild rebound in the dollar at the end of the week.
In fact, the precious metal closed its first session in the red after three consecutive daily gains, although it managed to stay close to Thursday's 4-week highs near $1,965 per troy ounce.
Adding to the selling pressure on the yellow metal was the reversal in US yields across the curve, which regained some ground after several sessions of losses.
Looking ahead, bullion will closely track developments from the Federal Reserve amid growing market chatter that the upcoming rate hike in July could be the last one of the ongoing tightening campaign.
Gold looks to have emerged from its multi-session consolidation phase. Additional upward movement now encounters an early up-barrier at the July peak of $1963 (July 13), which precedes the June high of $1983 (June 2) and the key $2000 target. There will be no significant northward resistance until the 2023 top of $2067 (May 4), which comes after the 2022 peak of $2070 (March 8) and before the all-time high of $2075 (August 7, 2020). Instead, immediate support is at the June low of $1893 (June 29), followed by the significant 200-day SMA at $1871 and the 2023 low of $1804 (February 28), all of which are above the important $1800 level.
Resistance levels: $1963 $1968 $1983 (4H chart)
Support levels: $1940 $1912 $1893 (4H chart)
CRUDE WTI
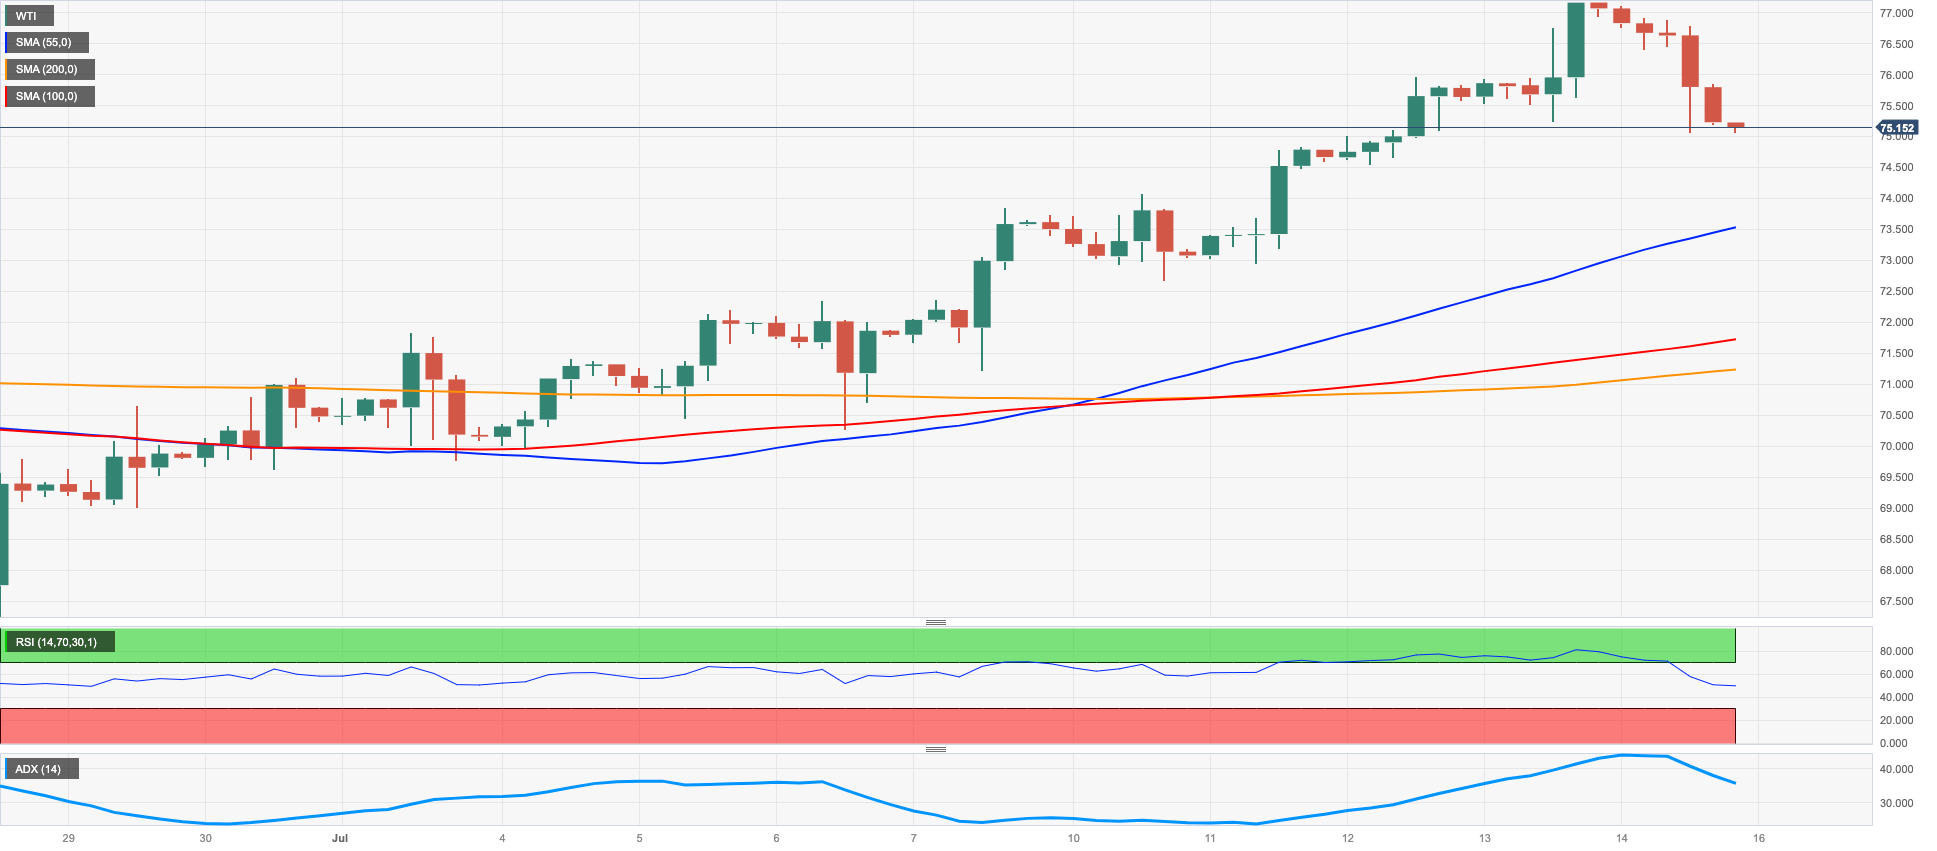
For the first time after three straight days of gains, prices of West Texas Intermediate (WTI) experienced a decline. This occurred after the prices had neared the $77.00 per barrel mark on Friday, a level that aligns with the significant 200-day SMA.
Despite this daily downturn, the American reference price for sweet light crude oil managed to close a third successive week on a positive note, following a rebound from the crucial 200-week SMA around the $67.00 mark observed in late June.
The sentiment of traders at the week's conclusion appeared to be influenced by worries about demand, a resurgent dollar, and a mood favouring profit-taking, all of which contributed to the lowering of prices.
Nevertheless, the drop in commodity prices on Friday was somewhat tempered by reports indicating a decrease in Russian oil exports and supply interruptions in Libya and Nigeria.
Regarding industry news, oilfield services firm Baker Hughes reported that the total number of active oil rigs in the US decreased by 3 to 537 for the week ending on July 14.
WTI must now break above the July high of $77.30 (July 13) in order to challenge the weekly top of $79.14 (April 24). The latter might break beyond the crucial $80.00 per barrel barrier, which is supported by the 2023 peak of $83.49 (April 12) and the November 2022 top of $93.73 (November 7). Immediate support appears at the provisional 100-day and 55-day SMAs of $73.55 and $71.52, respectively, prior to the June low of $66.86 (June 13), the 2023 low of $63.61 (May 4), the December 2021 low of $62.46 (December 2), and the key level of $60.00 per barrel.
Resistance levels: $77.26 $79.14 $81.52 (4H chart)
Support levels: $75.16 $72.64 $70.18 (4H chart)
GER40
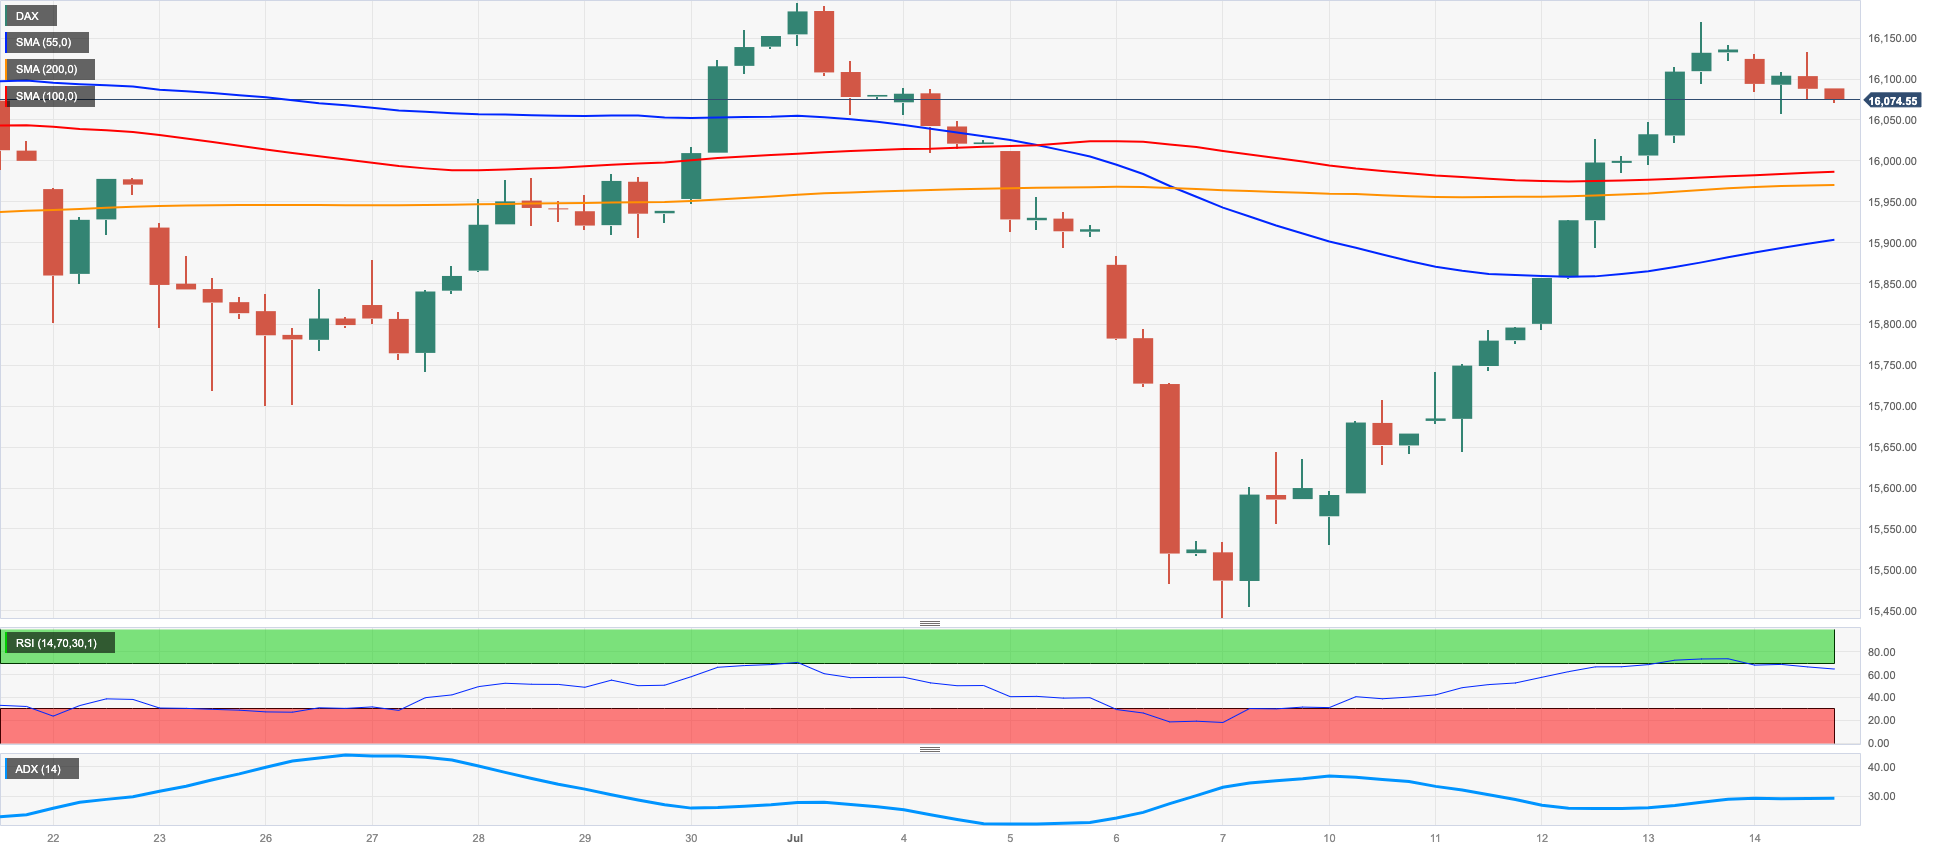
German stocks, as measured by the DAX 40 index, closed Friday's session with modest losses after five straight days of gains. That included a visit to multi-day highs around 16200 earlier in the week on July 13.
Some profit taking likely fueled the index's drop. However, optimism among investors remained high, buoyed by signs of easing U.S. inflation and hopes the Fed may end its tightening cycle soon.
In the domestic money market, German 10-year bond yields rebounded modestly to around 2.48%, reversing some of their recent declines.
Wholesale prices in Germany contracted 0.2% month-over-month in June and fell 2.9% from a year ago, German data showed. This pointed to easing inflation pressures.
The DAX40 is anticipated to achieve a weekly high of 16209 on July 3 before reaching an all-time high of 16427 on June 16. By contrast, immediate contention is located around the July low of 15456 (July 7), which is above the 200-day SMA at 14969 and the weekly low of 14458 (March 20). If the price falls below the latter, it will be able to reach the December 2022 bottom of 13791 (December 20). The daily RSI slipped back to the vicinity of 55.
Best Performers: Deutsche Boerse, Siemens Healthineers, Daimler Truck Holding
Worst Performers: Brenntag AG, BASF, Commerzbank
Resistance levels: 16185 16209 16427 (4H chart)
Support levels: 15941 15456 14809 (4H chart)
NASDAQ
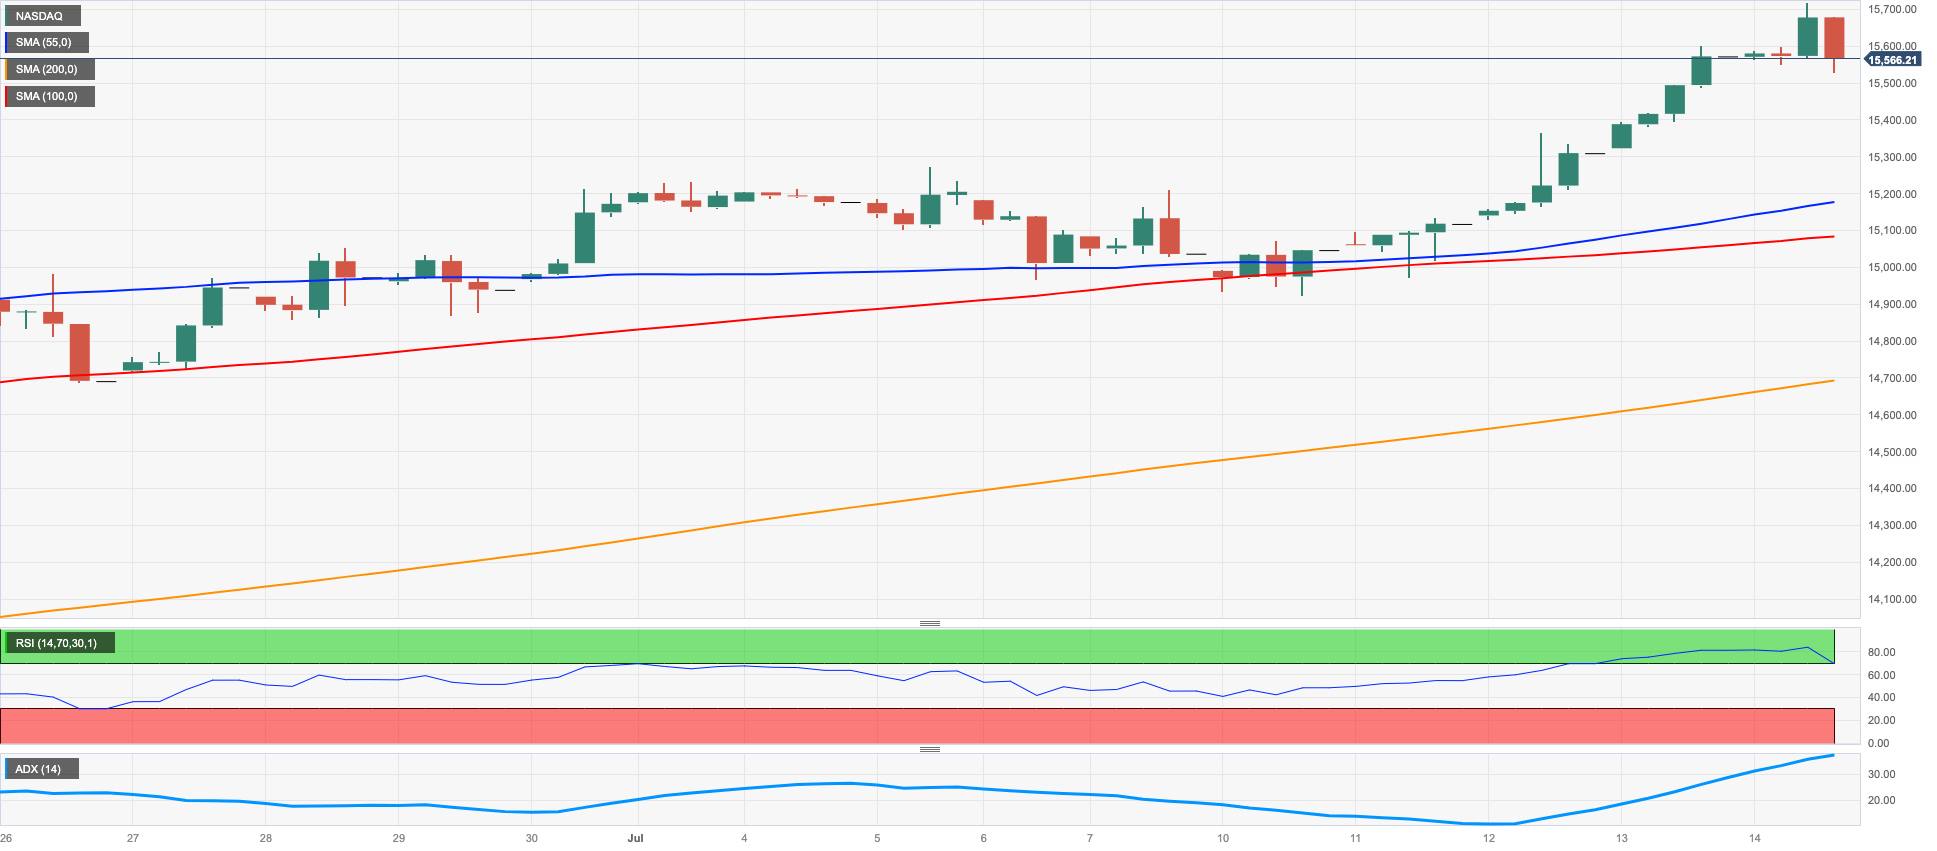
The tech-focused Nasdaq 100 index surged to a new high for 2023, climbing beyond the 15,700 level at week's end although ending the session with marginal losses.
Furthermore, this week’s price action extended the Nasdaq's winning streak to a fifth straight month.
Buoying investors' positive mood were lower June U.S. inflation readings that bolstered hopes the Federal Reserve may implement fewer interest rate hikes beyond July. This fed into investors' hopes for an economic landing that is soft, not hard.
The Nasdaq 100 should be driven to test the round milestone of 16000 following the breakout of the 2023 high of 15720 (July 14). On the flip side, initial contention emerges at the weekly lows of 14687 (June 26) and 14283 (June 7), followed by the transitory 55-day SMA at 14283 and another weekly low of 13520 (May 24). A further decline may send the price below the May low of 12938 (May 4) seconded by the April low of 12724 (April 25), the 200-day SMA at 12522, and the March low of 11695 (March 13). The daily RSI trespassed the overbought territory beyond 72.
Top Gainers: Copart, Atlassian Corp Plc, Intuitive Surgical
Top Losers: Lucid Group, Moderna, Warner Bros Discovery
Resistance levels: 15720 16017 16607 (4H chart)
Support levels: 14924 14687 14283 (4H chart)
DOW JONES
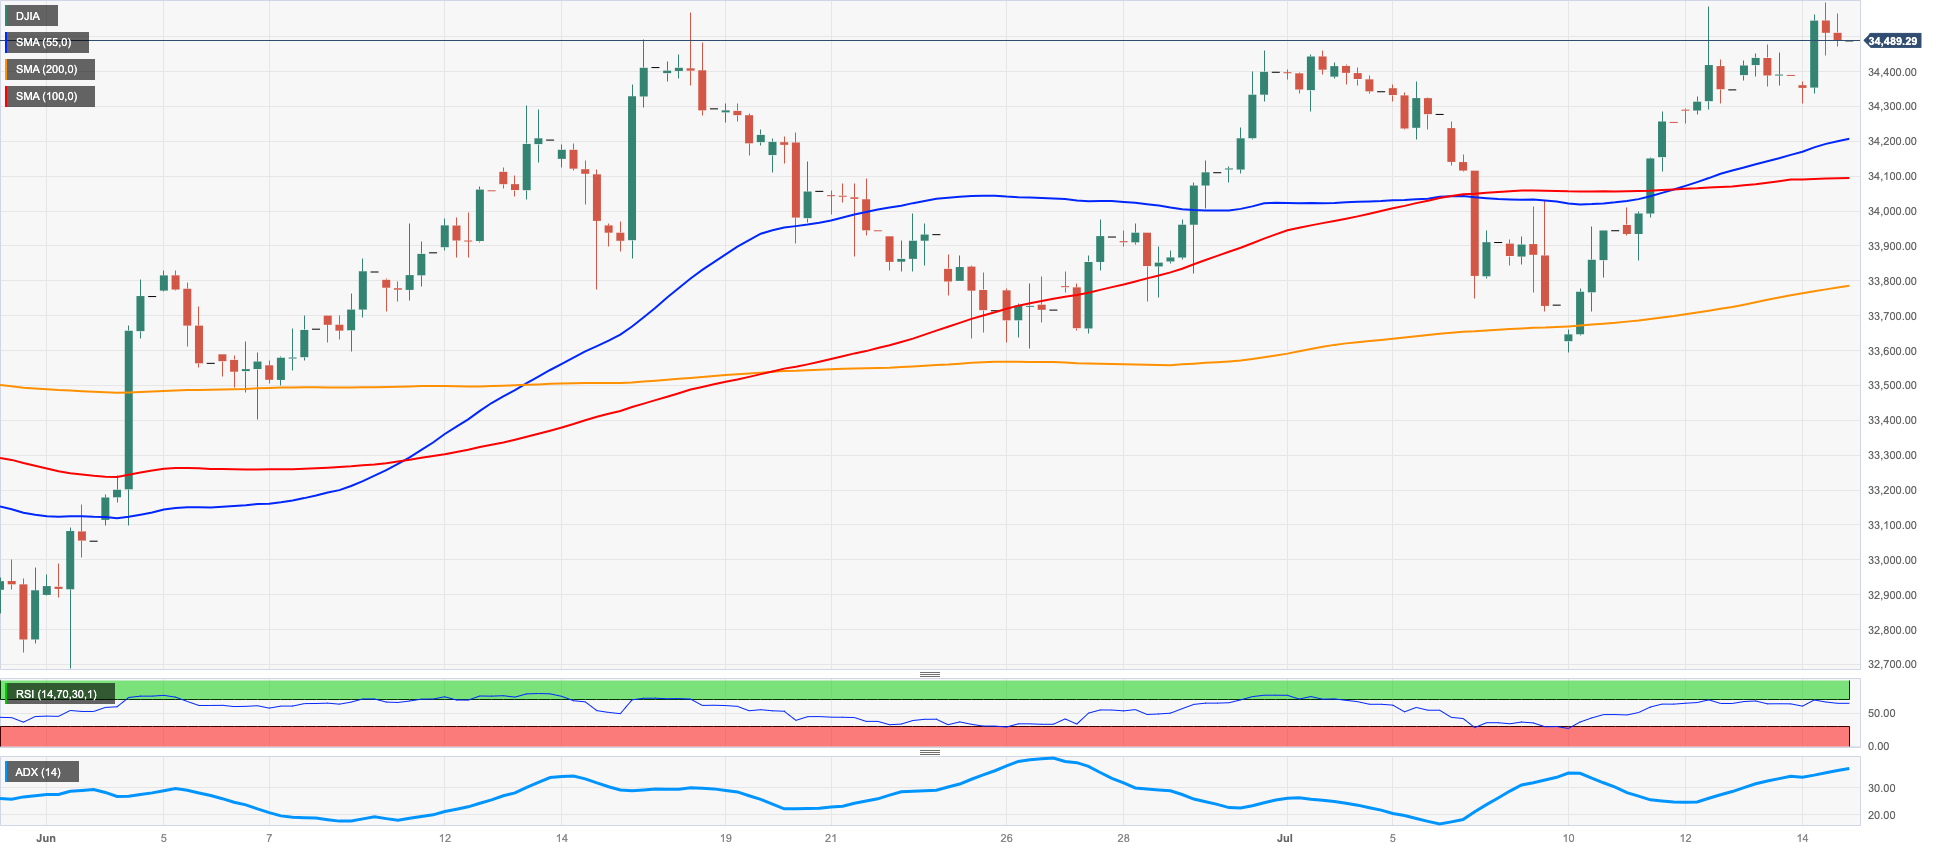
The Dow Jones reached new monthly highs near the 34600 area on Friday, extending its weekly recovery and the positive trading so far in July.
Better-than-expected earnings reports from a couple of major US lenders, combined with a strong reading from the Michigan Consumer Sentiment survey (72.6), recent lower inflation and continued market talk about the likelihood that the Federal Reserve will raise rates for the last time in July, have all supported US equities and bolstered the upside bias in the index.
On the whole, the Dow Jones climbed 0.33% to 34509, the S&P500 dropped 0.10% to 4505, and the tech-benchmark Nasdaq Composite deflated 0.18% to 14113.
If the Dow Jones surpass the 2023 high of 34592 (July 14), it may attempt to test the December 2022 top of 34712 (December 13), before targeting the April 2022 peak of 35492 (April 21). Having said that, if the market experiences a downturn, it is expected to find support at the weekly low of 33610 (June 26), followed by the transitory 100-day SMA of 33384 and the crucial 200-day SMA of 33084. Lower levels of support include the May low of 32586 (May 25), the 2023 low of 31429 (March 15), and the 2022 low of 28660 (October 13). The everyday RSI ticked higher past the 61 area.
Top Performers: UnitedHealth, Microsoft, Merck&Co
Worst Performers: Cisco, Chevron, Dow
Resistance levels: 34592 34712 35492 (4H chart)
Support levels: 33705 33375 32586 (4H chart)
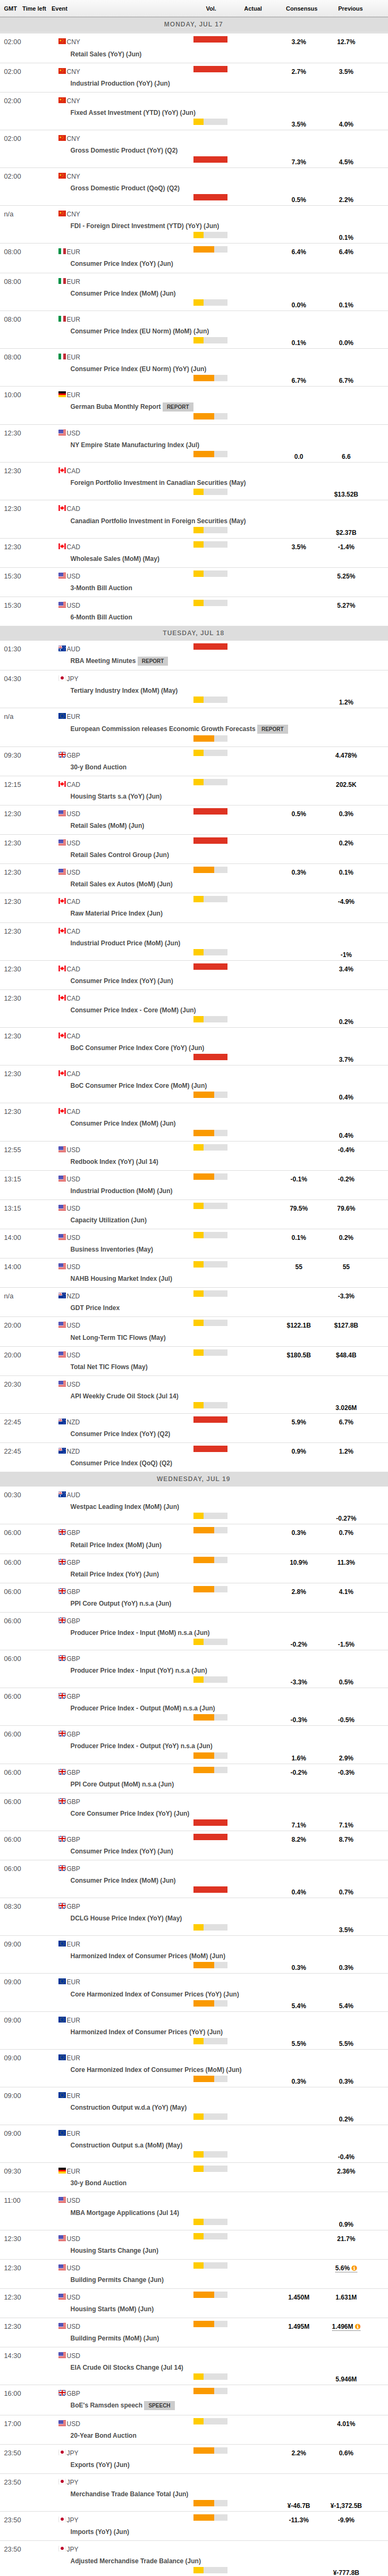
MACROECONOMIC EVENTS
All Information & Updates provided by:

All information relating to the financial markets available on this page has been prepared and issued by FXStreet (Forexstreet SL, Spain, Reg: B62498233) on the basis of publicly available information and all information believed to be reliable and does not conflict with Kuwaiti local laws, and all necessary care has been taken to before the company to ensure that the facts mentioned are correct from the source.
NCM Investment nor any of its directors or employees shall in any way be held responsible for the contents of this news, and the information contained on this page is intended only to provide clients with publicly available information and should not be construed as investment advice, report or analysis and/or constitute an offer or invitation to buy or sell financial instruments of any kind.
RISK WARNING: Forex and CFDs are highly risky leveraged products, as losses can exceed deposits. Please ensure you understand all the risks and take independent advice if necessary. NCM will segregate the clients based on the criteria of the regulator and its bylaws. NCM does not provide any advisory service; the material published does not constitute advice or a recommendation for a transaction in any financial instrument. NCM accepts no responsibility for any use of the content presented and any consequences of that use. Anyone acting on the information provided does so at their own risk.