
- Contact Us:
-

-

-

-


Daily Market Updates
18 Jul 2023
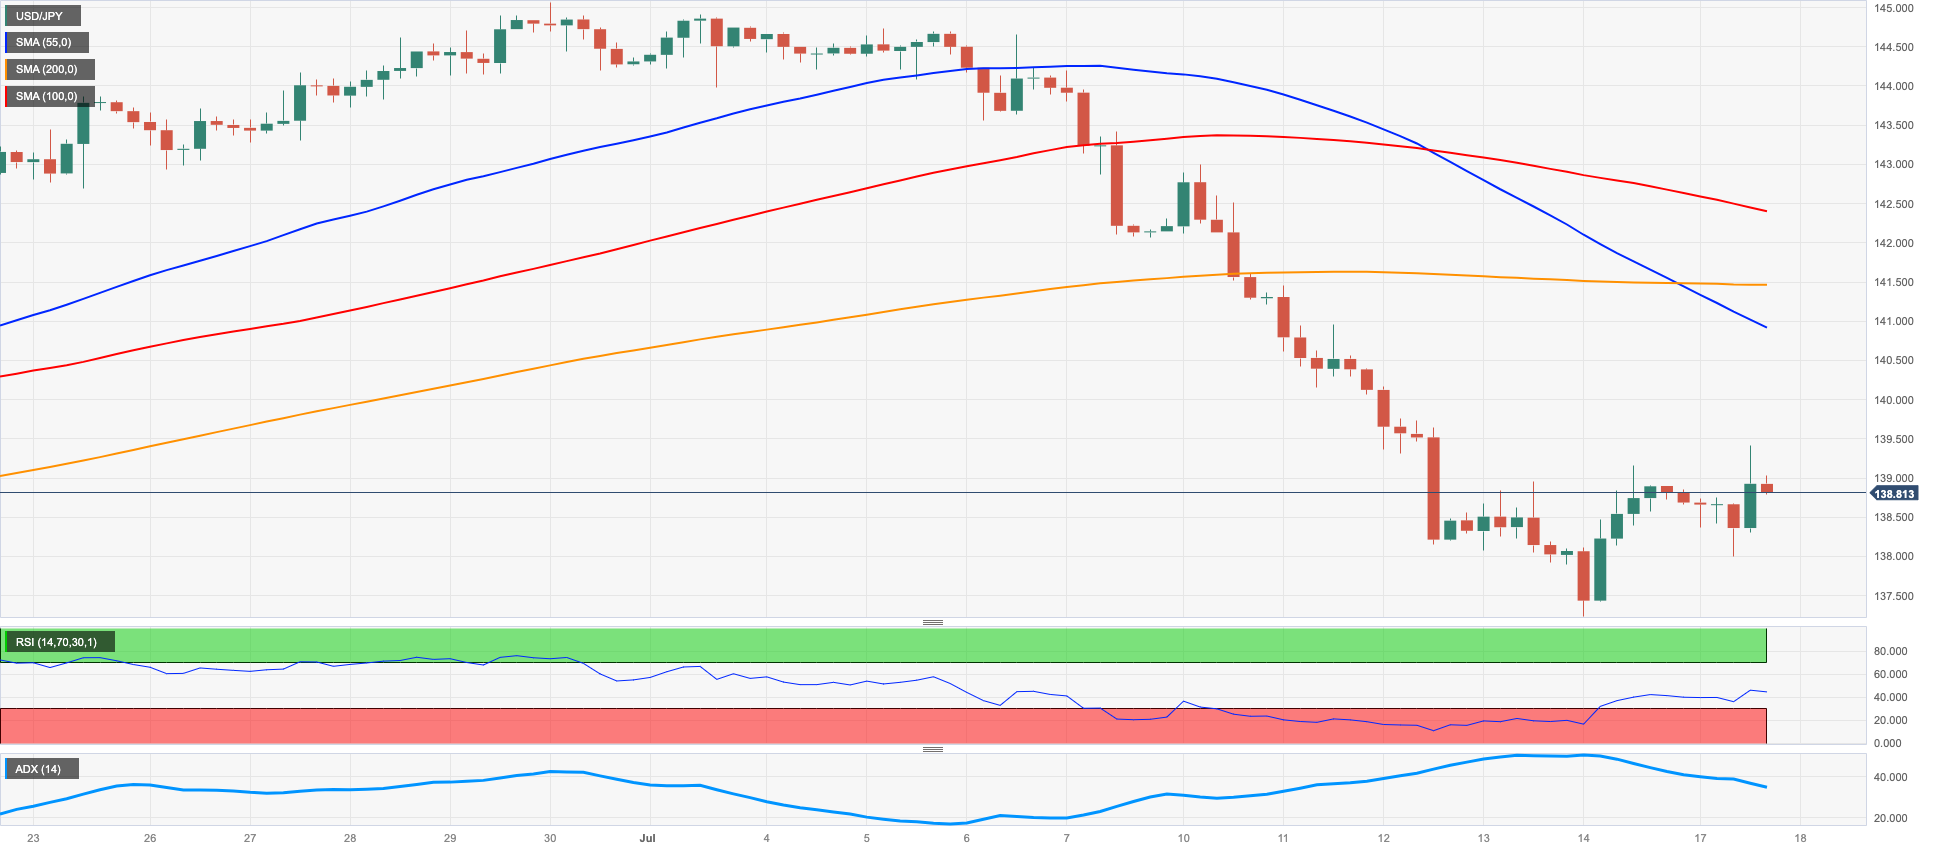
USDJPY
USD/JPY rebounded further and added to gains seen last Friday, managing to bounce off the 138.00 area and reclaim the 139.00 threshold and beyond.
The daily uptick in spot followed the irresolute session in the greenback, while US yields across the curve traded mostly without direction following Friday’s strong rebound.
In the Japanese bonds market, the JGB 10-year yields rose to fresh highs above the 0.48% yardstick.
Meanwhile, the speculative community left their net short positions in the Japanese currency largely unchanged at multi-year highs of around 117K contracts in the week ended July 11, according to the latest CFTC positioning report.
There were no major scheduled events in the Japanese calendar.
Extra losses might prompt USD/JPY to revisit the July low at 137.23 (July 14) ahead of the 200-day SMA of 137.03, which is also supported by the interim 100-day SMA. If the pair continues to fall, the weekly low of 133.01 (April 26) and minor support of 132.01 (April 13) may provide additional contention prior to the April low of 130.62 (April 5) and the key round level of 130.00. On the upside, the USD/JPY should initially test the provisional 55-day SMA at 139.72 ahead of the 2023 high of 145.07 (June 30), followed by the 2022 top of 151.94 (October 21) and, lastly, the round level of 152.00. The day-to-day RSI climbed to the proximity of 38.
Resistance levels: 139.15 141.39 143.00 (4H chart)
Support levels: 137.49 137.23 133.74 (4H chart)
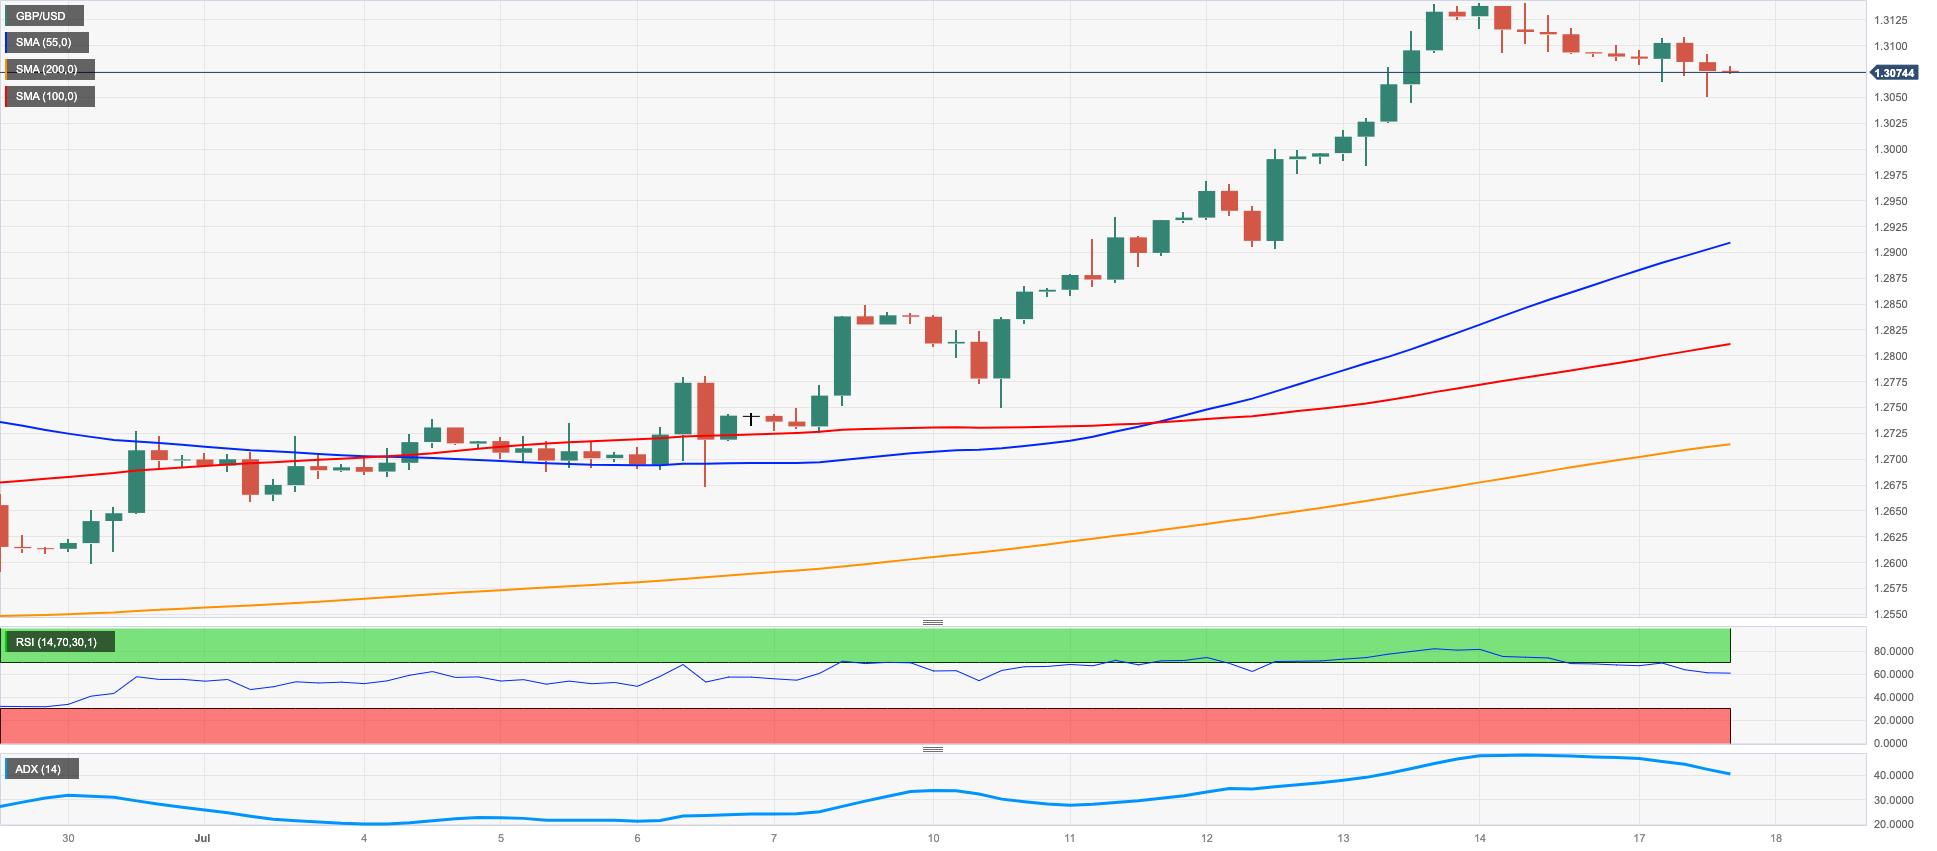
GBPUSD
The pound softened against the dollar early this week, pulling back below $1.3100 despite the greenback trading within a vacillating fashion.
Indeed, GBP/USD extended its modest Friday’s decline as the pair retreated from overbought readings. Notably, sterling has ended lower on just 4 days so far this month.
The ongoing monthly rally in the quid appears also underpinned by the speculative community, after GBP net longs climbed to multi-year peaks in the week ended on July 11 according to the latest CFTC Positioning Report.
The pound's strength reflects wagers that the BoE will keep raising interest rates beyond the summer given sky-high inflation and a tight job market, contrasting with the view that the Fed may be nearing the end of its tightening campaign.
If the 2023 top of 1.3142 (July 14) is cleared , GBP/USD may target the weekly highs of 1.3146 (April 14, 2022) and 1.3298 (March 23, 2022). On the other hand, the transitory 55-day SMA at 1.2622 and the weekly low of 1.2590 (June 29) give immediate support ahead of the 1.2530 zone, which corresponds to the 2021-2023 trend line. The June low of 1.2368 (June 5), the May low of 1.2308 (May 25), and the April low of 1.2274 (April 3) follow. If the latter is breached, the price is projected to fall below the 200-day SMA at 1.2208. The daily RSI eased to the vicinity of 72, still indicating an overbought market.
Resistance levels: 1.3142 1.3146 1.3166 (4H chart)
Support levels: 1.2903 1.2750 1.2694 (4H chart)
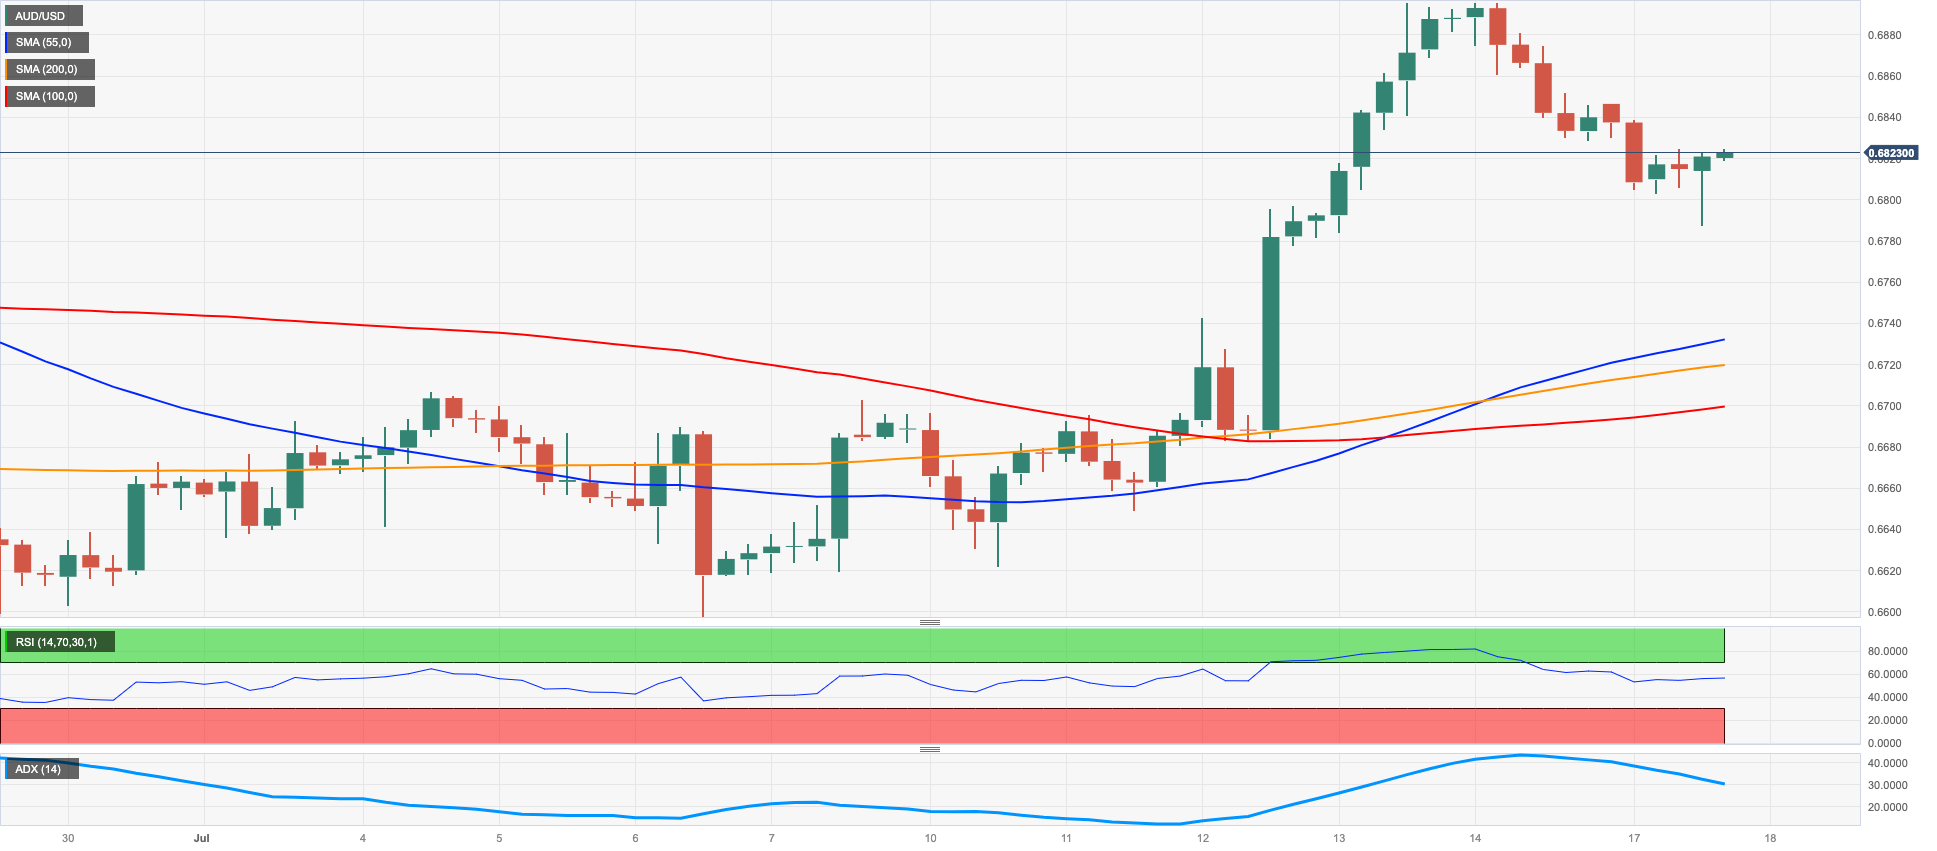
AUDUSD
The Aussie dollar experienced a second consecutive daily decline against the greenback due to a combination of mixed Chinese data, a general downward trend in commodity prices, and investors taking profits. This led to AUD/USD continuing its retreat from the July highs near the 0.6900 level.
Despite the weakening of the US dollar, the pair further extended its pullback from the mentioned peaks on Friday, all against the backdrop of alternating risk appetite trends.
There were no data releases Down Under at the beginning of the week.
The AUD/USD is currently facing resistance from the June high of 0.6899 (June 16). Aside from that, the crucial 0.7000 level, the weekly top of 0.7029 (February 14), and the 2023 peak of 0.7157 (February 2) are all essential milestones to keep an eye on. Just the opposite, if the price falls below the crucial 200-day SMA of 0.6706, it may return to the weekly low of 0.6595 (June 29) before reaching the 2023 low of 0.6458 (May 31). The November 2022 low is 0.6272 (November 3), whereas the 2022 low is 0.6169 (October 13). The daily RSI deflated to the 59 zone.
Resistance levels: 0.6894 0.6920 0.7029 (4H chart)
Support levels: 0.6708 0.6599 0.6579 (4H chart)
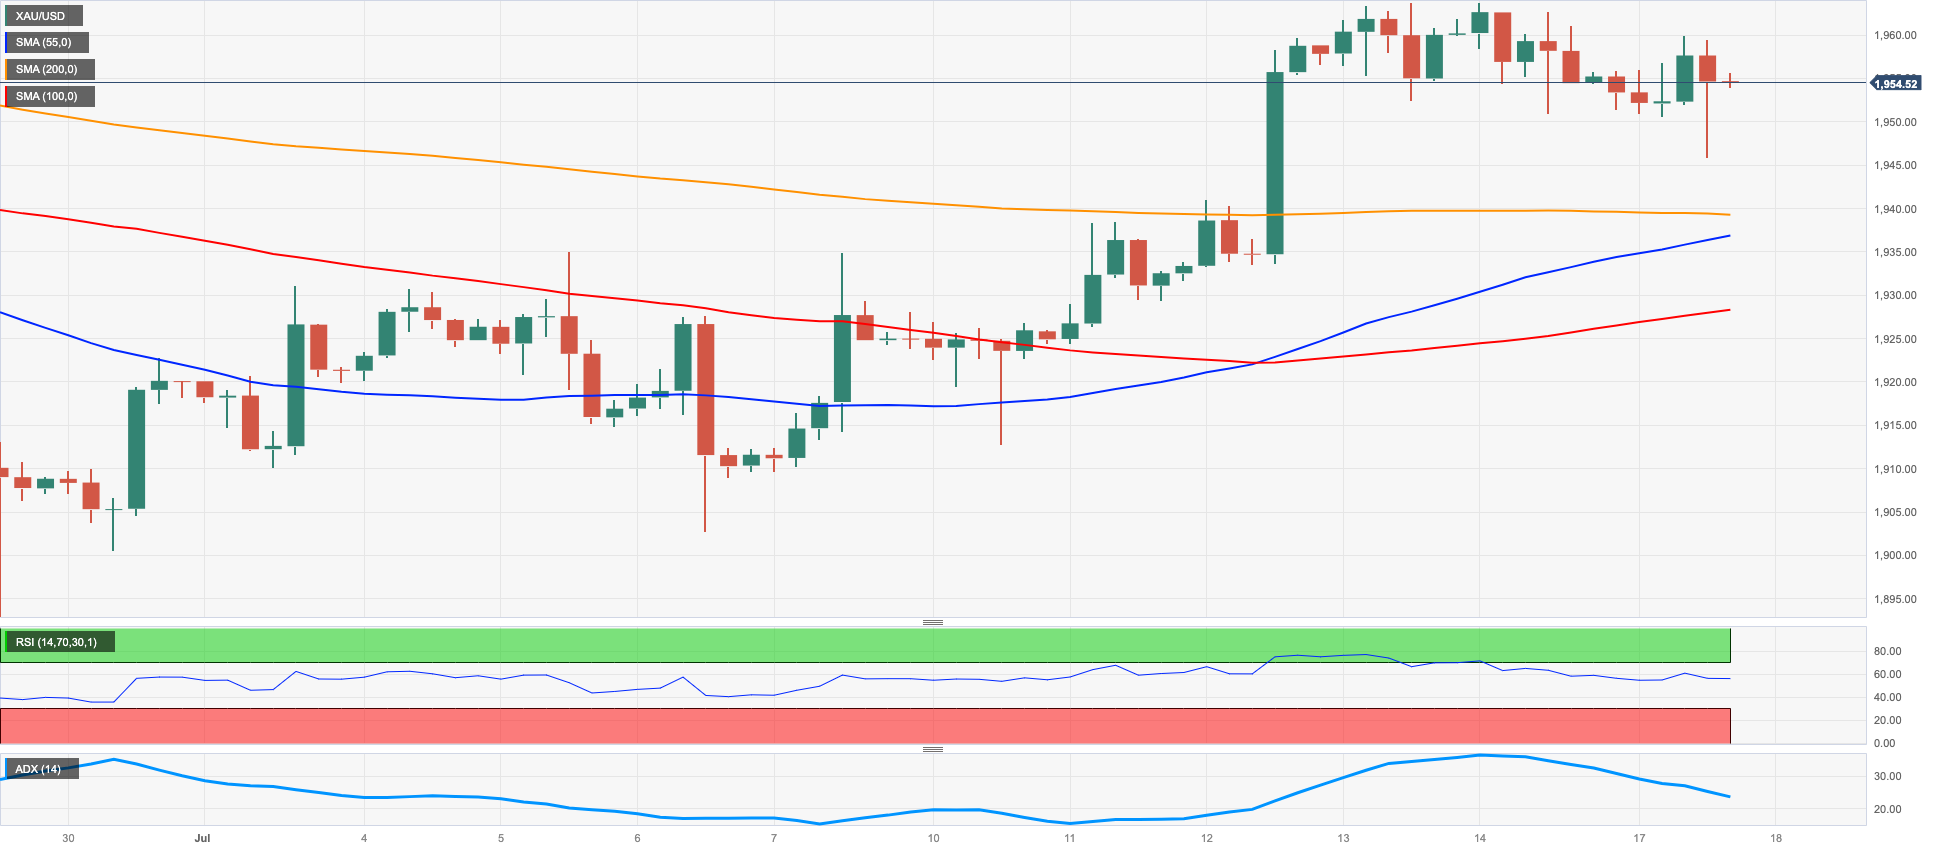
GOLD
At the start of the week, gold prices were under pressure for the second consecutive session amidst the indecision surrounding the greenback.
In fact, gold prices retreated even further after failing to maintain last week's monthly highs above the $1960 per troy ounce level, while the recovery in US yields across the curve also contributed to the decline in prices of the precious metal.
Looking ahead, the direction of bullion prices will likely be influenced by the Fed's actions amidst growing speculation that the upcoming rate hike in July may be the final one in the current tightening campaign.
Gold appears to have exited its multi-session consolidation period. Additional upward advance now meets an early up-barrier at the July high of $1963 (July 13), which comes before the June top of $1983 (June 2) and the important $2000 goal. There will be no strong northward resistance until the 2023 peak of $2067 (May 4), which follows the 2022 high of $2070 (March 8) and before the all-time top of $2075 (August 7, 2020). Instead, immediate support is at the June low of $1893 (June 29), followed by the 200-day SMA at $1872 and the 2023 low of $1804 (February 28), both of which are above the critical $1800 barrier.
Resistance levels: $1963 $1968 $1983 (4H chart)
Support levels: $1940 $1912 $1893 (4H chart)
CRUDE WTI
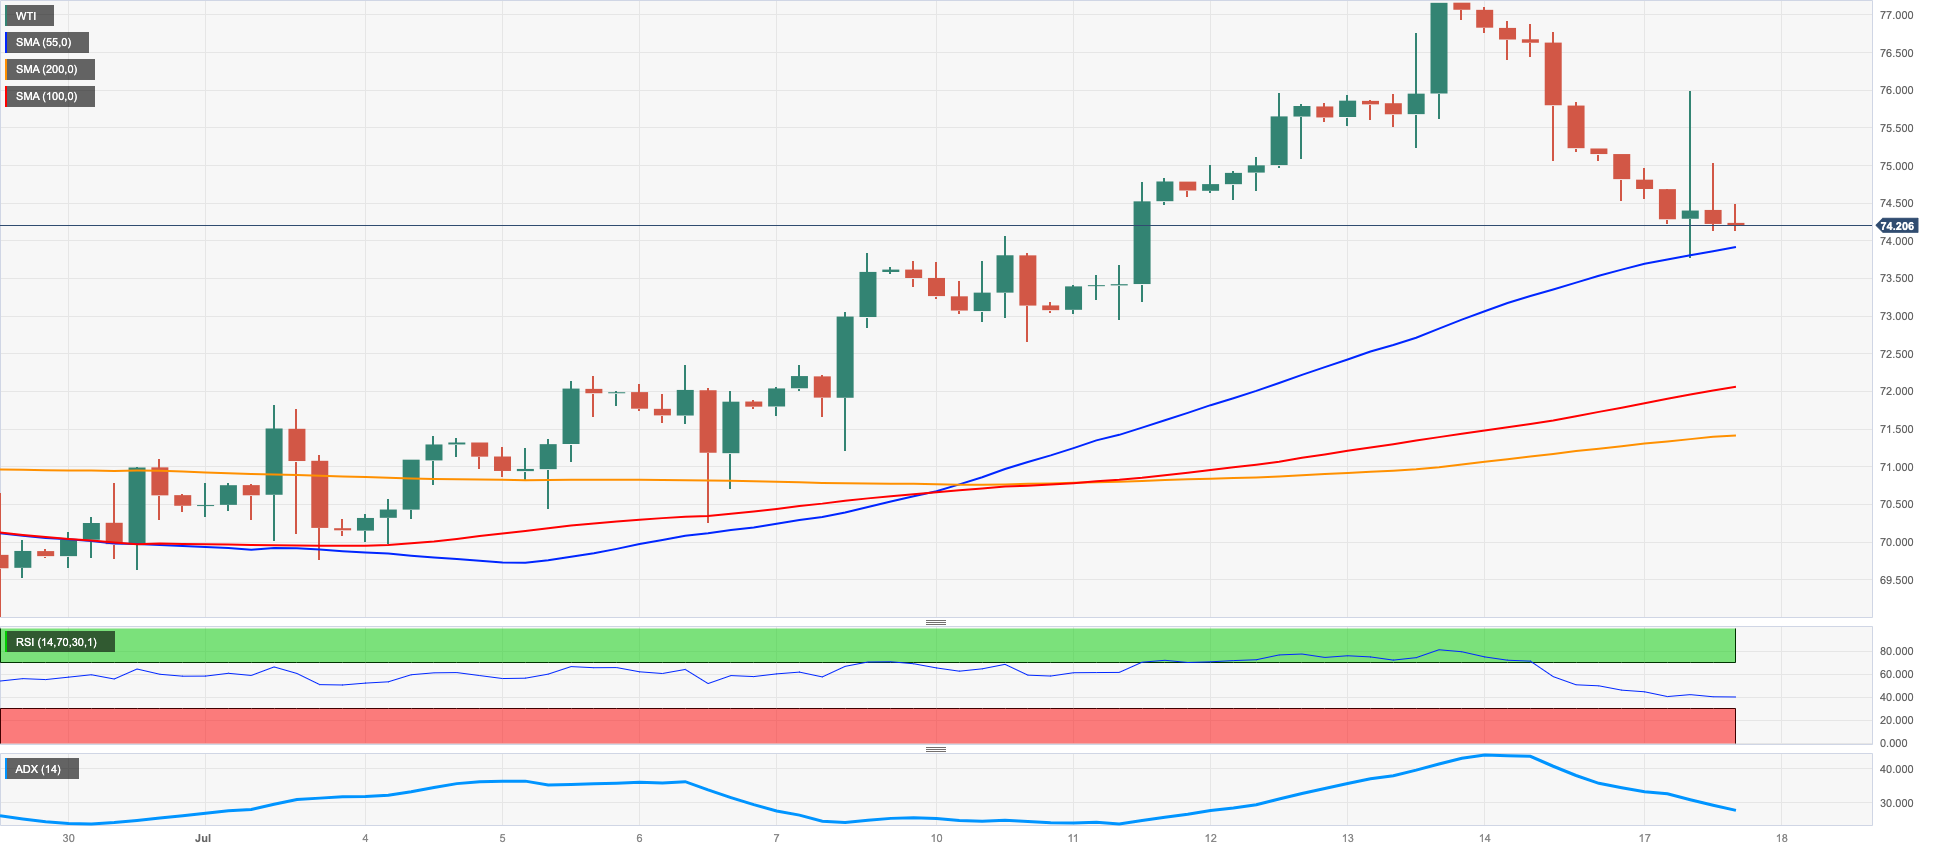
WTI prices experienced a further decline on Monday, briefly falling below $74.00 per barrel, following Friday's pullback.
The release of disappointing economic data from China at the start of the trading session, including Q2 GDP figures, Retail Sales, and Industrial Production, all contributed to the prevailing belief that the global recovery from the pandemic is progressing slowly.
Moreover, the rebound of the US dollar and the resumption of activity in Libyan oil fields added to the negative sentiment among traders at the beginning of the week.
Looking ahead, the American Petroleum Institute (API) and the Energy Information Administration (EIA) are scheduled to release reports on US crude oil inventories for the week ending July 14 later this week.
Immediately to the downside for WT emerges the interim 100-day and 55-day SMAs of $73.54 and $71.47, respectively, prior to the June low of $66.86 (June 13), the 2023 low of $63.61 (May 4), the December 2021 low of $62.46 (December 2), and the critical level of $60.00 per barrel. On the contrary, the July top of $77.30 (July 13) emerges as the initial hurdle ahead of the weekly high of $79.14 (April 24). The latter might break beyond the critical $80.00 per barrel level, which is supported by the 2023 peak of $83.49 (April 12) and the November 2022 peak of $93.73 (November 7).
Resistance levels: $77.26 $79.14 $81.52 (4H chart)
Support levels: $73.81 $71.17 $70.18 (4H chart)
GER40
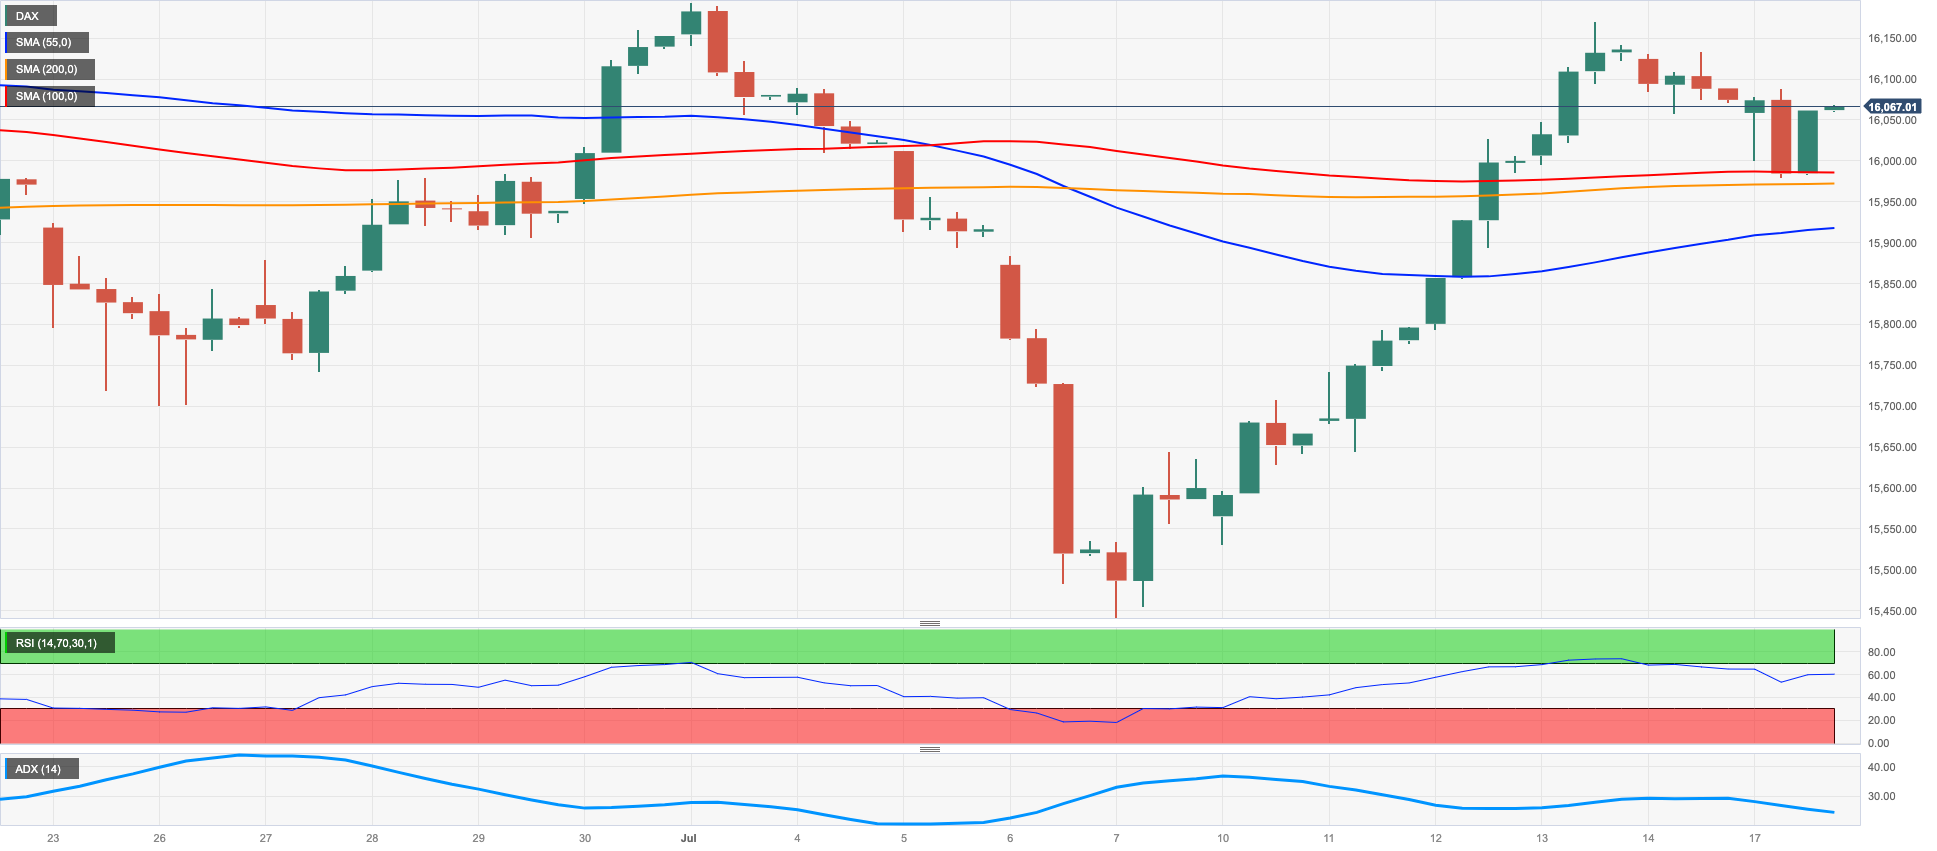
Equities in Europe faced a significant decline at the beginning of the week, with the German benchmark DAX40 following suit and continuing its negative performance from Friday. However, the 16000 level managed to resist the downward pressure for now.
At the start of the week, stocks were influenced by negative sentiment due to growing concerns about China's slow recovery, which were further confirmed by disappointing Chinese economic data released during early trade on Monday.
Furthermore, traders' confidence was dampened by the high probability of the European Central Bank (ECB) extending its tightening measures beyond the summer months.
The index experienced a reactionary decline in line with the decrease in 10-year bund yields, which reached multi-session lows near 2.40%.
Immediately to the upside for the DAX40 comes the July high of 16209 (July 3) before reaching an all-time top of 16427 recorded on June 16. On the flip side, there is a temporary contention at the 100-day SMA at 15745 prior to the July low of 15456 (July 7), which is above the 200-day SMA at 14986 and the weekly low of 14458 (March 20). If the price goes below the latter, it might approach the December 2022 low of 13791 (December 20). The daily RSI deflated to the vicinity of 54.
Best Performers: Deutsche Bank AG, Munich Re Group, Commerzbank
Worst Performers: Vonovia, Infineon, Sartorius AG VZO
Resistance levels: 16185 16209 16427 (4H chart)
Support levels: 15946 15456 14809 (4H chart)
NASDAQ
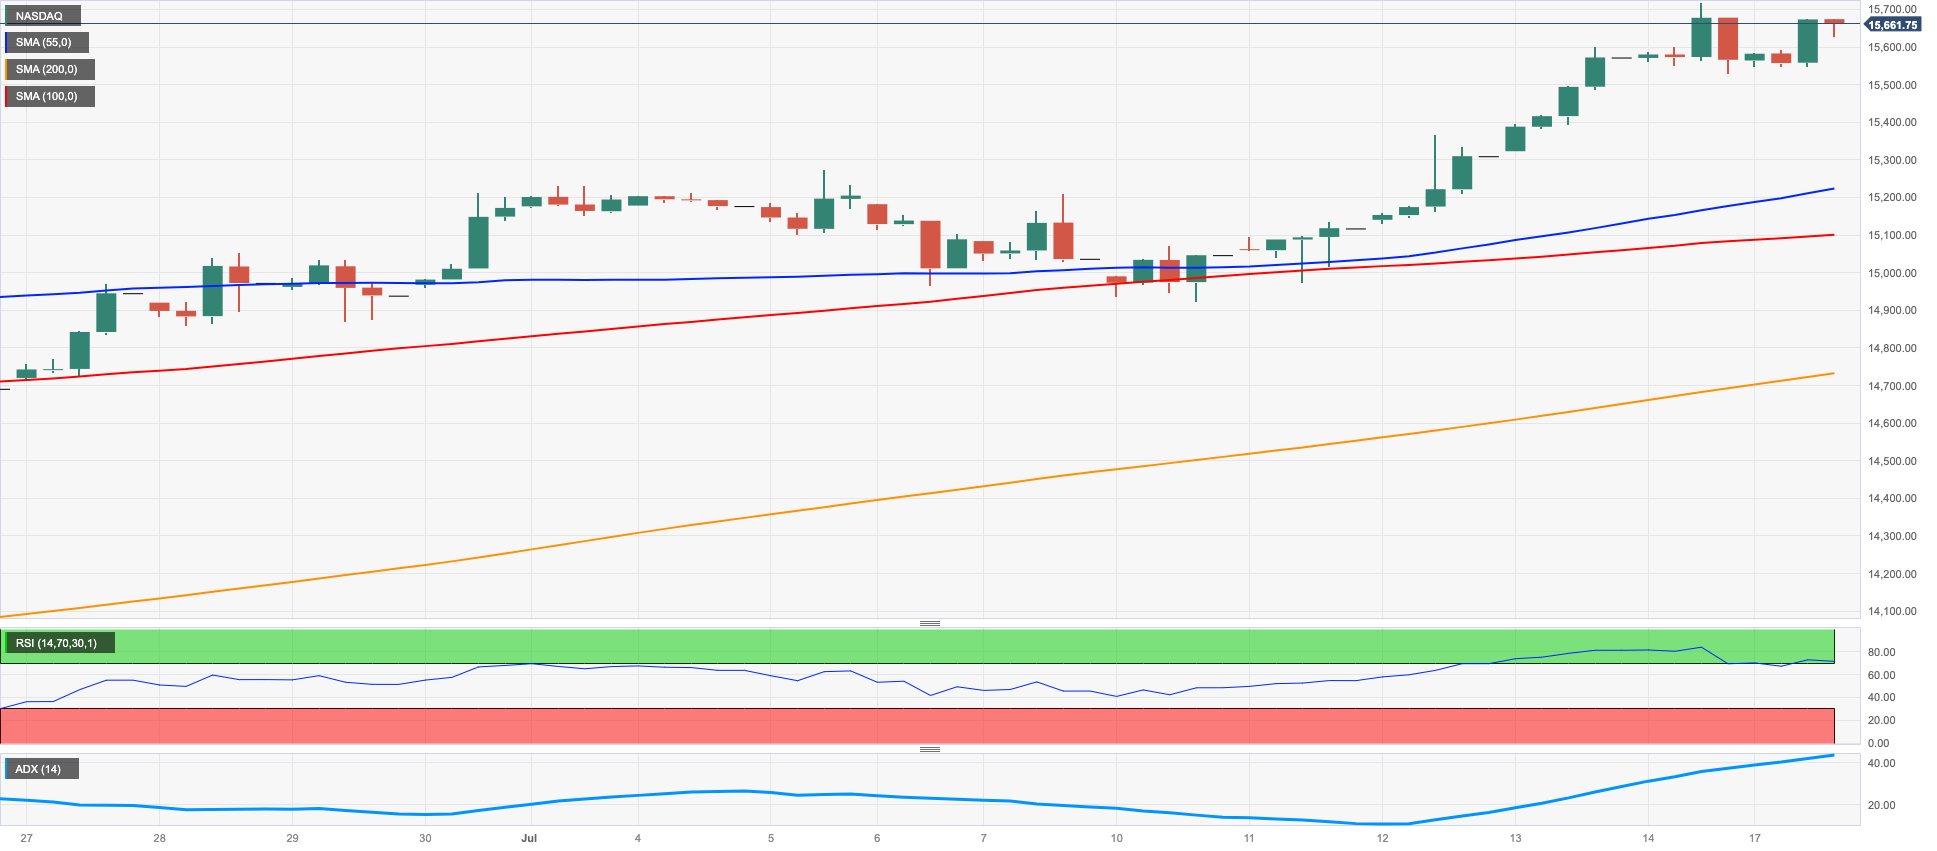
In step with other major US indexes, the tech-heavy Nasdaq 100 index got the new trading week off to a strong start, hovering close to Friday's yearly highs near the 15700 level.
Tech stocks continued rallying amid growing anticipation of another earnings season (with quarterly reports due Wednesday from Tesla and Netflix). Optimism in the technology sector was also boosted by the absence of direction in both the greenback and US yields across all maturities.
Following the breakout of the 2023 high of 15720 (July 14), the Nasdaq 100 should be propelled to test the round milestone of 16000. On the other hand, initial contention appears at the weekly lows of 14687 (June 26), 14283 (June 7) and 13520 (May 24). A further drop may push the price below the May low of 12938 (May 4), which was followed by the April low of 12724 (April 25), the 200-day SMA at 12543, and the March low of 11695 (March 13). The daily RSI remained in the overbought territory near 73.
Top Gainers: Enphase, Zscaler, ON Semiconductor
Top Losers: PDD Holdings DRC, CSX, Illumina
Resistance levels: 15720 16017 16607 (4H chart)
Support levels: 14924 14687 14283 (4H chart)
DOW JONES
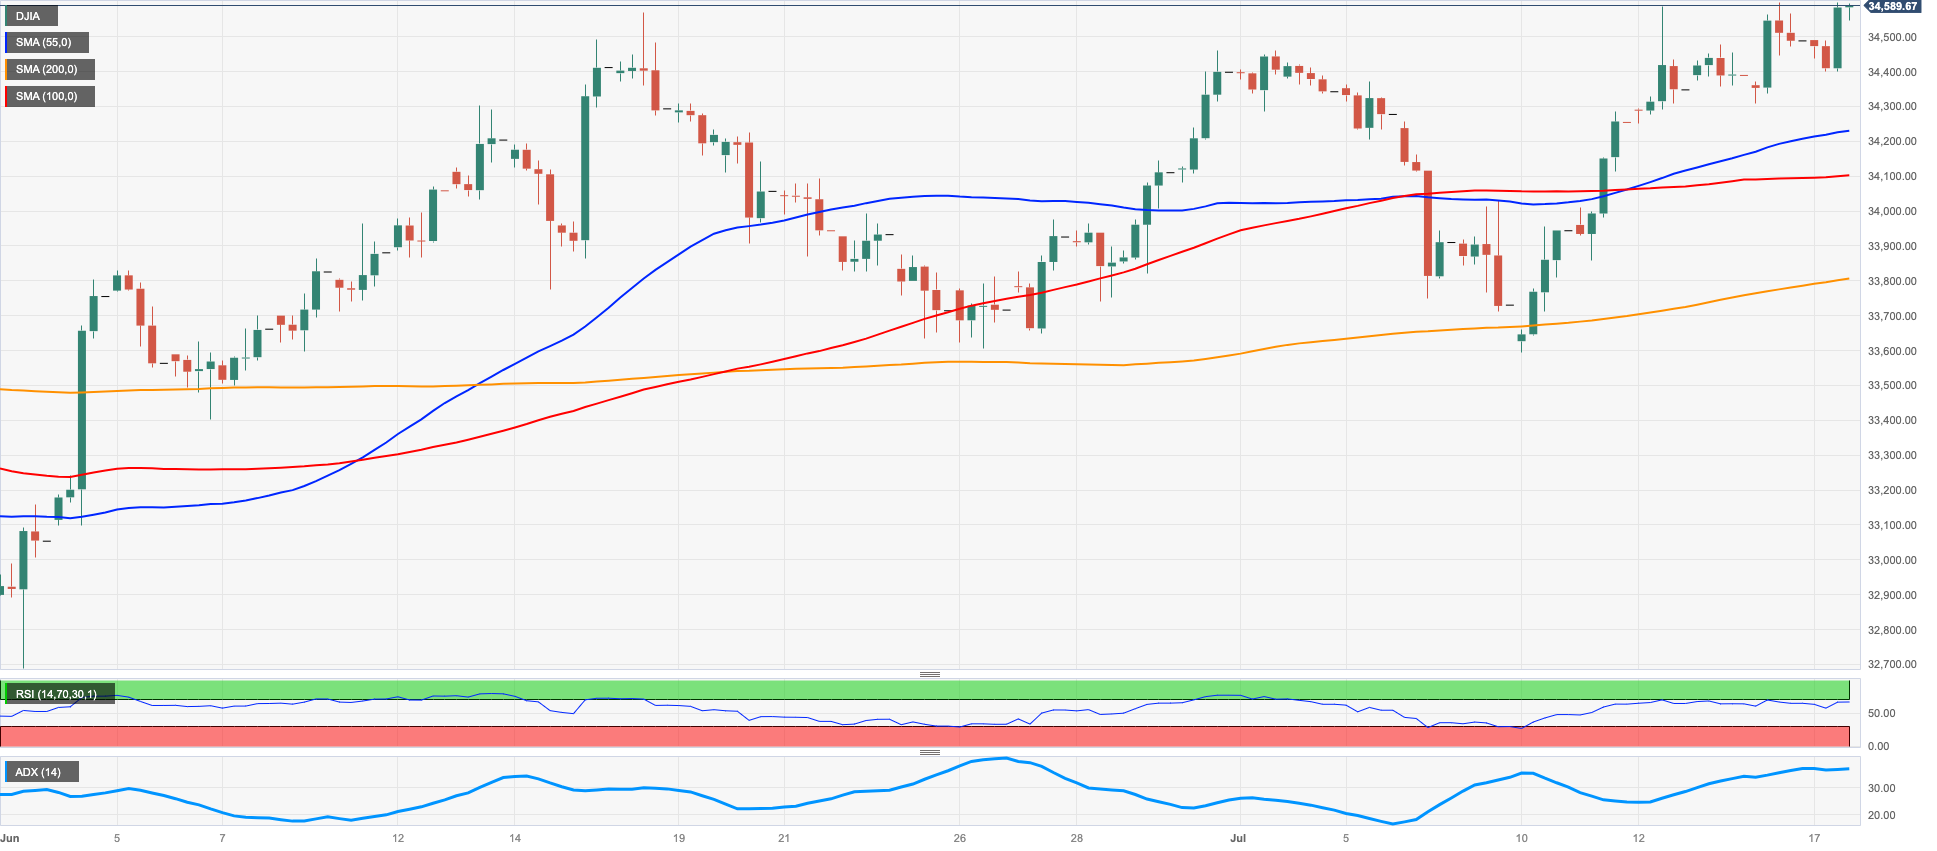
The Dow Jones continued its comeback, surging to new yearly peaks just above the 34600 level at the start of the week.
Investors' confidence stayed strong, propelling stocks higher on hopes of a robust earnings season. Recent inflation numbers that came in below estimates also boosted market sentiment as did speculation that the Fed may conclude its interest rate hiking sooner than forecast.
All in all, the Dow Jones rose 0.16% to 34565, the S&P500 advanced 0.24% to 4516, and the tech-focused Nasdaq Composite gained 0.60% to 14198.
If the Dow Jones exceeds the 2023 high of 34601 (July 17), it may try to test the December 2022 high of 34712 (December 13), before aiming for the April 2022 high of 35492 (April 21). Just the opposite, if the market falls, support is predicted to be found around the weekly low of 33610 (June 26), followed by the transitory 100-day SMA of 33399 and the critical 200-day SMA of 33111. Lower levels of support include the May low of 32586 (May 25), the 2023 low of 31429 (March 15), and the 2022 low of 28660 (October 13). The daily RSI ticked higher to the 62 area.
Top Performers: Intel, JPMorgan, Travelers
Worst Performers: Verizon, Walt Disney, Merck&Co
Resistance levels: 34601 34712 35492 (4H chart)
Support levels: 33705 33383 32586 (4H chart)
MACROECONOMIC EVENTS

All Information & Updates provided by:

All information relating to the financial markets available on this page has been prepared and issued by FXStreet (Forexstreet SL, Spain, Reg: B62498233) on the basis of publicly available information and all information believed to be reliable and does not conflict with Kuwaiti local laws, and all necessary care has been taken to before the company to ensure that the facts mentioned are correct from the source.
NCM Investment nor any of its directors or employees shall in any way be held responsible for the contents of this news, and the information contained on this page is intended only to provide clients with publicly available information and should not be construed as investment advice, report or analysis and/or constitute an offer or invitation to buy or sell financial instruments of any kind.
RISK WARNING: Forex and CFDs are highly risky leveraged products, as losses can exceed deposits. Please ensure you understand all the risks and take independent advice if necessary. NCM will segregate the clients based on the criteria of the regulator and its bylaws. NCM does not provide any advisory service; the material published does not constitute advice or a recommendation for a transaction in any financial instrument. NCM accepts no responsibility for any use of the content presented and any consequences of that use. Anyone acting on the information provided does so at their own risk.