
- Contact Us:
-

-

-

-


Daily Market Updates
19 Jul 2023
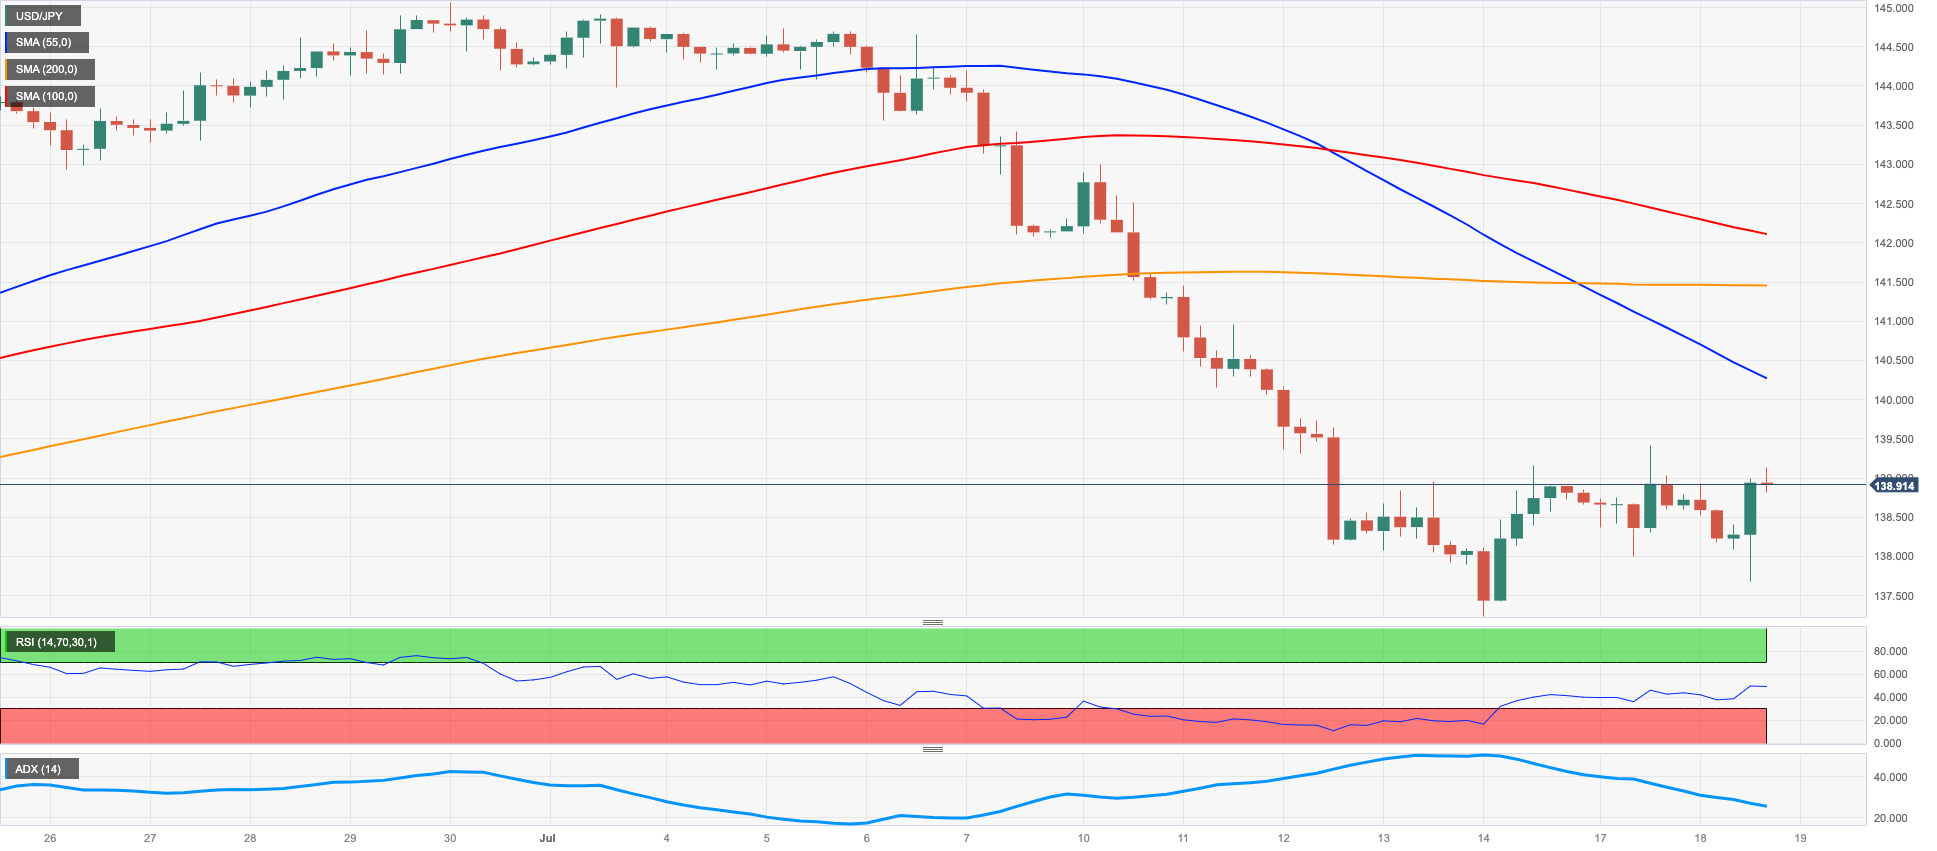
USDJPY
On Tuesday, USD/JPY closed the session with decent gains, reaching levels close to 139.00, after hitting weekly lows around 137.70 earlier in the European afternoon.
The reversal of the US dollar was the primary driver behind the upward movement of the pair, effectively offsetting the negative performance of US yields across the entire yield curve.
Simultaneously, in the Japanese money market, the JGB 10-year yields eased to their lowest point in four days, hovering around the 0.45% mark.
Meanwhile, in Japan, the Tertiary Industry Index showed a monthly expansion of 0.2% in May.
Extra losses may force USD/JPY to revisit the July low of 137.23 (July 14), which is bolstered by the 200-day SMA of 137.00 and the temporary 100-day SMA (137.04). If the pair falls further, the weekly low of 133.01 (April 26) and minor support of 132.01 (April 13) may give further support before the April low of 130.62 (April 5) and crucial round mark of 130.00. On the upside, the USD/JPY should first target the provisional 55-day SMA at 139.78 before testing the 2023 high of 145.07 (June 30), the 2022 high of 151.94 (October 21), and finally the round level of 152.00. The day-to-day RSI rose past the 38 level.
Resistance levels: 139.15 141.39 143.00 (4H chart)
Support levels: 137.49 137.23 133.74 (4H chart)
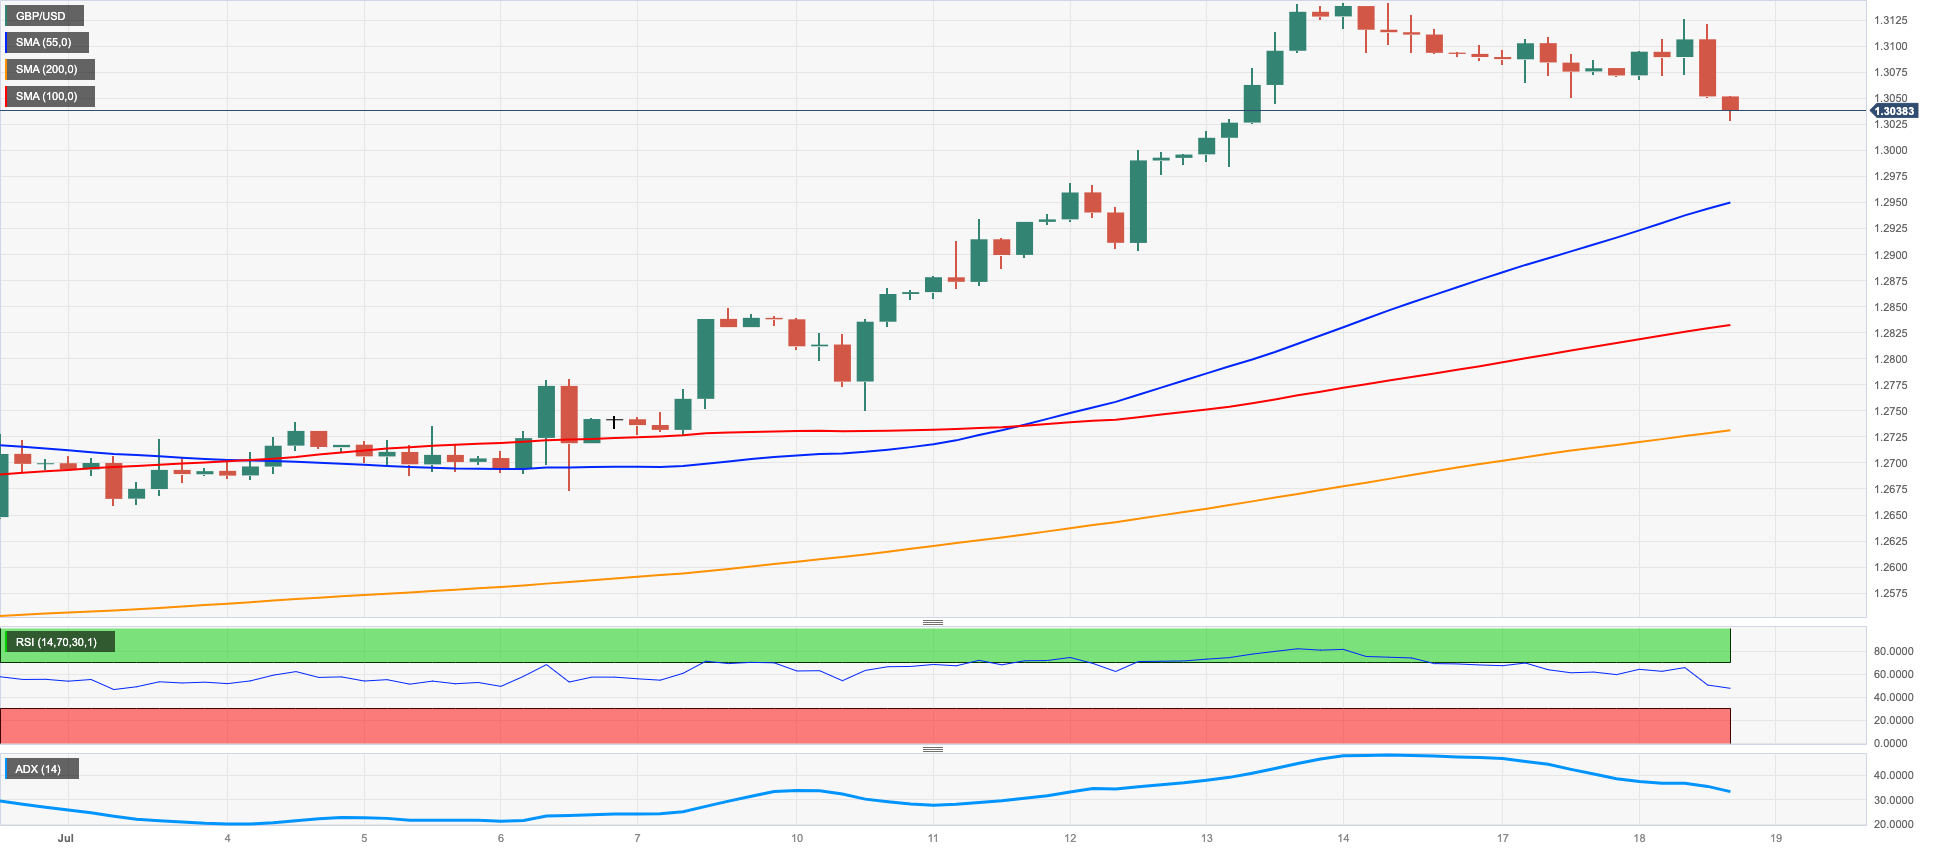
GBPUSD
GBP/USD succumbed to the late rebound in the greenback and shed ground for the third session in a row on Tuesday.
Indeed, Cable extended further the rejection from recent 2023 peaks around 1.3140 (July 13-14) in response to the mentioned bounce in the buck and some profit taking in light of the impressive rally in the Sterling so far in July.
In the meantime, the pound's strength in place since late May reflects expectations that the BoE will continue to raise interest rates beyond the summer against the current backdrop of high inflation and a stubbornly tight labor market.
There were no major economic releases from the UK on Tuesday, but UK inflation figures will be released on Wednesday and are likely to be a key driver for the pound.
If the 2023 high of 1.3142 (July 14) is breached, GBP/USD might aim for weekly highs of 1.3146 (April 14, 2022) and 1.3298 (March 23, 2022). The interim 55-day SMA at 1.2633 and the weekly low of 1.2590 (June 29), on the other hand, provide immediate support ahead of the 1.2530 zone, which corresponds to the 2021-2023 trend line. Following that is the June low of 1.2368 (June 5), the May low of 1.2308 (May 25), and the April low of 1.2274 (April 3). If the latter is violated, the price is expected to go below the 200-day SMA of 1.2219. The daily RSI dropped to the subu-69 area.
Resistance levels: 1.3142 1.3146 1.3166 (4H chart)
Support levels: 1.2903 1.2750 1.2721 (4H chart)
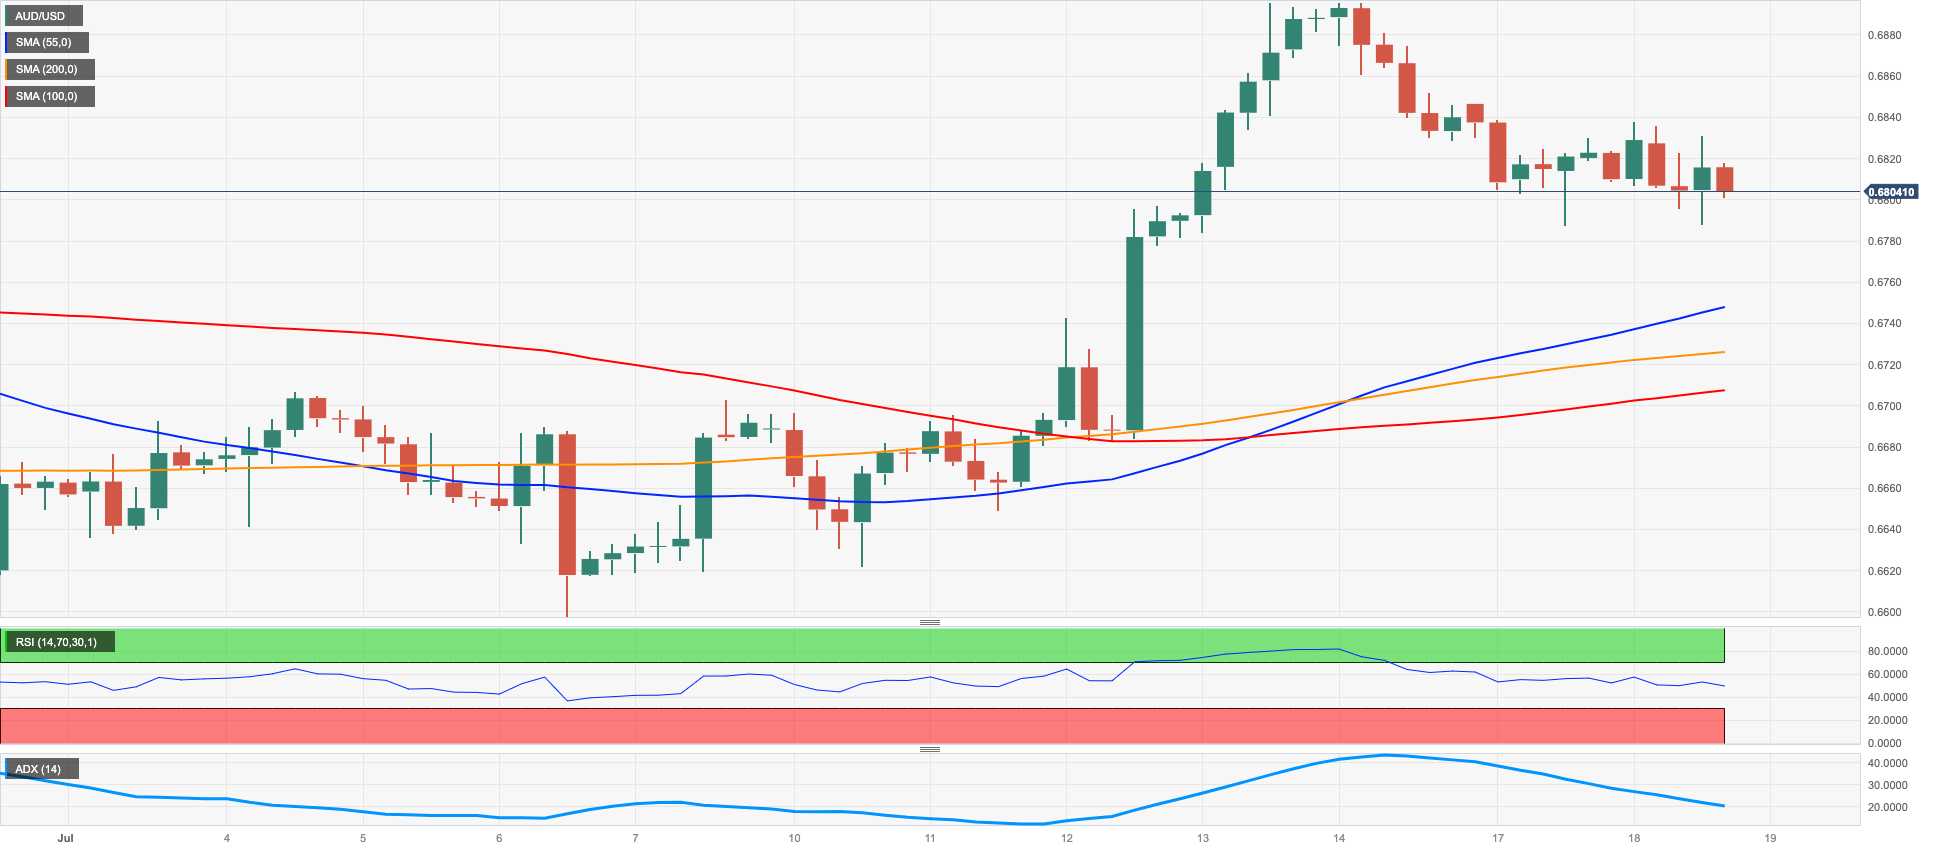
AUDUSD
On Tuesday, AUD/USD recorded another bearish session and briefly pierced the 0.6800 support on the back of the greenback's buy bias as well as the commodities complex's broad-based bearish price action.
Furthermore, dismal forecasts for the Chinese economy's sluggish recovery in the aftermath of the epidemic have kept any effort at a significant rebound around the Australian dollar on hold for the time being.
In Oz, the RBA published its Minutes of the July meeting, where members stated that the current monetary policy stance was clearly restrictive and would continue to become more so. The board reportedly recognized the potential need for further tightening and will review the matter at the upcoming August meeting. Additionally, it was noted that the labour market was exceedingly tight and that low productivity was contributing to labour costs. The RBA allegedly expressed a willingness to take any necessary measures to curb inflation.
The AUD/USD is now meeting resistance from the June high of 0.6899 (June 16). Aside from that, the critical 0.7000 level, the weekly high of 0.7029 (February 14), and the 2023 peak of 0.7157 (February 2) are also important targets to watch. If the price goes below the 200-day SMA of 0.6709, it may return to the weekly low of 0.6595 (June 29) before approaching the 2023 low of 0.6458 (May 31). South from here emerges the November 2022 low of 0.6272 (November 3) prior to the 2022 low of 0.6169 (October 13). The daily RSI eased below the 59 area.
Resistance levels: 0.6837 0.6894 0.6920 (4H chart)
Support levels: 0.6787 0.6719 0.6650 (4H chart)
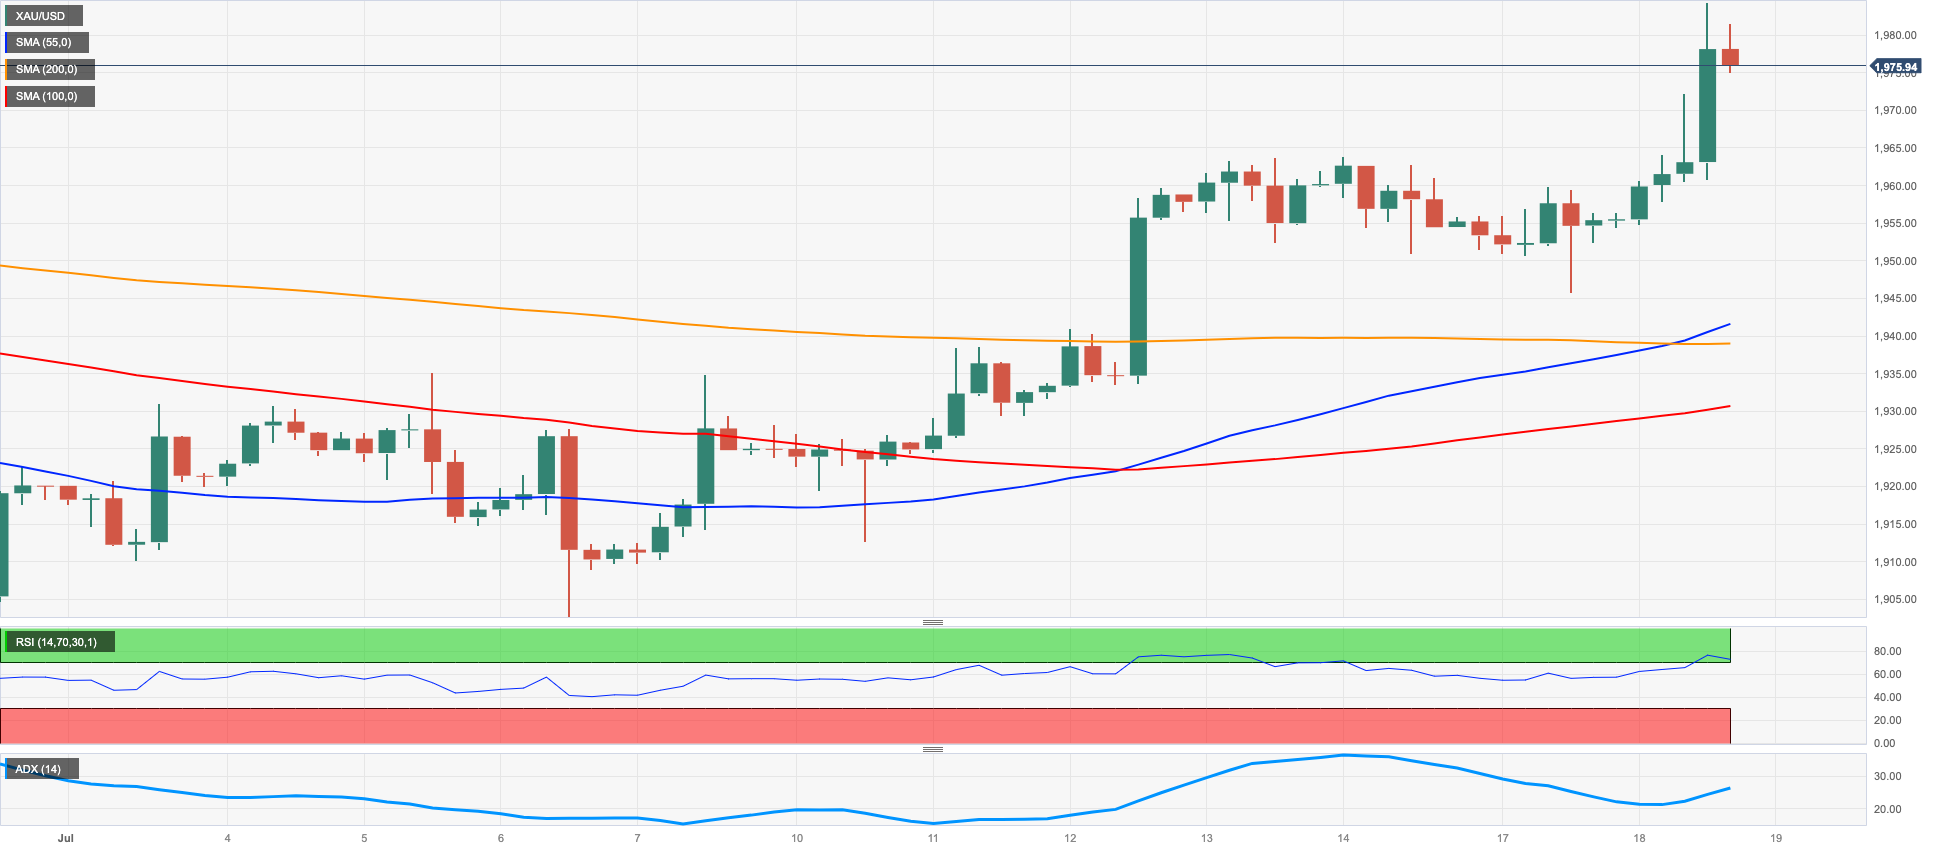
GOLD
Gold prices surged above the critical $1980 per troy ounce level for the first time since mid-May on Tuesday.
Despite the greenback rising, the precious metal showed a powerful rebound, while the continued drop in US yields across the curve likely added to the commodity’s positive momentum.
Moving forward, the Fed's next rate hike decision in July will probably impact which way bullion prices head next, as some speculate that hike could end this cycle of tightening.
The surpass of the July top of $1984 (July 18) should open the door to a probable visit to the crucial $2000 threshold. There will be no significant northward resistance until the 2023 peak of $2067 (May 4), which will come after the 2022 high of $2070 (March 8) and before the all-time top of $2075 (August 7, 2020). Instead, the June low of $1893 (June 29) emerges as the immediate contention ahead of the key 200-day SMA at $1873 and the 2023 low of $1804 (February 28), all prior to the crucial $1800 level.
Resistance levels: $1984 $2022 $2048 (4H chart)
Support levels: $1945 $1912 $1893 (4H chart)
CRUDE WTI
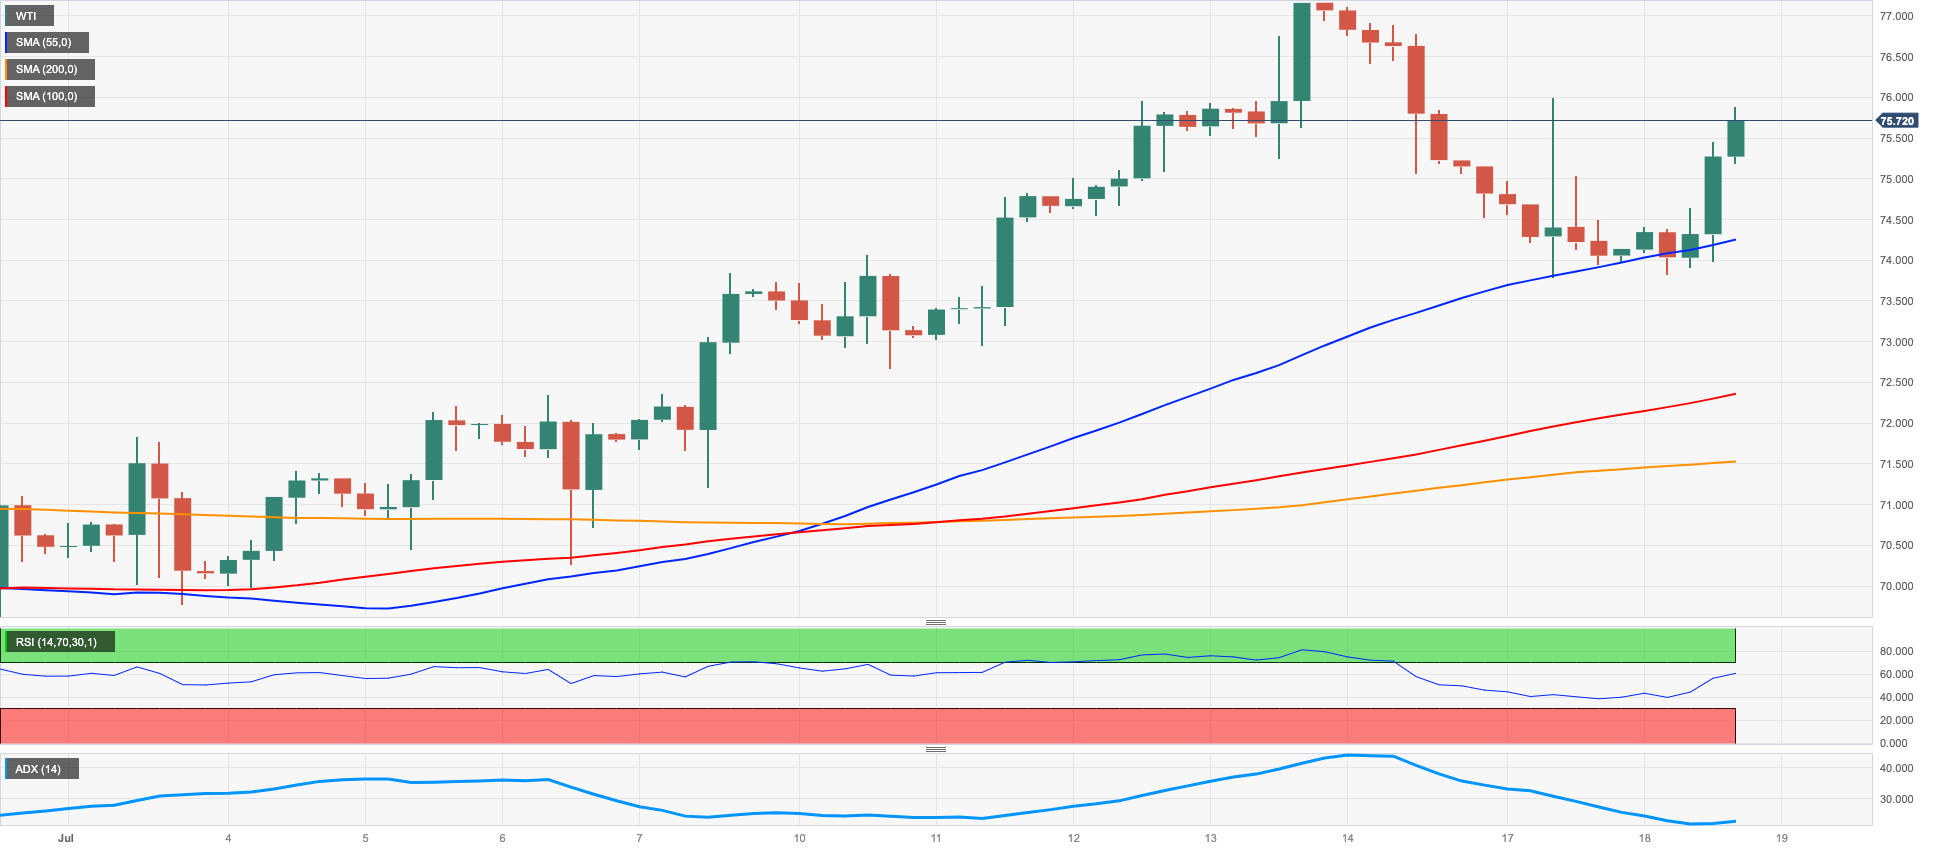
Prices of WTI managed to reverse two consecutive sessions of losses and climb back up to the area above the significant $75.00 per barrel mark on Tuesday.
This rebound in the commodity occurred despite the greenback's improved tone, which caused the USD Index (DXY) to rise above the critical psychological barrier of 100.00, while traders put aside previous concerns stemming from weak results in the Chinese docket released earlier in the week.
Later in the session, the American Petroleum Institute (API) is set to release its report on US crude oil stockpiles for the week ending on July 14th, ahead of the Department of Energy's (DoE) weekly report on Wednesday.
The intermediate 100-day and 55-day SMAs of $73.53 and $71.46, respectively, appear immediately to the downside for WTI. South from here comes the June low of $66.86 (June 13) seconded by the 2023 low of $63.61 (May 4) and the December 2021 low of $62.46 (December 2). Once the latter is breached, the commodity could challenge the key level of $60.00 per barrel. On the contrary, the July top of $77.30 (July 13) emerges as the initial hurdle ahead of the weekly high of $79.14 (April 24) ahead of the crucial $80.00 per barrel barrier before the 2023 top of $83.49 (April 12) and the November 2022 peak of $93.73 (November 7).
Resistance levels: $77.30 $79.14 $81.52 (4H chart)
Support levels: $73.89 $71.46 $70.18 (4H chart)
GER40
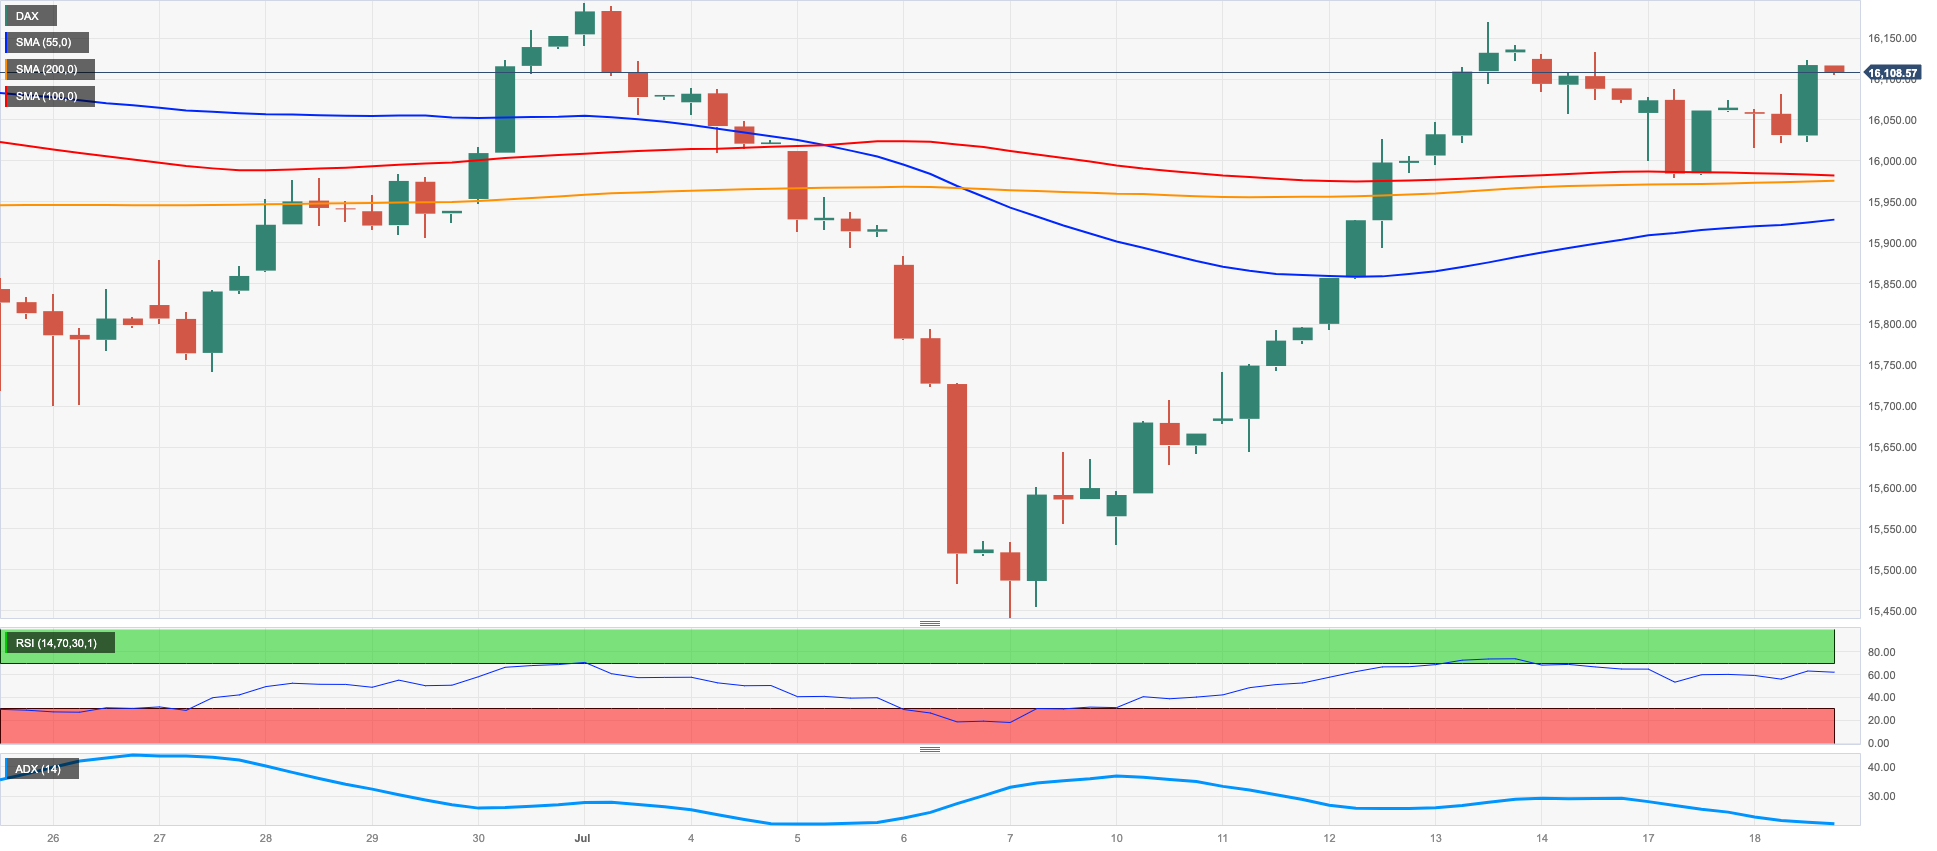
The German blue-chip index DAX logged solid gains above the 16000 mark after two consecutive daily pullbacks on Tuesday.
Investors appear to have brushed aside worries surrounding China and refocused instead on the upcoming interest rate decisions from the ECB and Fed next week, where consensus anticipates quarter-point hikes from both central banks.
Additionally boosting overall sentiment were positive results from earnings season, which helped the DAX sustain the rebound following its July drop to the 15400 area on July 7.
Germany had no economic data releases scheduled for Tuesday, while bonds in the domestic market saw 10-year bund yields plunge sharply to 2.33% - fresh monthly lows.
Immediately to the upside in the DAX40 appears the weekly top at 16185 (July 13) just ahead of the July high of 16209 (July 3), which precedes the all-time high of 16427 (June 16. On the other hand, there is a brief disagreement at the 100-day SMA at 15752, which is above the July low of 15456 (July 7). The loss of the latter could put the key 200-day SMA at 15004 to the test ahead of the March low of 14458 (March 20) and the December 2022 bottom of 13791 (December 20). The daily RSI improved to the boundaries of 56.
Best Performers: Covestro, Zalando SE, Vonovia
Worst Performers: Siemens Healthineers, Deutsche Telekom AG, Dr Ing hc Porsche Prf
Resistance levels: 16185 16209 16427 (4H chart)
Support levels: 15952 15456 14809 (4H chart)
NASDAQ
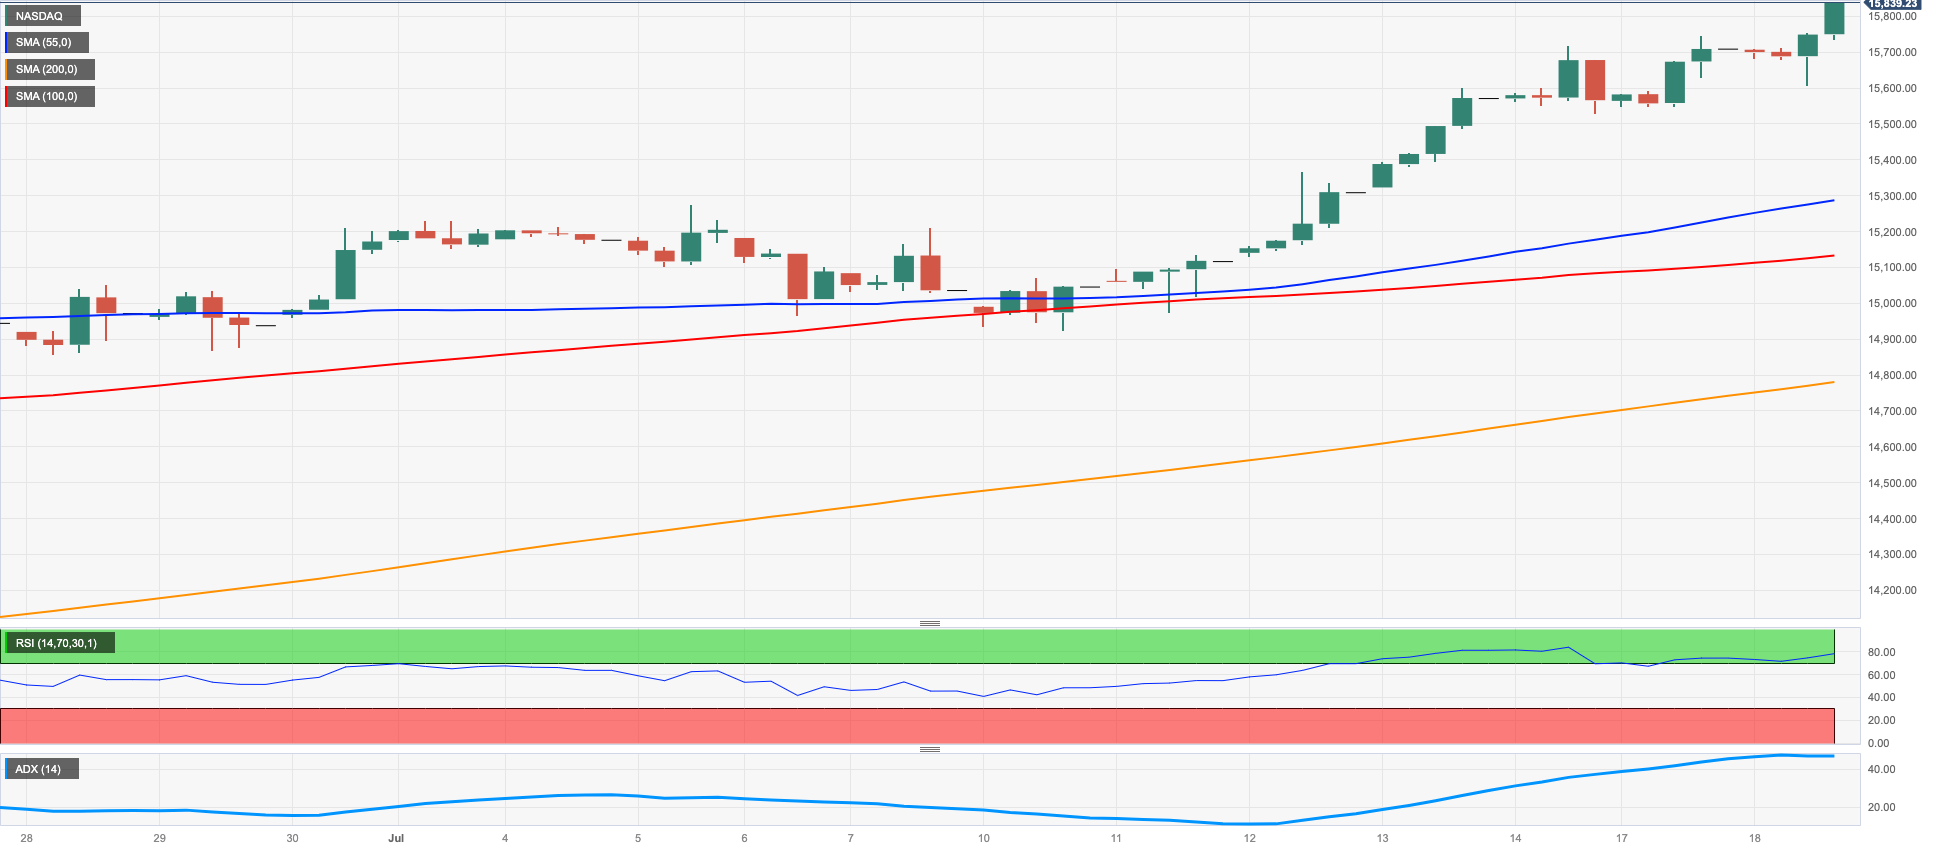
In step with its American counterparts, the tech-heavy Nasdaq 100 index also climbed further and reached fresh peaks in territory last traded in January 2022 just above the 15,800 mark.
The broad cheerfulness on the back of better-than-forecast corporate earnings combined with easing U.S. yields across the curve and persistent speculation that the July Fed hike might represent the final one of the current tightening cycle, collectively reinforced the sturdy upward impulse in the tech gauge, which had been particularly pronounced since early March.
Further north of the 2023 peak of 15812 (July 18), the Nasdaq 100 is then expected to challenge the round milestone of 16000. Initial disagreement, on the other hand, shows at the July low at 14924 (July 10) seconded by the weekly lows of 14687 (June 26), 14283 (June 7), and 13520 (May 24). A further decline might drive the price below the May low of 12938 (May 4), which was followed by the April bottom of 12724 (April 25), the 200-day SMA at 12565, and the March low of 11695 (March 13). The daily RSI pushed further into the overbought territory near 76.
Top Gainers: Sirius XM, Microsoft, Old Dominion Freight Line
Top Losers: JD.com Inc Adr, PDD Holdings DRC, The Trade Desk
Resistance levels: 15798 16017 16607 (4H chart)
Support levels: 14924 14687 14283 (4H chart)
DOW JONES
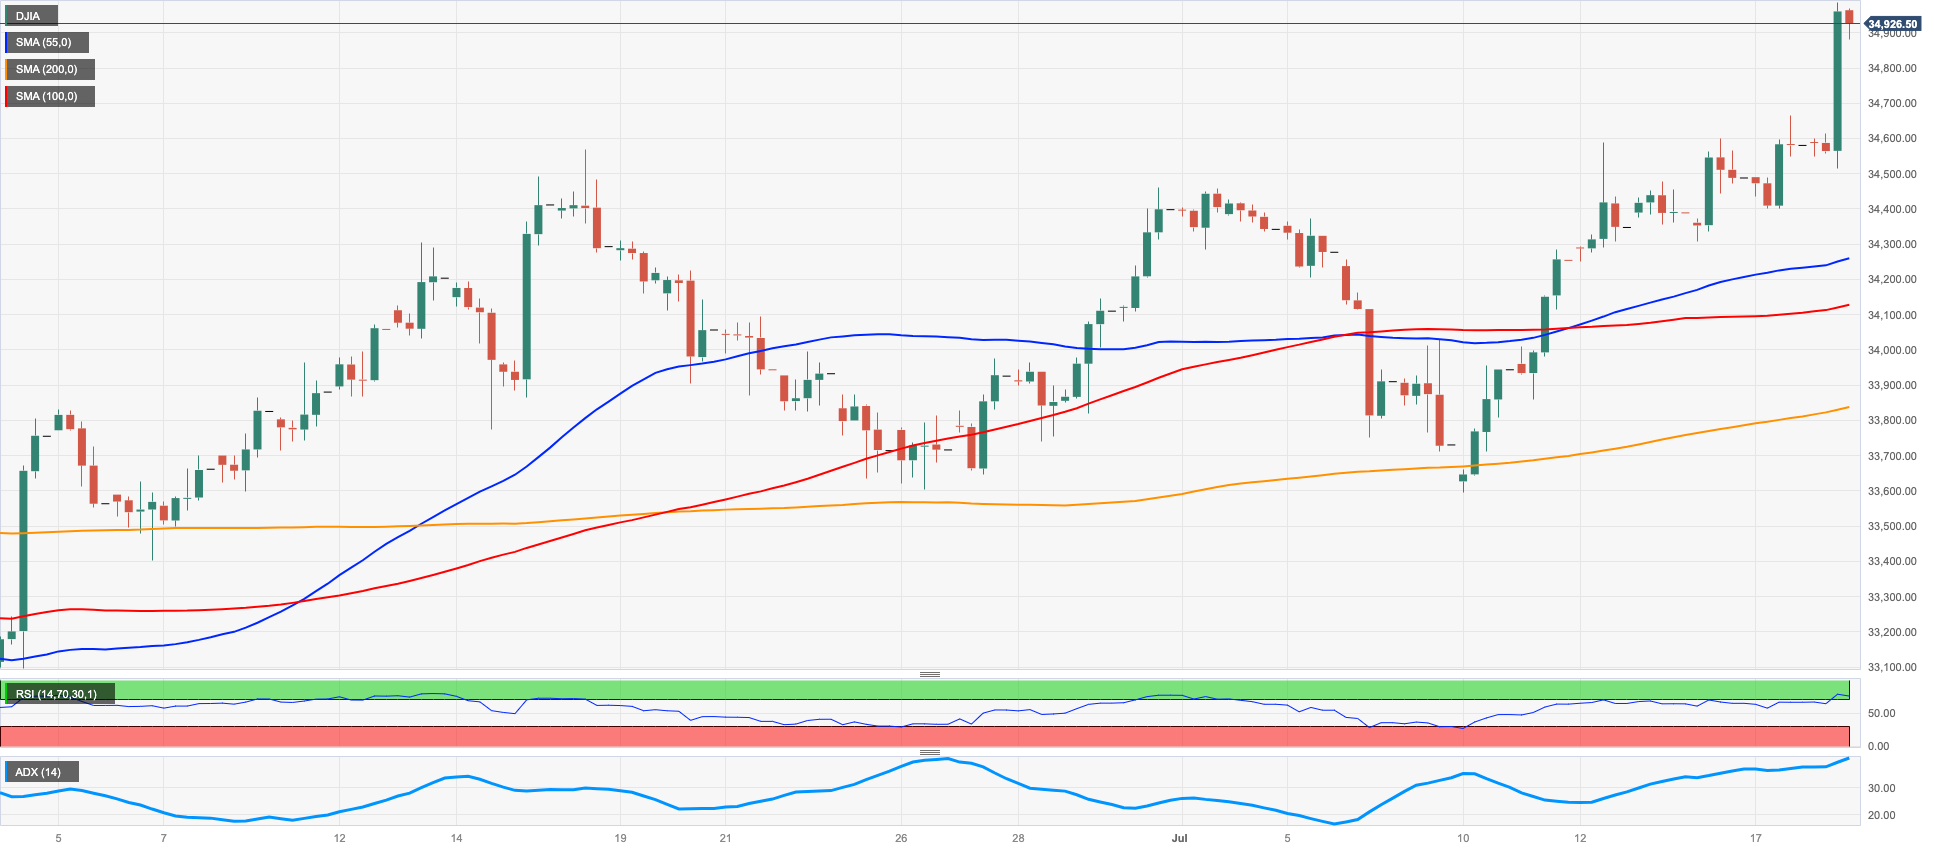
US stocks as measured by the Dow Jones climbed to fresh 2023 peaks just beneath the pivotal 35000 mark on Tuesday, approaching levels last seen in late April.
The positive sentiment among market participants was bolstered by the generally cheerful mood encompassing the US banking industry following better-than-forecast earnings announcements from major financial institutions.
Additionally, the milder-than-anticipated June retail sales number lent fodder to the thesis percolating through trading floors that the Fed may put the brakes on its rate-hiking regimen sooner rather than later.
Overall, the Dow Jones gained 0.88% to 34888, the S&P500 rose 0.53% to 4546, and the tech-heavy Nasdaq Composite advanced 0.63% to 14334.
If the Dow Jones reaches the July 17, 2023 high of 34601, it may attempt to test the December 13, 2022 high of 34712 before shooting for the April 21, 2022 high of 35492. Support is expected to be found around the weekly low of 33610 (June 26), followed by the transitory 100-day SMA of 33399 and the key 200-day SMA of 33111 if the market declines. Lower levels of support include the May low of 32586 (May 25), the March 15 low of 31429, and the October 13 low of 28660 in 2022. The daily RSI increased to around 62.
Top Performers: Microsoft, UnitedHealth, Verizon
Worst Performers: Honeywell, Visa A, Boeing
Resistance levels: 34986 35492 35824 (4H chart)
Support levels: 33705 33399 32586 (4H chart)
MACROECONOMIC EVENTS

All Information & Updates provided by:

All information relating to the financial markets available on this page has been prepared and issued by FXStreet (Forexstreet SL, Spain, Reg: B62498233) on the basis of publicly available information and all information believed to be reliable and does not conflict with Kuwaiti local laws, and all necessary care has been taken to before the company to ensure that the facts mentioned are correct from the source.
NCM Investment nor any of its directors or employees shall in any way be held responsible for the contents of this news, and the information contained on this page is intended only to provide clients with publicly available information and should not be construed as investment advice, report or analysis and/or constitute an offer or invitation to buy or sell financial instruments of any kind.
RISK WARNING: Forex and CFDs are highly risky leveraged products, as losses can exceed deposits. Please ensure you understand all the risks and take independent advice if necessary. NCM will segregate the clients based on the criteria of the regulator and its bylaws. NCM does not provide any advisory service; the material published does not constitute advice or a recommendation for a transaction in any financial instrument. NCM accepts no responsibility for any use of the content presented and any consequences of that use. Anyone acting on the information provided does so at their own risk.