Daily Market Updates
20 Jul 2023
USDJPY
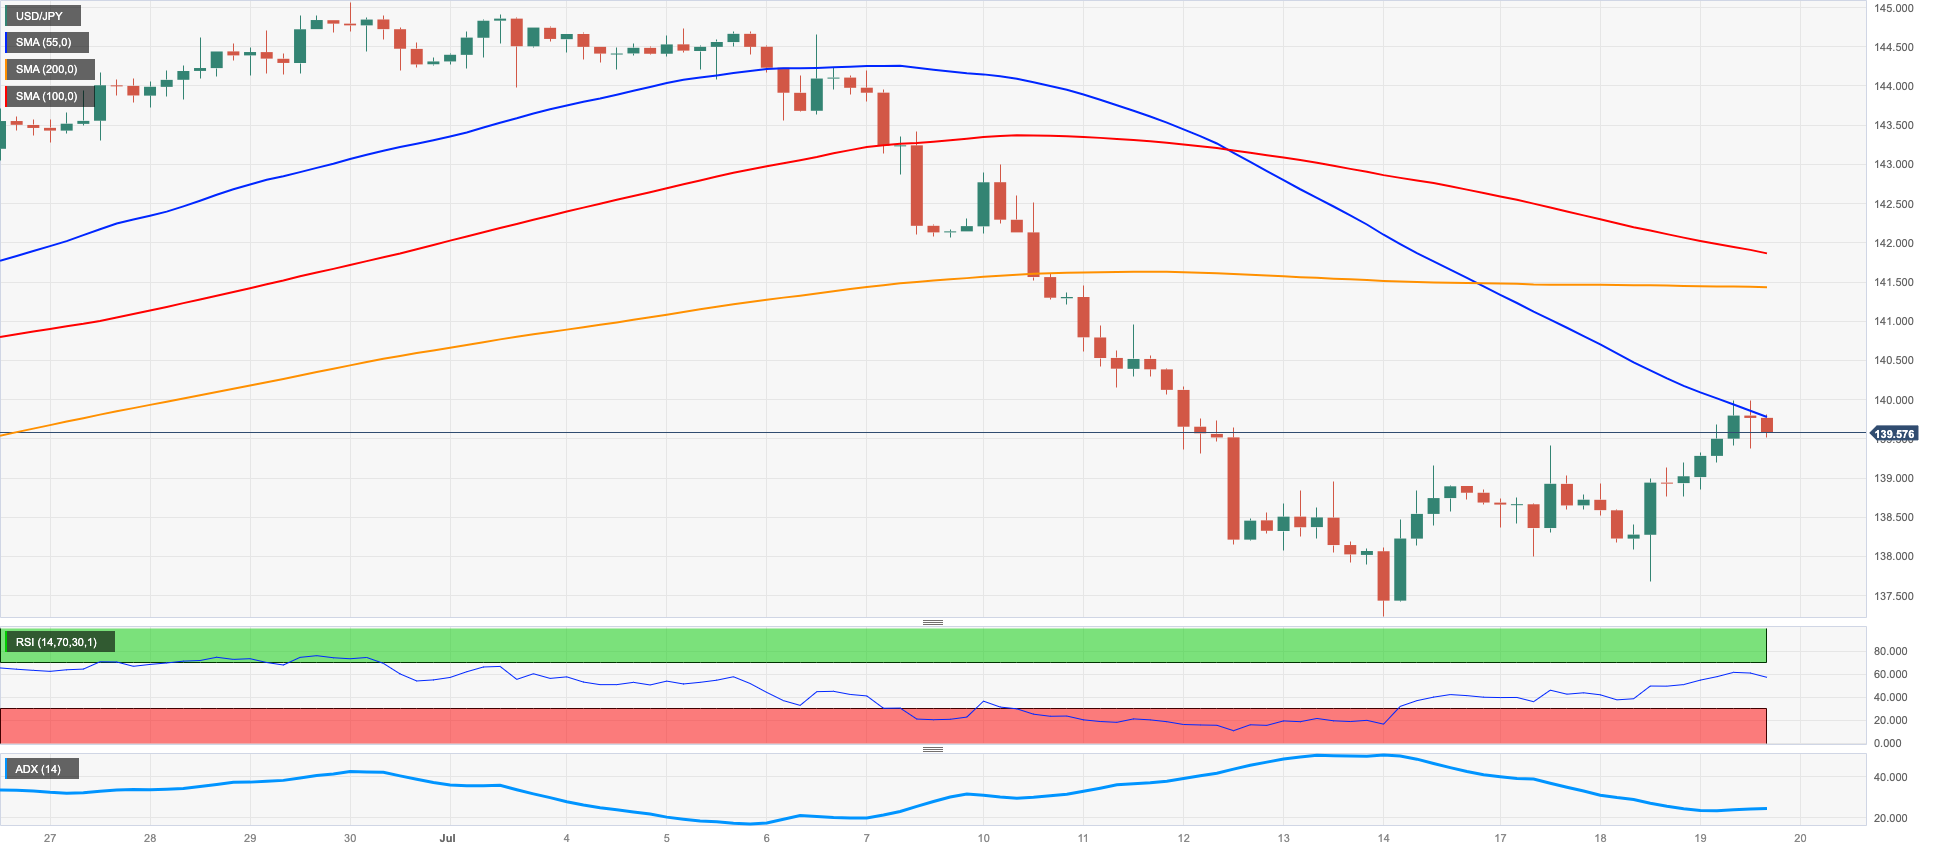
USD/JPY continued its weekly recovery and climbed to the important 140.00 area on Wednesday, which also coincides with the intermediary 55-day SMA.
The pair's daily gains were driven by the greenback's renewed and robust rebound, despite the broad-based negative performance of US yields across the curve. Meanwhile, the JGB 10-year benchmark yield slipped further back in the Japanese bonds market and revisited the 0.45% region.
The yen's decline was further amplified after BoJ Governor K. Ueda announced that the central bank will maintain its current monetary policy for now, as it continues to strive towards its 2% inflation target. He also stated that the bank will regularly assess the situation at each policy meeting and that unless there is a shift in the premise, the overall policy will remain unchanged.
In Japan, the Reuters Tankan Index for the month of July fell to 3 from 8, indicating a deflationary trend.
Immediately to the upside, USD/JPY should initially challenge the 2023 high of 145.07 (June 30) seconded by the 2022 top of 151.94 (October 21), and ultimately the round level of 152.00. Having said that, if bears regain the upper hand, additional losses might push the pair back to the July low of 137.23 (July 14), which precedes the key 200-day SMA of 136.96. If the pair continues to decline, the weekly low of 133.01 (April 26) and minor support of 132.01 (April 13) may provide additional support before the April low of 130.62 (April 5) and critical round mark of 130.00. The RSI for the day approached the 43 hurdle.
Resistance levels: 139.99 141.39 143.00 (4H chart)
Support levels: 137.67 137.23 133.74 (4H chart)
GBPUSD
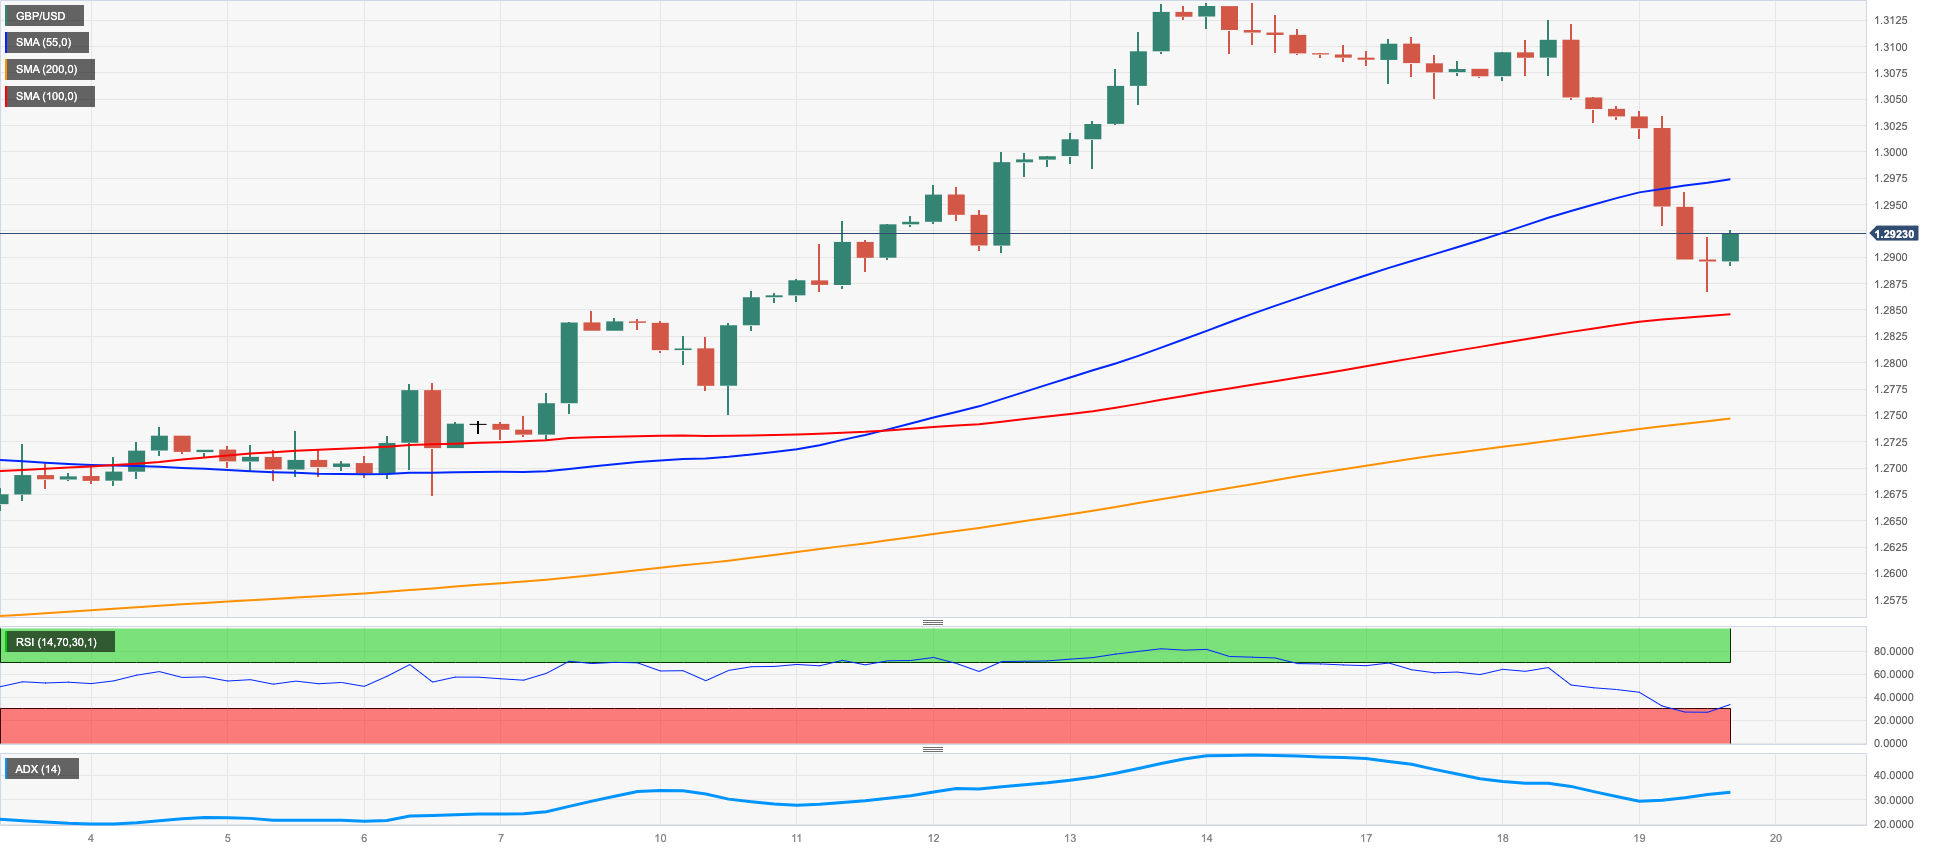
The British pound continued to face selling pressure without any relief, as GBP/USD experienced its fourth consecutive daily decline, breaking below the crucial support level at 1.2900.
This downward movement was driven by a stronger dollar and unexpected negative surprise from inflation figures in the UK, which proved to be too much for the quid. As a result, Cable experienced a significant decline of over 1% in an environment that favored safe-haven assets.
The decline in the pair was also accompanied by a retracement in the UK 10-year gilt yields, reaching levels not seen since early June, at around 4.15%.
Expectations of aggressive interest rate hikes by the BoE have diminished due to weak economic data. Looking ahead, 25 bps hikes in September and November are still anticipated but after that, the maximum chance of one final 25 bps increase is only around 55% in February. This revised potential rate path would see the bank rate peak in the 5.75% to 6.0% range compared to 6.25% at the start of this week and 6.5% at the start of last week. This substantial downward revision has significantly weighed on the quid on Wednesday.
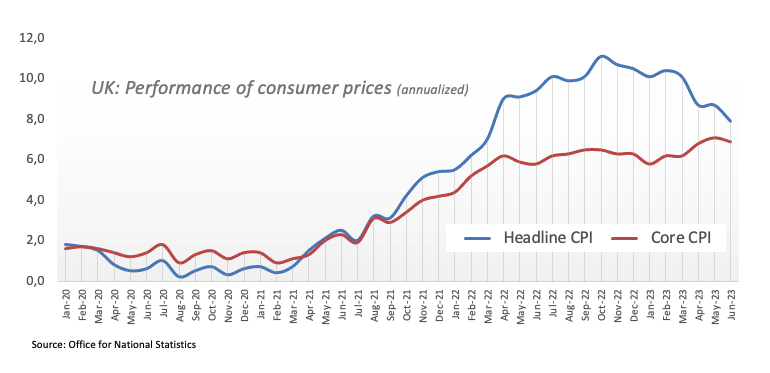
In the UK, the headline CPI rose at an annualized 7.9% during last month and 6.9% when it came to the Core print.
Extra losses in GBP/USD could see the intermediate 55-day SMA at 1.2638 revisited ahead of the weekly low of 1.2590 (June 29). The breakdown of the later exposes a move to the 1.2530 zone, which corresponds to the 2021-2023 trend line. The June low of 1.2368 (June 5), the May low of 1.2308 (May 25), and the April low of 1.2274 (April 3) follow. Down from here emerges the key 200-day SMA of 1.2228. On the upside, if the 2023 high of 1.3142 (July 14) is broken, spot might then target the weekly highs of 1.3146 (April 14, 2022) and 1.3298 (March 23, 2022). The daily RSI dropped below the 57 yardstick.
Resistance levels: 1.2963 1.3142 1.3166 (4H chart)
Support levels: 1.2867 1.2750 1.2591 (4H chart)
AUDUSD
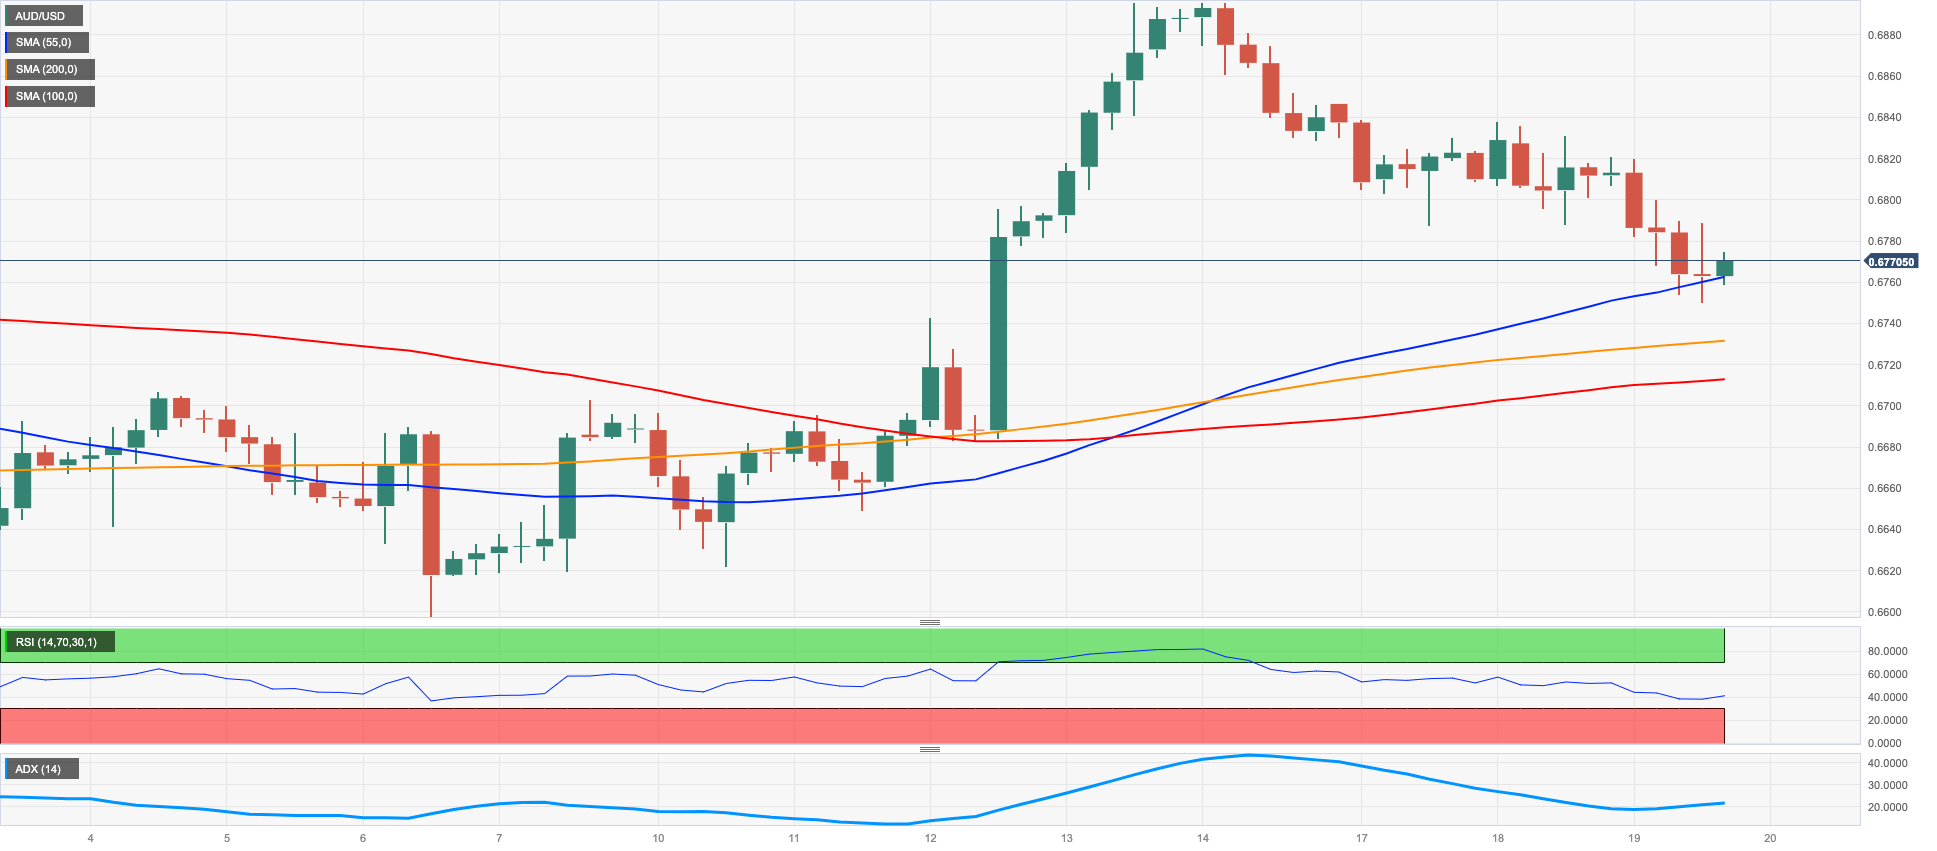
The dollar's sharp rise weighed on risk assets and high-beta currencies alike, dragging the AUD/USD pair down to the mid 0.6700s or its lowest point in 5 days on Wednesday.
Additionally, broad weakness across commodities in general also worked against any attempted rebound for the Aussie, which continued to suffer from a lack of positive developments regarding economic recovery in China.
In Australia, the Westpac Leading Index edged up 0.1% MoM in June in the sole data release on Wednesday.
If losses in AUD/USD accelerate, the next support of relevance is expected at the key 200-day SMA of 0.6711 ahead of the weekly low of 0.6595 (June 29) and the 2023 low of 0.6458 (May 31). The November 2022 low of 0.6272 (November 3) appears south of here, prior to the 2022 low of 0.6169 (October 13). On the contrary, initial resistance is seen at the June high of 0.6899 (June 16) prior to the 0.7000 level, the weekly peak of 0.7029 (February 14), and the 2023 top of 0.7157 (February 2). The everyday RSI dropped to the sub-54 region.
Resistance levels: 0.6837 0.6894 0.6920 (4H chart)
Support levels: 0.6750 0.6650 0.6599 (4H chart)
GOLD
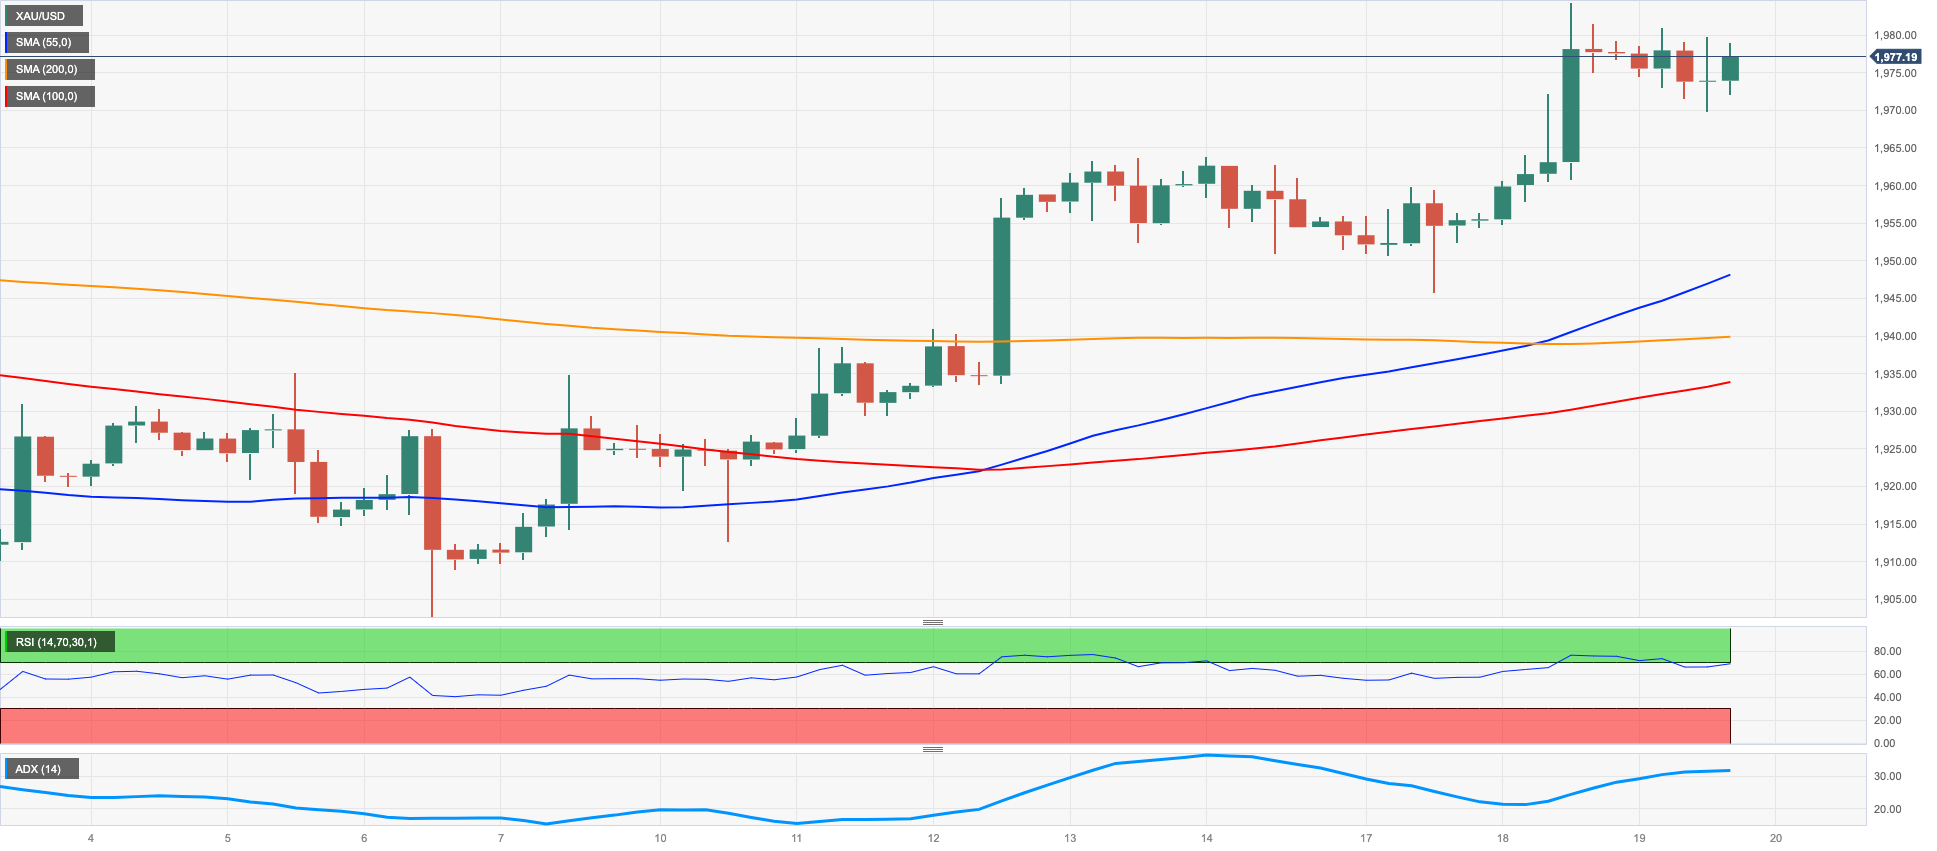
Gold prices traded in a narrow range around $1980 a troy ounce during the middle of the week. The metal had climbed to a multi-week high around $1985 at the start of the week, but then pulled back slightly.
The price action of the precious metal was influenced by the sharp recovery in the dollar, the ongoing decline in US yields across the curve, and rising market chatter about the likelihood that the Federal Reserve could end its current hiking cycle sooner than initially anticipated.
If gold breaks above the July high of $1984 (July 18) it could pave the way for a possible visit to the critical $2000 level. There will be no strong northward resistance until the 2023 peak of $2067 (May 4), which follows the 2022 high of $2070 (March 8) and before the all-time top of $2075 (August 7, 2020). Instead, the June low of $1893 (June 29) appears as the immediate contender, followed by the critical 200-day SMA at $1875 and the 2023 low of $1804 (February 28), all before the vital $1800 level.
Resistance levels: $1984 $2022 $2048 (4H chart)
Support levels: $1969 $1945 $1912 $1893 (4H chart)
CRUDE WTI
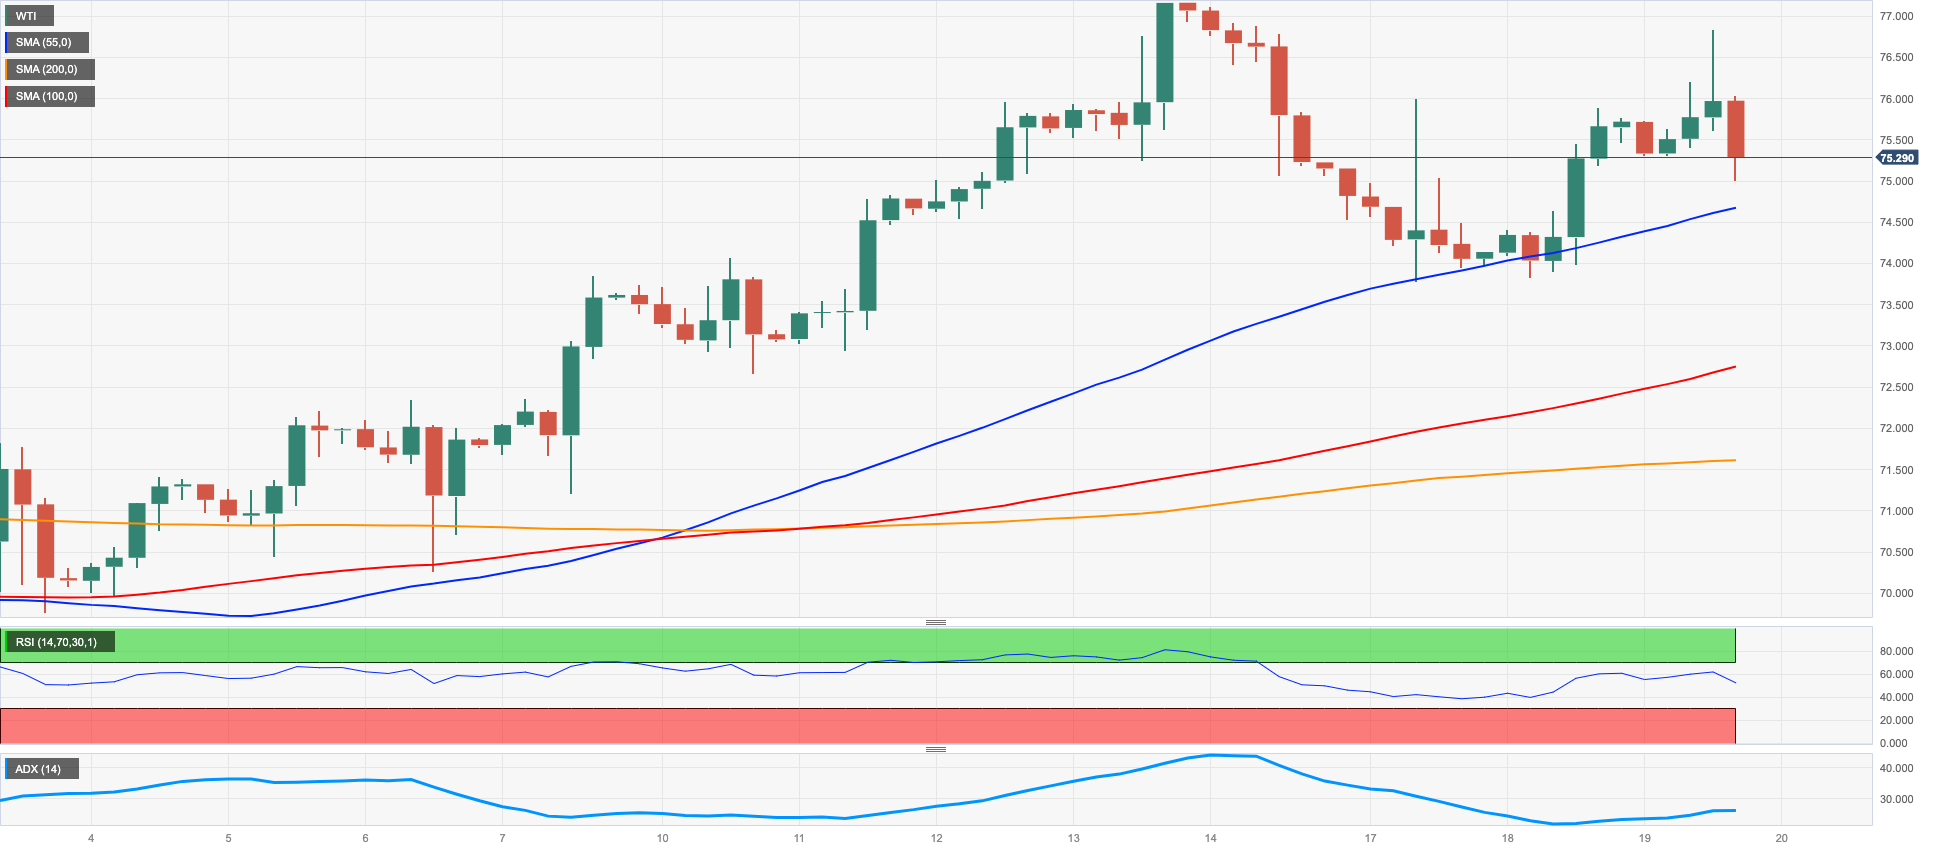
After rising to the vicinity of the key 200-day SMA near $77.00, WTI prices started to pull back on Wednesday, declining to the area just above the $75.00 mark per barrel.
The choppy price action in crude oil came on the back of the stronger dollar, while expectations that the Federal Reserve could soon end its tightening campaign and the Chinese economy could finally start to recover appeared to have limited the downside for the commodity during the middle of the week.
In the calendar, there was no reaction to the weekly report by the EIA on US crude oil inventories. In fact, the agency reported that US crude oil inventories shrank by 0.708M barrels in the week to July 14, while supplies at Cushing dropped by 2.891M barrels, Weekly Distillate Stocks rose by 0.014M barrels and gasoline stockpiles went down by 1.066M barrels.
The surpass of the July high of $77.30 (July 14) reveals a likely rise to the weekly top of $79.14 (April 24) prior to the critical $80.00 per barrel barrier. The continuation of the upside could see the 2023 peak of $83.49 (April 12) revisited before the November 2022 high of $93.73 (November 7). On the other hand, a drop below the weekly low of $73.89 (July 17) should expose interim contention levels at the 100-day and 55-day SMAs of $73.52 and $71.53, respectively, ahead of the June low of $66.86 (June 13) and the 2023 low of $63.61 (May 4). South from here comes the December 2021 low of $62.46 (December 2) and the critical level of $60.00 per barrel.
Resistance levels: $76.83 $77.30 $79.14 (4H chart)
Support levels: $73.81 $71.57 $70.18 (4H chart)
GER40
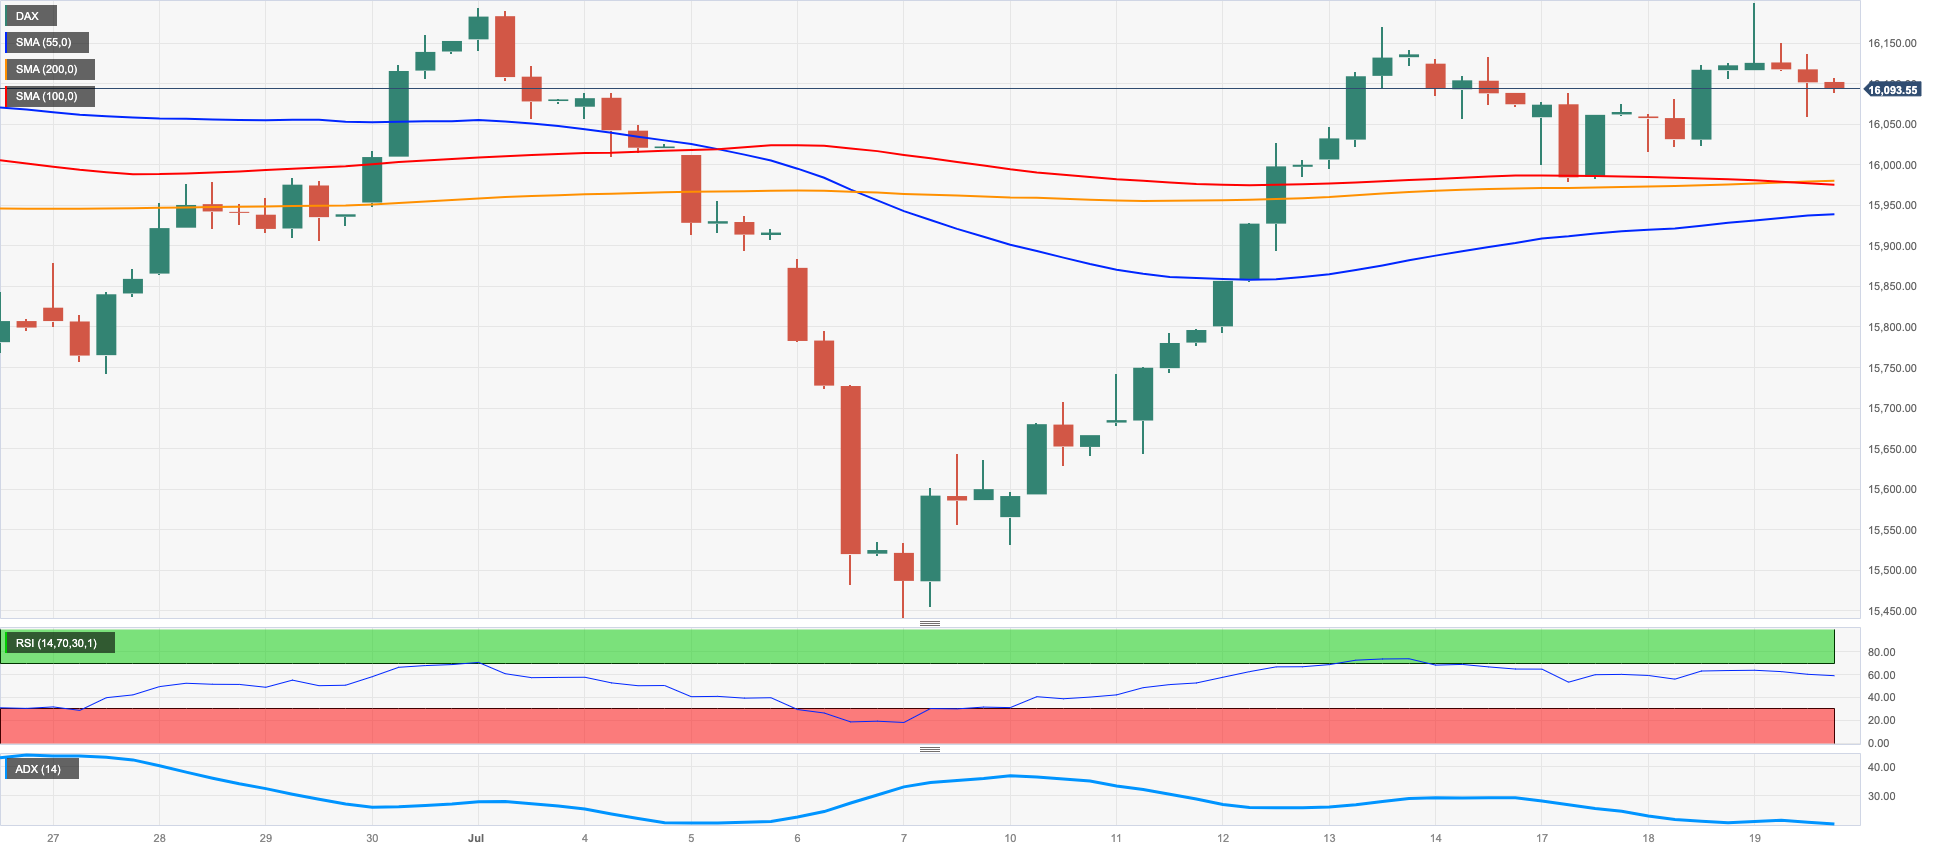
German stocks posted slight losses on Wednesday, as the benchmark DAX40 index tracked a mixed tone across European equities. Despite the daily decline, the index managed to hold above the key 16000 level.
Lower-than-expected inflation figures in the UK boosted investor sentiment, while final Euroland CPI readings for June also confirmed the downward trend seen earlier, both adding to the sense that major central banks' interest rate hiking cycles may be nearing an end.
In the fixed income space, German bond yields reversed earlier falls and closed the session higher, with the 10-year bund yield climbing back near the 2.40% mark.
The weekly top at 16240 (July 19) shows immediately to the upside on the DAX40 just ahead of the all-time high of 16427 (June 16). However, there is a momentary dispute at the 100-day SMA of 15761, which is above the July low of 15456 (July 7). The loss of the latter might put the important 200-day SMA at 15022 to the test before the March low of 14458 (March 20) and the December 2022 low of 13791 (December 20). The daily RSI remained flattish around 56.
Best Performers: Vonovia, Sartorius AG VZO, Zalando SE
Worst Performers: Covestro, Daimler Truck Holding, Munich Re Group
Resistance levels: 16240 16427 17000? (4H chart)
Support levels: 15761 15456 14809 (4H chart)
NASDAQ
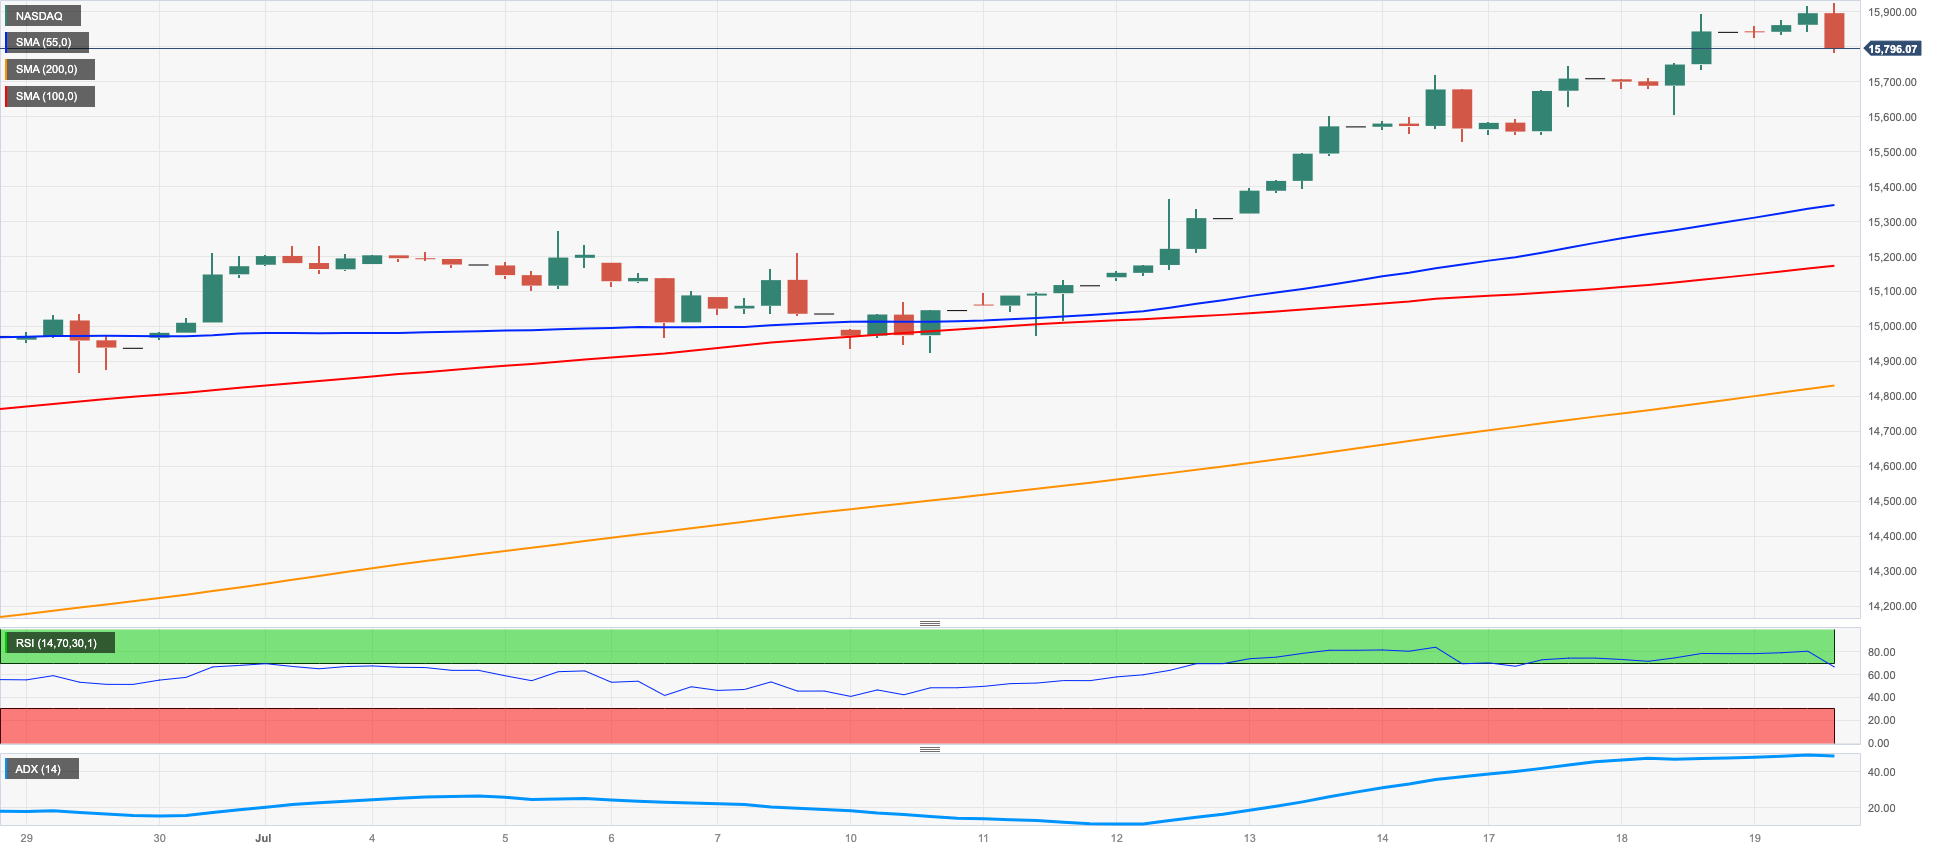
After reaching a new high in 2023 at around 15900, the technology benchmark Nasdaq 100 experienced some slight downward pressure and ended Wednesday's trading session with a slightly defensive position.
Traders were cautious throughout the session on Wall Street, likely in anticipation of earnings reports from electric vehicle maker Tesla and streaming giant Netflix, both of which were scheduled to be released after markets closed on Wednesday.
The tech index experienced mild losses, which were compounded by a strong rebound in the US dollar. However, hopes are rising that the Federal Reserve's July interest rate hike may be the last one of the current cycle, which helped to limit the downside.
The Nasdaq 100 is likely to test the round milestone of 16000 farther north of the 2023 top of 15812 (July 18). Initial dissatisfaction may be seen at the July low of 14924 (July 10), followed by weekly lows of 14687 (June 26), 14283 (June 7), and 13520 (May 24). A further drop may push the price below the May low of 12938 (May 4), which was followed by the April low of 12724 (April 25), the 200-day SMA at 12565, and the March low of 11695 (March 13). The daily RSI moved into overbought territory around 76.
Top Gainers: Lucid Group, Warner Bros Discovery, Zscaler
Top Losers: Align, ASML ADR, DexCom
Resistance levels: 15932 16017 16607 (4H chart)
Support levels: 14924 14687 14283 (4H chart)
DOW JONES
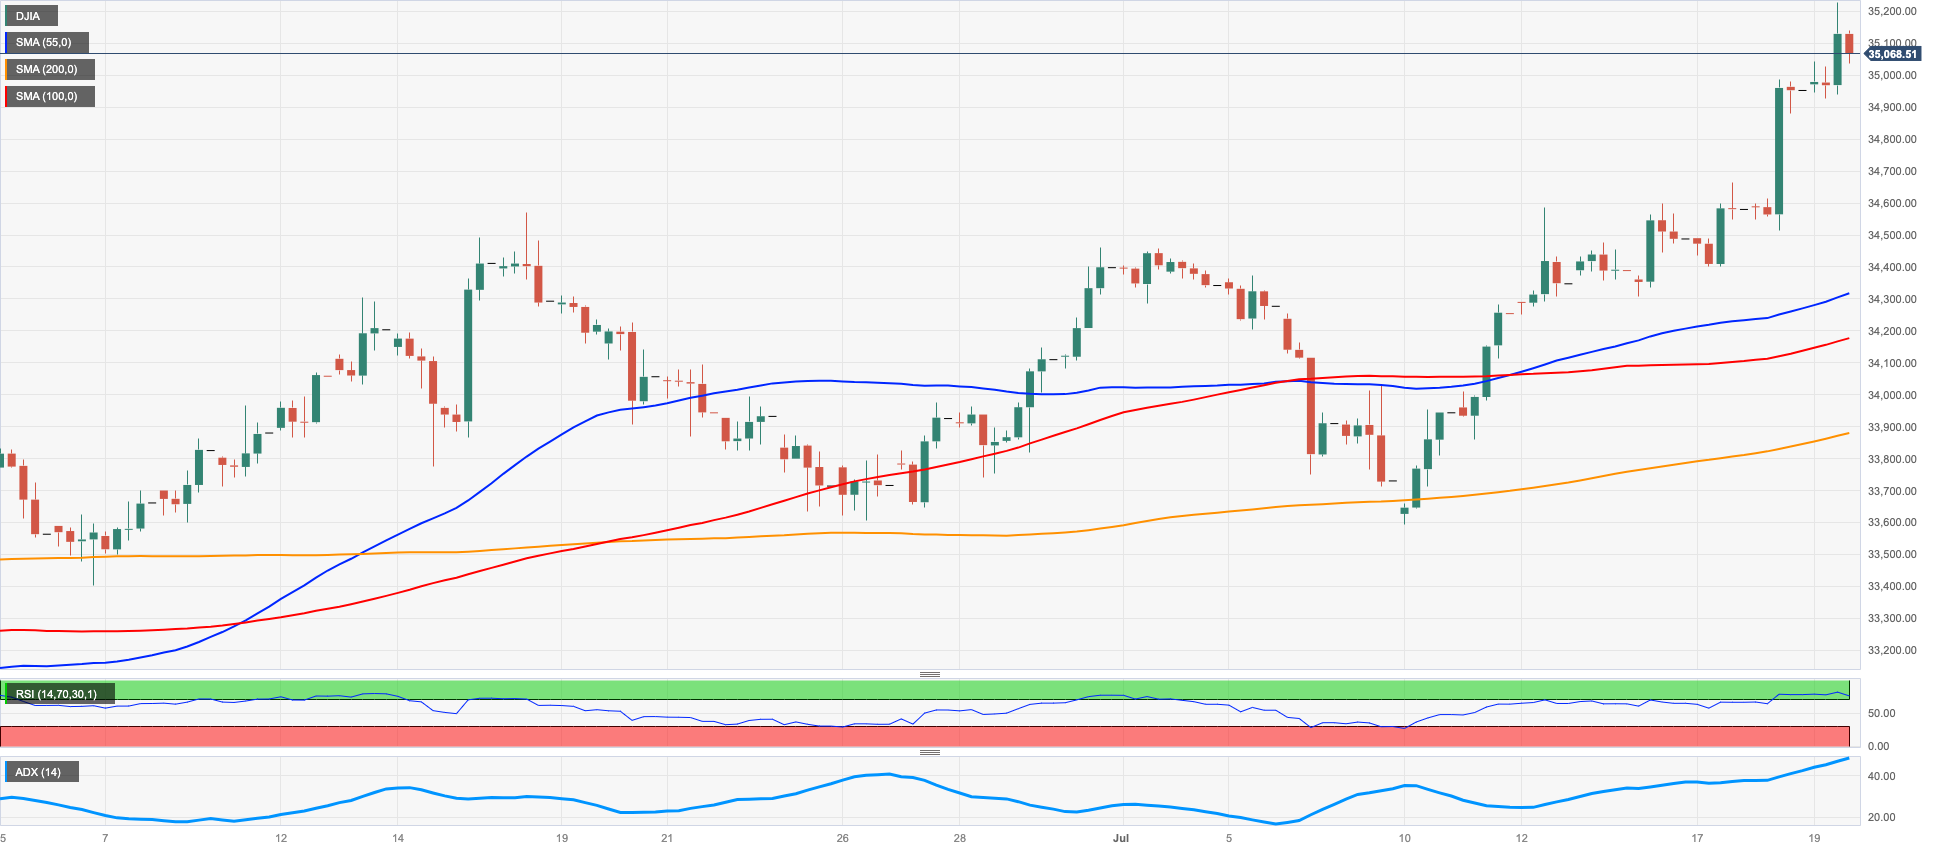
On Wednesday, US equities, as measured by the Dow Jones, continued their impressive upward trend for the month, reaching new record highs for 2023, surpassing the 35000 mark.
This surge in the stock market was fueled by a widespread sense of optimism among investors. The positive sentiment was further strengthened by the release of better-than-expected corporate earnings results on the same day.
Additionally, there was growing speculation that the Federal Reserve might end its normalization program earlier than originally anticipated, which provided an additional boost to the market outlook.
On the whole, the Dow Jones advanced 0.37% to 25088, the S&P500 gained 0.20% to 4564, and the tech-focused Nasdaq Composite dropped 0.05% to 14344.
If the Dow Jones surpasses the 2023 high of 35234 (July 19), it may attempt to challenge the April 2022 high of 35492 (April 21) ahead of the February 2022 top at 35824 (February 9). On the opposite side, the interim 55-day SMA at 33771 is expected to provide initial support ahead of the weekly low of 33610 (June 26), and the transitory 100-day SMA of 33437. The breach of this region exposes the crucial 200-day SMA of 33167 ahead of the May low of 32586 (May 25) and the 2023 low of 31429 (March 15). The daily RSI flirted with the overbought territory near 70.
Top Performers: Verizon, Salesforce Inc, Cisco
Worst Performers: Microsoft, Boeing, American Express
Resistance levels: 35234 35492 35824 (4H chart)
Support levels: 34174 33705 33428 (4H chart)
MACROECONOMIC EVENTS


