
- Contact Us:
-

-

-

-


Daily Market Updates
21 Jul 2023
USDJPY
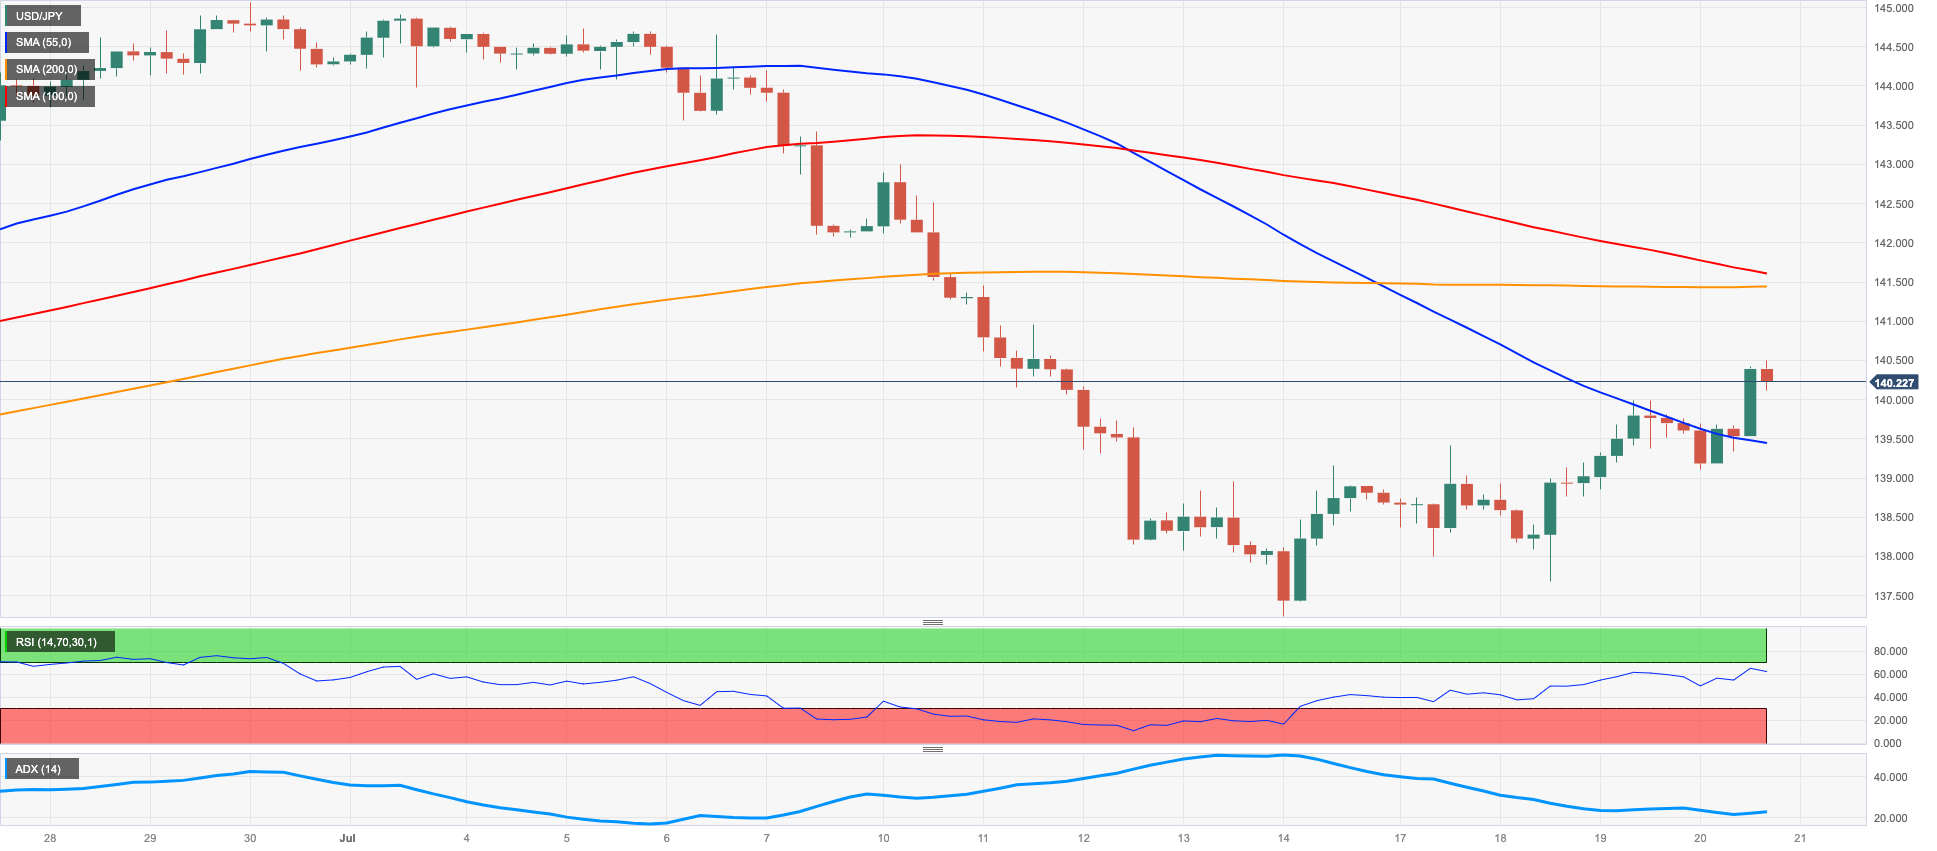
The continuation of the strong recovery in the greenback, coupled with the marked rebound in US yields across the curve, sponsored the fifth session in a row with gains in USD/JPY, this time trespassing the key 140.00 mark.
Extra selling pressure hurting the Japanese currency also came from recent comments from BoJ Governor K. Ueda, who hinted at the idea that the current ultra-accommodative stance is expected to remain unchanged for the time being against speculation of a potential announcement regarding the Yield Curve Control (YCC) at the bank’s upcoming meeting next week.
In Japan, the trade surplus came in at ¥43Bin June, with Exports up 1.5% YoY and Imports down 12.9% YoY.
There are no resistance levels of note for USD/JPY prior to the 2023 high of 145.07 (June 30), followed by the 2022 top of 151.94 (October 21), and finally the round level of 152.00. However, if bears regain control, further losses may drive the pair back to the July low of 137.23 (July 14), which is just above the crucial 200-day SMA of 136.93. Down from here comes the weekly low of 133.01 (April 26) and a minor support of 132.01 (April 13) before the April low of 130.62 (April 5) and the important round mark of 130.00. The RSI for the day leapt past 48.
Resistance levels: 140.49 141.37 143.00 (4H chart)
Support levels: 137.67 137.23 133.74 (4H chart)
GBPUSD
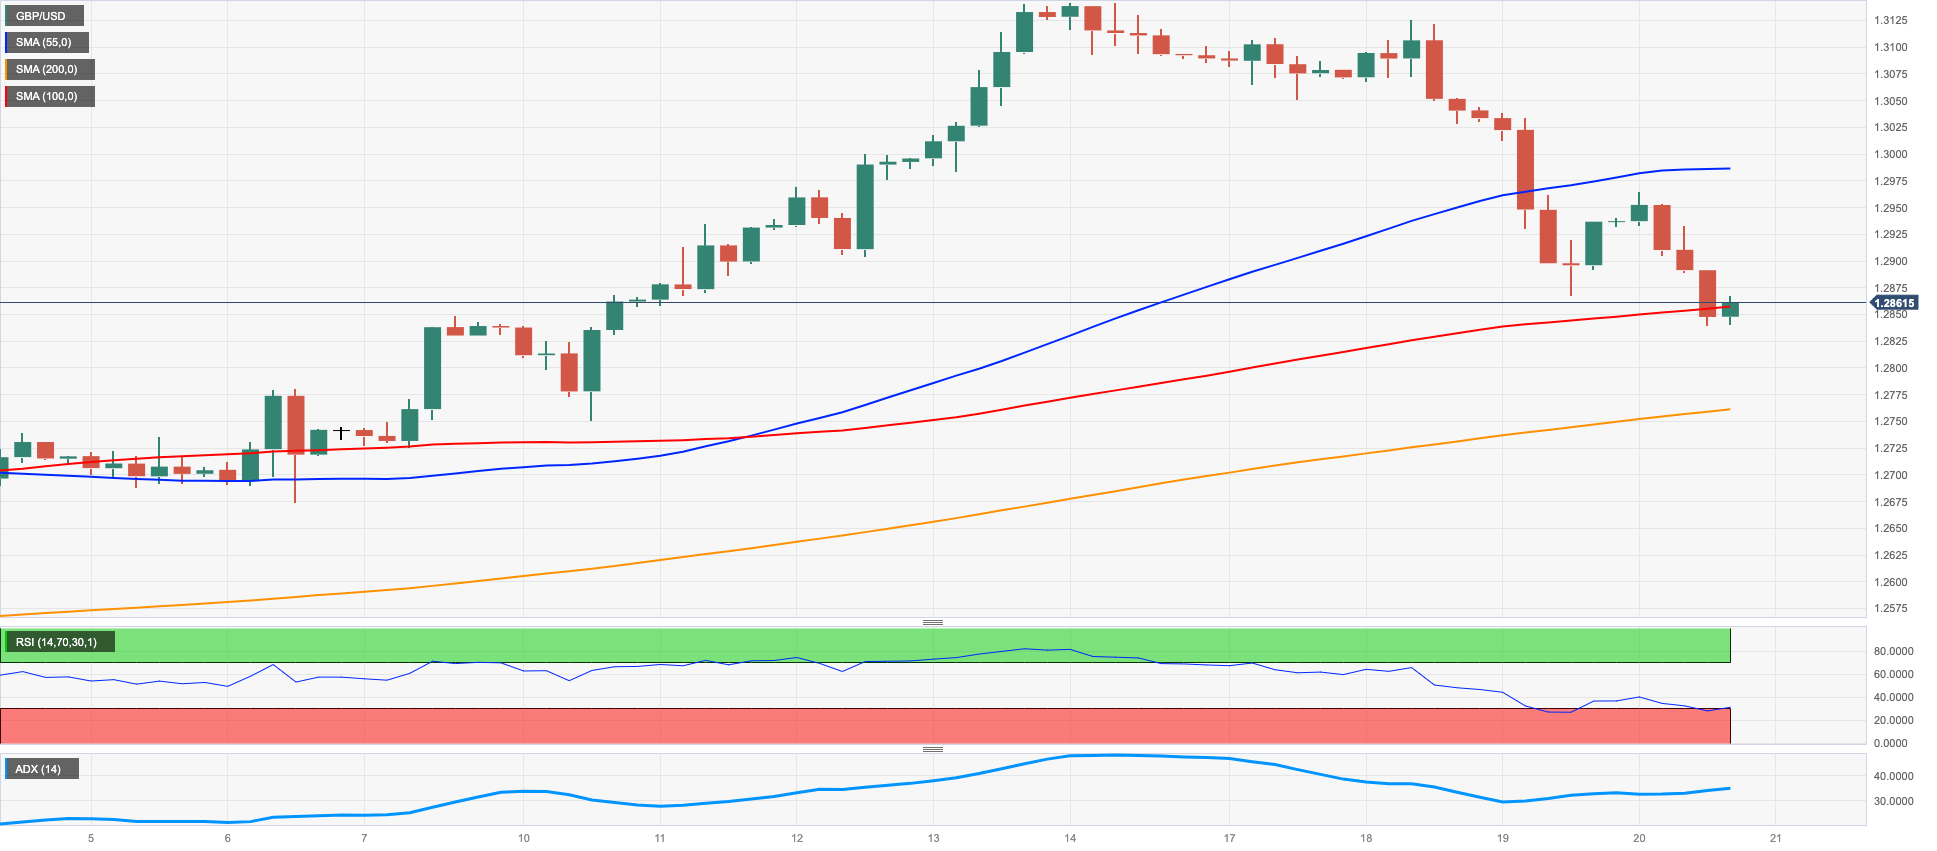
GBP/USD kept the downward correction well in place for the fifth consecutive session on Thursday, this time breaking below the 1.2900 support with marked conviction to print fresh multi-day lows near 1.2830.
The pronounced decline in Cable came almost exclusively in response to the equally acute bounce in the greenback, while investors’ repricing of a now lower interest rate peak by the BoE also weighed on the quid.
Regarding the latter, expectations of a half-point rate increase in August diminished somewhat following the UK inflation figures, while 25 bps hikes in September and November are still anticipated. However, after that, the highest likelihood of one final 25 bp increase is roughly 65% in February. This potential revised rate path would see the bank rate peak in the range of 5.75% to 6.0%, compared to the previously projected 6.25%.
There were no data releases in the UK calendar on Thursday.
If the GBP/USD falls further, the intermediate 55-day SMA at 1.2644 may be reviewed ahead of the weekly bottom of 1.2590 (June 29). The latter's breakdown reveals a move to the 1.2530 zone, which corresponds to the 2021-2023 trend line. Following that is the June low of 1.2368 (June 5), the May low of 1.2308 (May 25), and the April low of 1.2274 (April 3), all ahead of the critical 200-day SMA of 1.2236. On the flip side, if the 2023 top of 1.3142 (July 14) is broken, spot may then aim for the weekly highs of 1.3146 (April 14, 2022) and 1.3298 (March 23, 2022). The daily RSI slipped back to the 52 zone.
Resistance levels: 1.2964 1.3142 1.3166 (4H chart)
Support levels: 1.2839 1.2750 1.2591 (4H chart)
AUDUSD
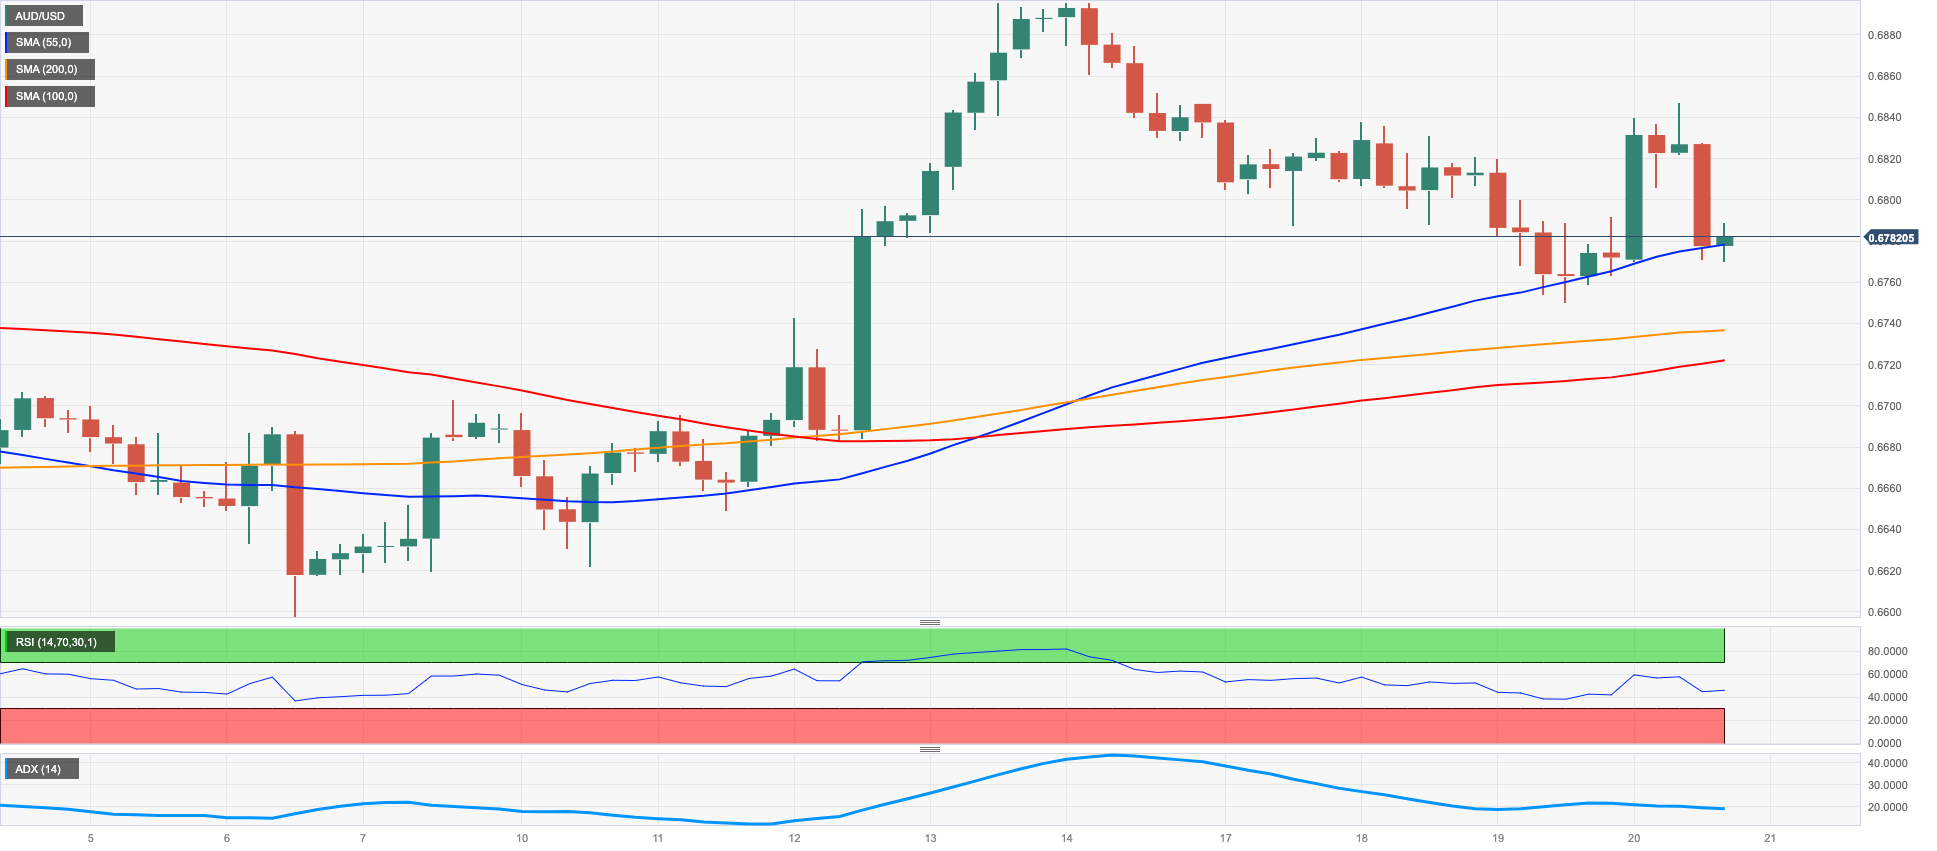
Following the earlier bull run to the mid-0.6800s, AUD/USD gave away practically all those gains and receded to the 0.6770 region, where it attempted to settle towards the end of the NA session on Thursday.
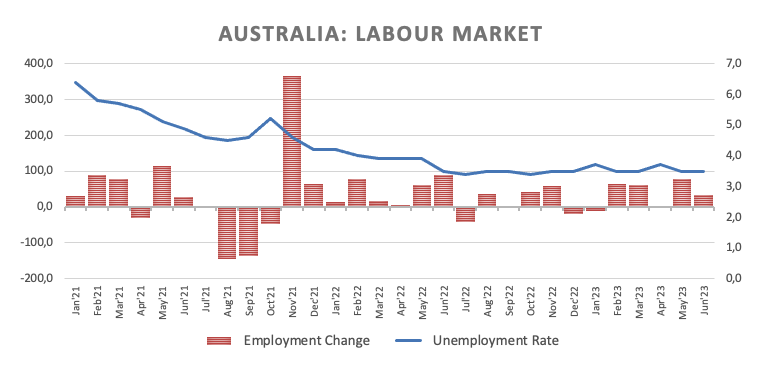
The initial strength in the Aussie dollar followed the better-than-expected jobs report for the month of June in Australia, although the pair eventually succumbed to the dollar’s strength.
Somewhat limiting the downside appeared a mild bounce in the commodity complex, while the prospects of further easing by the PBoC resurged on the horizon after Chinese commercial lenders kept their 1-year and 5-year Loan Prime Rates (LPR) unchanged early in the Asian trading hours.
In Oz, the Employment Change increased by 32.6K individuals, and the Unemployment Rate held steady at 3.5%.
If the AUD/USD breaks below the weekly low of 0.6750 (July 19), it could then challenge the important 200-day SMA of 0.6714, ahead of the weekly low of 0.6595 (June 29) and the 2023 low of 0.6458 (May 31). The November 2022 low of 0.6272 (November 3) occurs south of here, prior to the 2023 low of 0.6169 (October 13). On the contrary, before to the 0.7000 level, first resistance is indicated around the June high of 0.6899 (June 16). Further north aligns the weekly peak of 0.7029 (February 14), and the 2023 top of 0.7157 (February 2). The daily RSI looked flattish around 55.
Resistance levels: 0.6846 0.6894 0.6920 (4H chart)
Support levels: 0.6750 0.6650 0.6599 (4H chart)
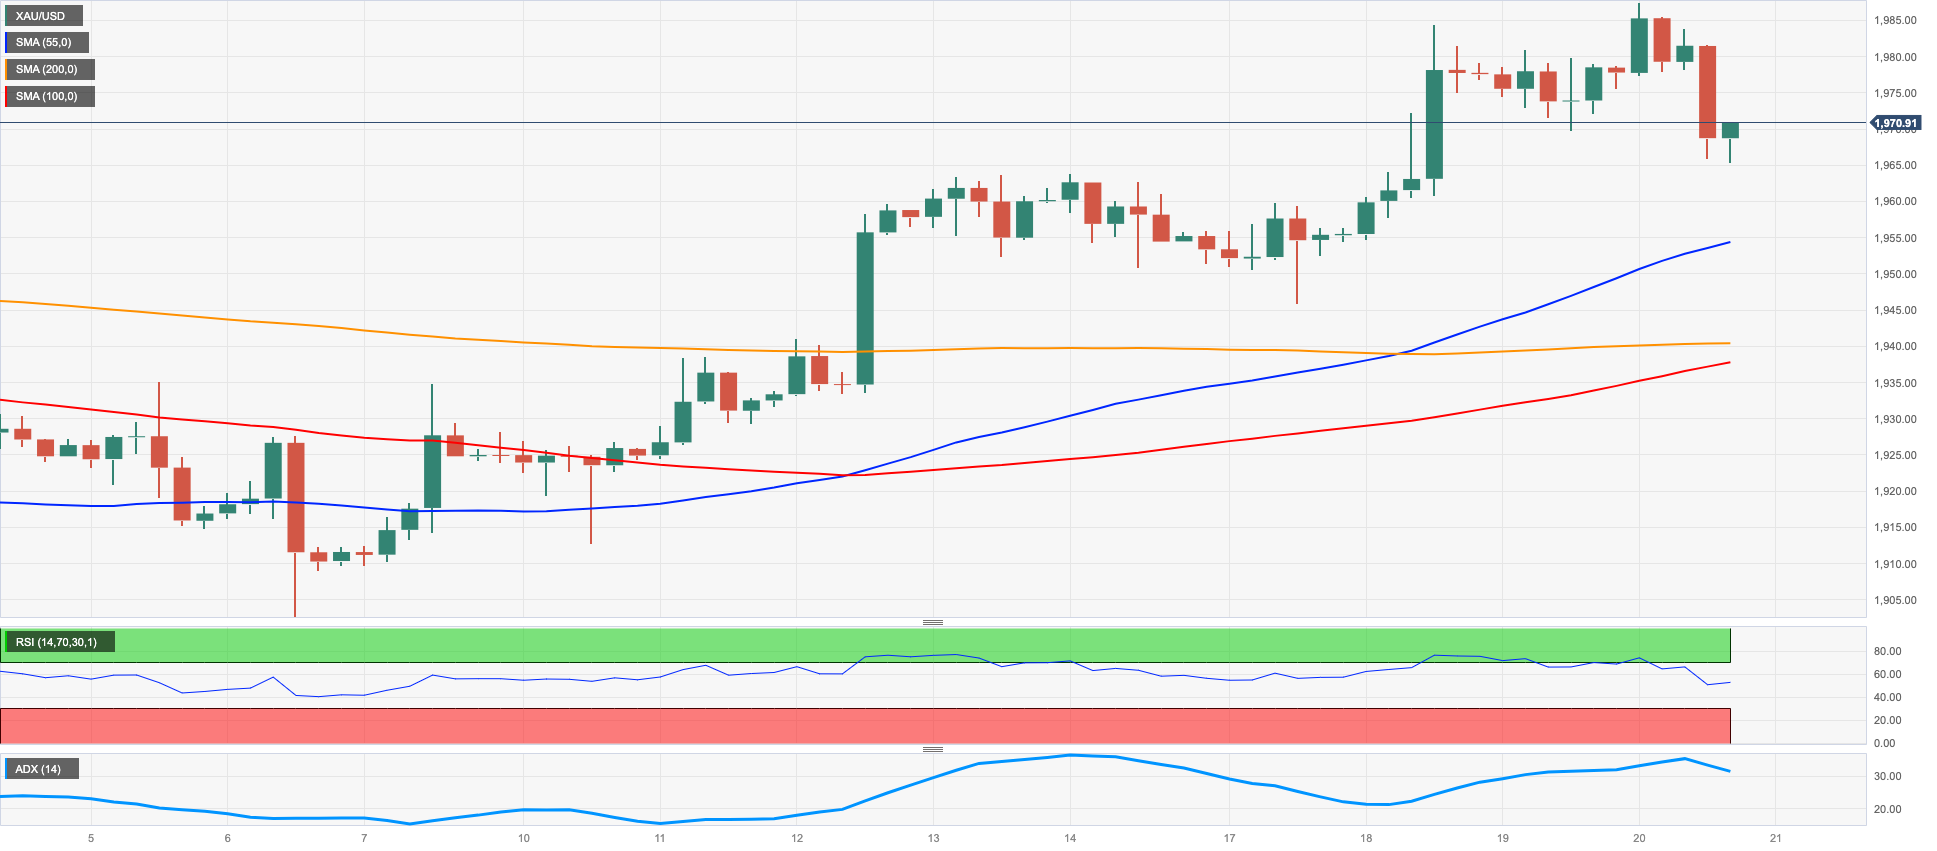
GOLD
The combination of further strength in the greenback and the marked bounce in US yields across all maturities weighed on the yellow metal on Thursday.
Indeed, the improvement in sentiment around the buck motivated the USD Index (DXY) to extend the breakout of the 100.00 mark and approach the 101.00 hurdle amidst further profit taking in the risk complex and fresh speculation of extra tightening by the Federal Reserve.
If gold breaks above the July high of $1984 (July 18), this could pave the way for a possible visit to the critical $2000 level. There is no strong northward resistance until the 2023 high of $2067 (4 May), which follows the 2022 top of $2070 (8 March) and is ahead of the all-time peak of $2075 (7 August 2020). On the opposite side, the June low of $1893 (29 June) appears to be the immediate contender, followed by the critical 200-day SMA at $1876 and the 2023 low of $1804 (28 February), all ahead of the important $1800 level.
Resistance levels: $1984 $2022 $2048 (4H chart)
Support levels: $1965 $1945 $1912 $1893 (4H chart)
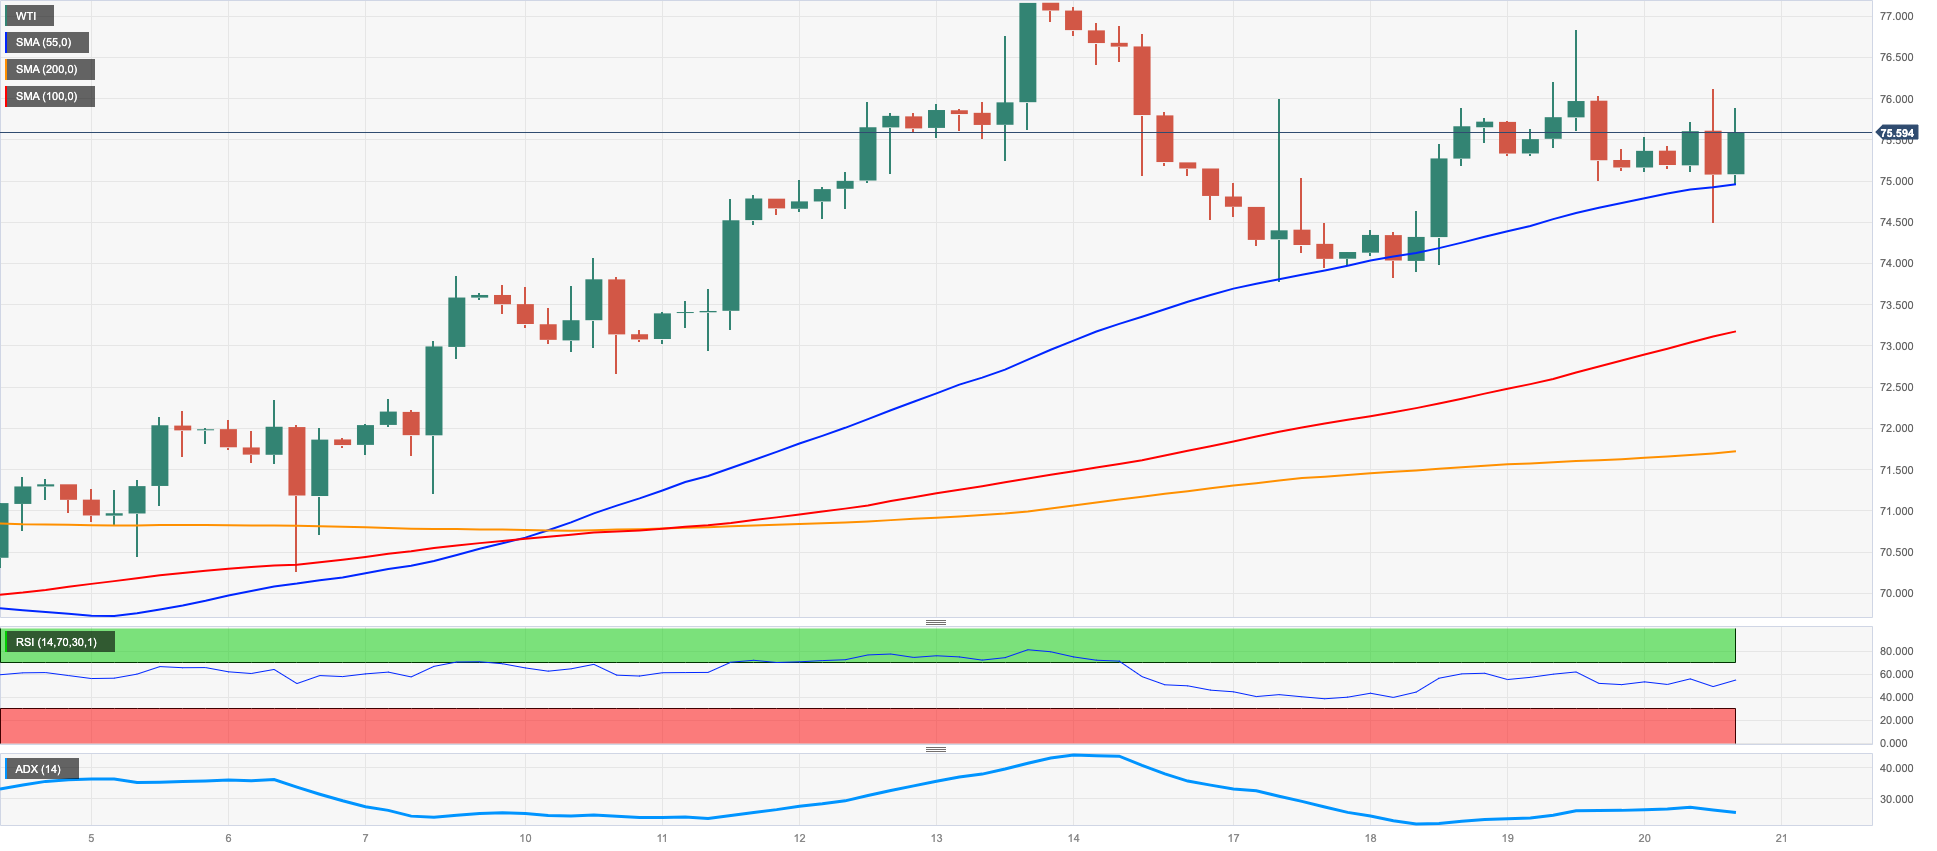
CRUDE WTI
On Thursday, WTI prices posted modest gains above the $75.00 per barrel mark, as investors continued to assess the ongoing sluggish economic rebound in China.
Another session of dollar gains appeared to have capped the upside, along with discouraging figures from the latest EIA report, which showed that US crude oil supplies declined less than anticipated in the week to July 14.
On the bright side, traders’ speculation of a stronger and faster Chinese economic recovery in the second half of the year remained firm and was bolstered by an all-time high of Chinese imports of Russian crude oil during June.
The surpass of the July high of $77.30 (July 14) indicates that a climb to the weekly top of $79.14 (April 24) is likely before the key $80.00 per barrel barrier. If the uptrend continues, the 2023 top of $83.49 (April 12) might be revisited before the November 2022 high of $93.73 (November 7). On the other hand, the loss of the weekly low of $73.89 (July 17) may expose intermediate contention levels at the 100-day and 55-day SMAs of $73.51 and $71.67, respectively, prior to the June low of $66.86 (June 13) and the 2023 low of $63.61 (May 4). The December 2021 low of $62.46 (December 2) and the key level of $60.00 per barrel are both south of here.
Resistance levels: $76.83 $77.30 $79.14 (4H chart)
Support levels: $74.47 $73.81 $71.57 (4H chart)
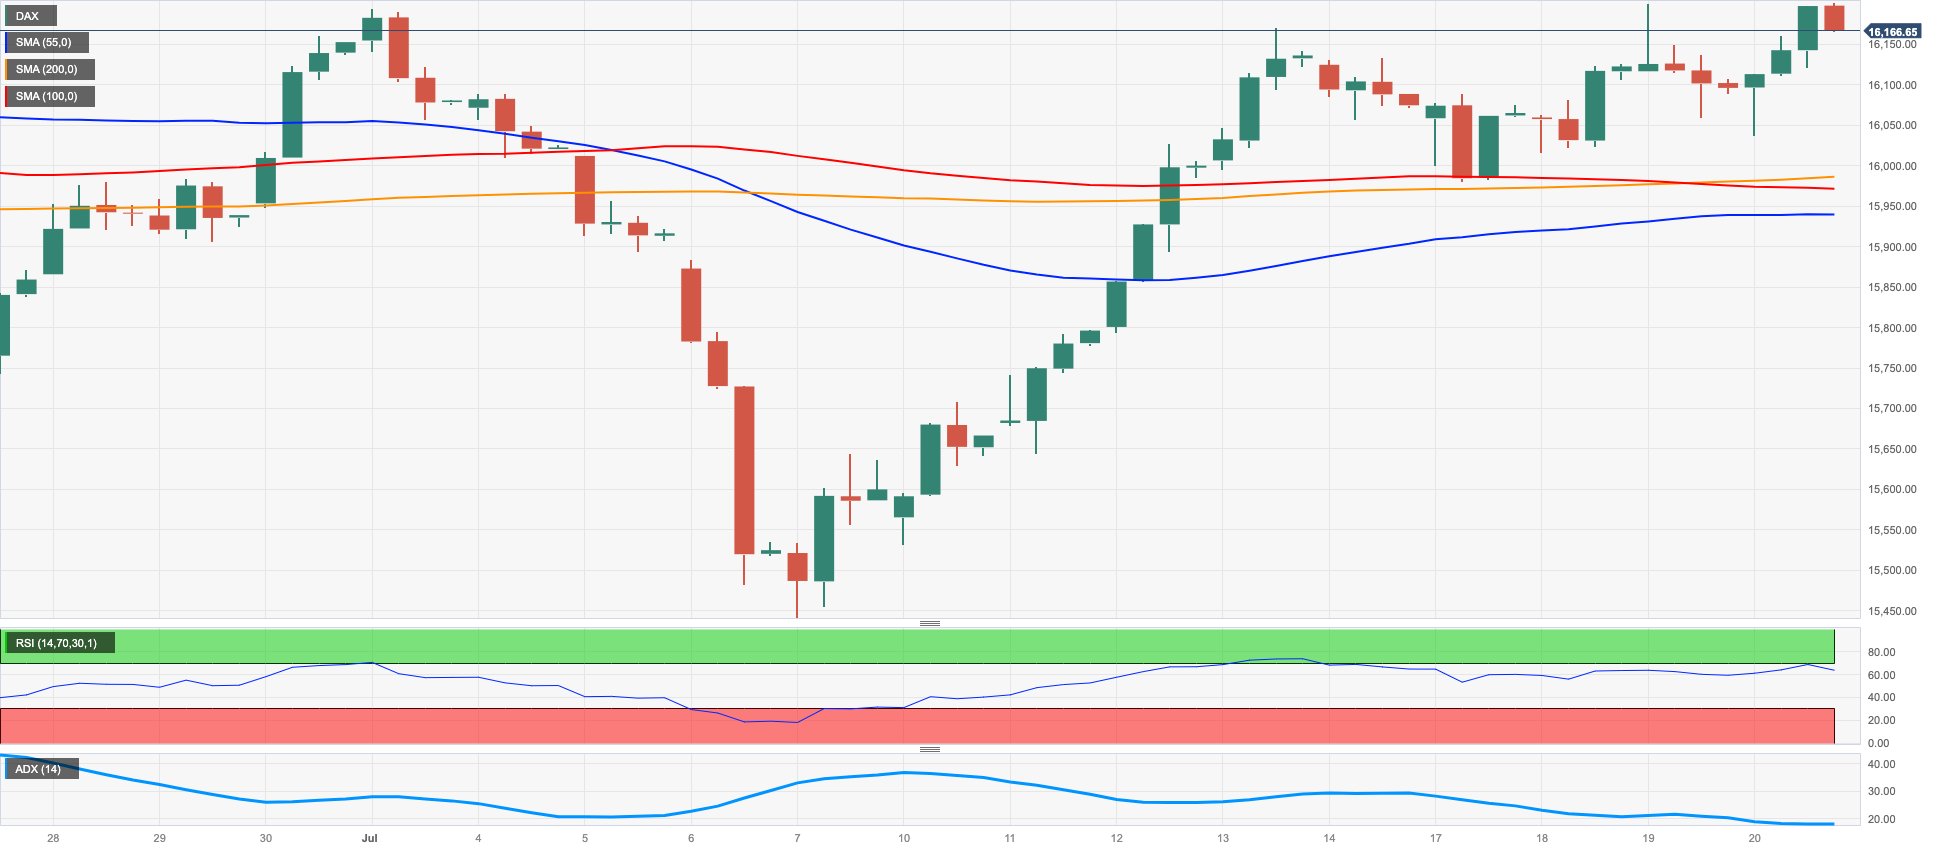
GER40
Germany’s stock index DAX40 rose markedly on Thursday, flirting with its monthly highs around the 16200 level.
The resumption of the upside pressure in the index came on the back of positive corporate earnings reports, while expectations of further disinflationary pressures were bolstered by the publication of Germany’s Producer Prices.
On the latter, and while the ECB is widely expected to raise rates next week, there seems to be considerable disagreement among Board members regarding further tightening beyond the summer.
On the DAX40, the weekly high of 16240 (July 19) is immediately to the upside, slightly ahead of the all-time high of 16427 (June 16). However, immediately to the downside comes the transitory 100-day SMA of 15769, which is above the July low of 15456 (July 7). If the latter is lost, the crucial 200-day SMA at 15042may be put to the test before the March low of 14458 (March 20) and the December 2022 low of 13791 (December 20). The daily RSI ticked higher past 58.
Best Performers: Fresenius SE, Siemens AG, Allianz
Worst Performers: Infineon, Vonovia, SAP
Resistance levels: 16240 16427 17000? (4H chart)
Support levels: 15995 1`5962 15456 (4H chart)
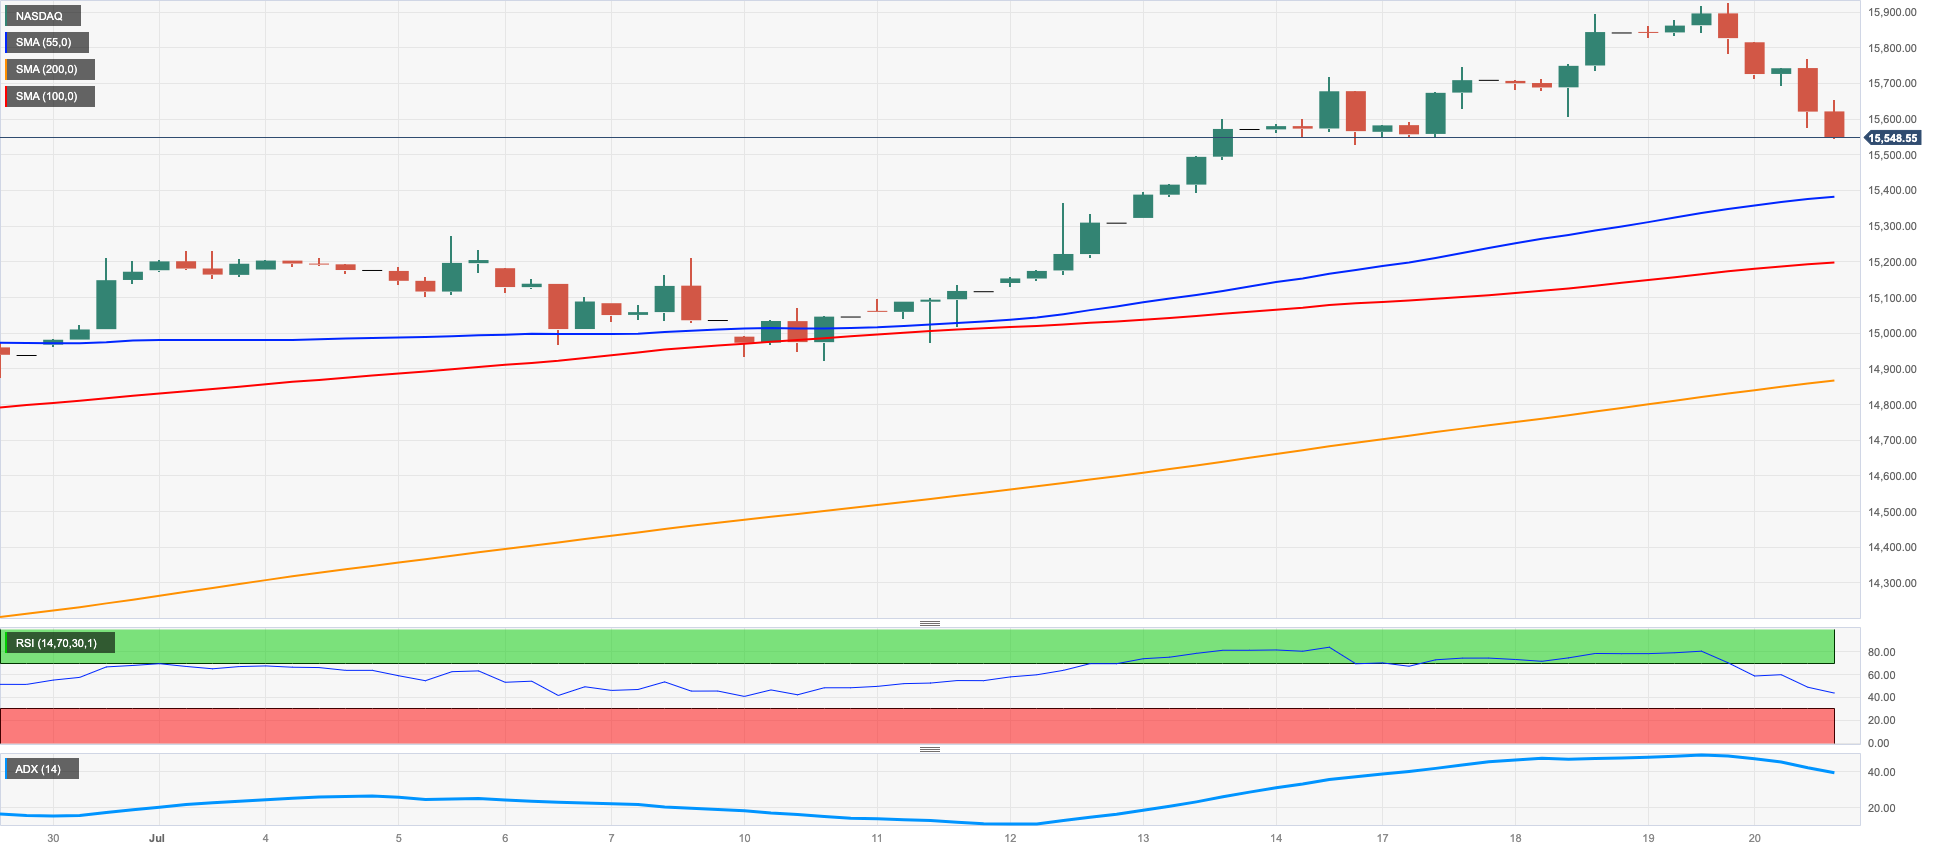
NASDAQ
The Nasdaq 100, a key technical reference for the performance of technology stocks, experienced a decline for the second consecutive trading session on Thursday. This time, it fell to its lowest level in several days, hovering around the 15500 region.
The index was negatively impacted by a combination of factors, including the continued strengthening of the US dollar and a significant increase in US bond yields. Additionally, there was renewed speculation that the Federal Reserve may raise interest rates beyond the summer, which also contributed to the pressure on the index.
Furthermore, the tech sector was particularly weak due to mixed news from two major companies, streaming giant Netflix and electric car maker Tesla.
Once the Nasdaq 100 clears the 2023 peak of 15932 (July 19), it should confront the round milestone of 16000. On the downside, the July low of 14924 (July 10), followed by weekly lows of 14687 (June 26), 14283 (June 7), and 13520 (May 24), may indicate initial unhappiness. A further decline may drive the price below the May low of 12938 (May 4), which was followed by the April bottom of 12724 (April 25), the 200-day SMA at 12612, and the March low of 11695 (March 13). Around 64, the daily RSI abandoned the overbought territory.
Top Gainers: Sirius XM, T-Mobile US, Constellation Energy
Top Losers: Netflix, Tesla, Zscaler
Resistance levels: 15932 16017 16607 (4H chart)
Support levels: 14924 14687 14283 (4H chart)
DOW JONES
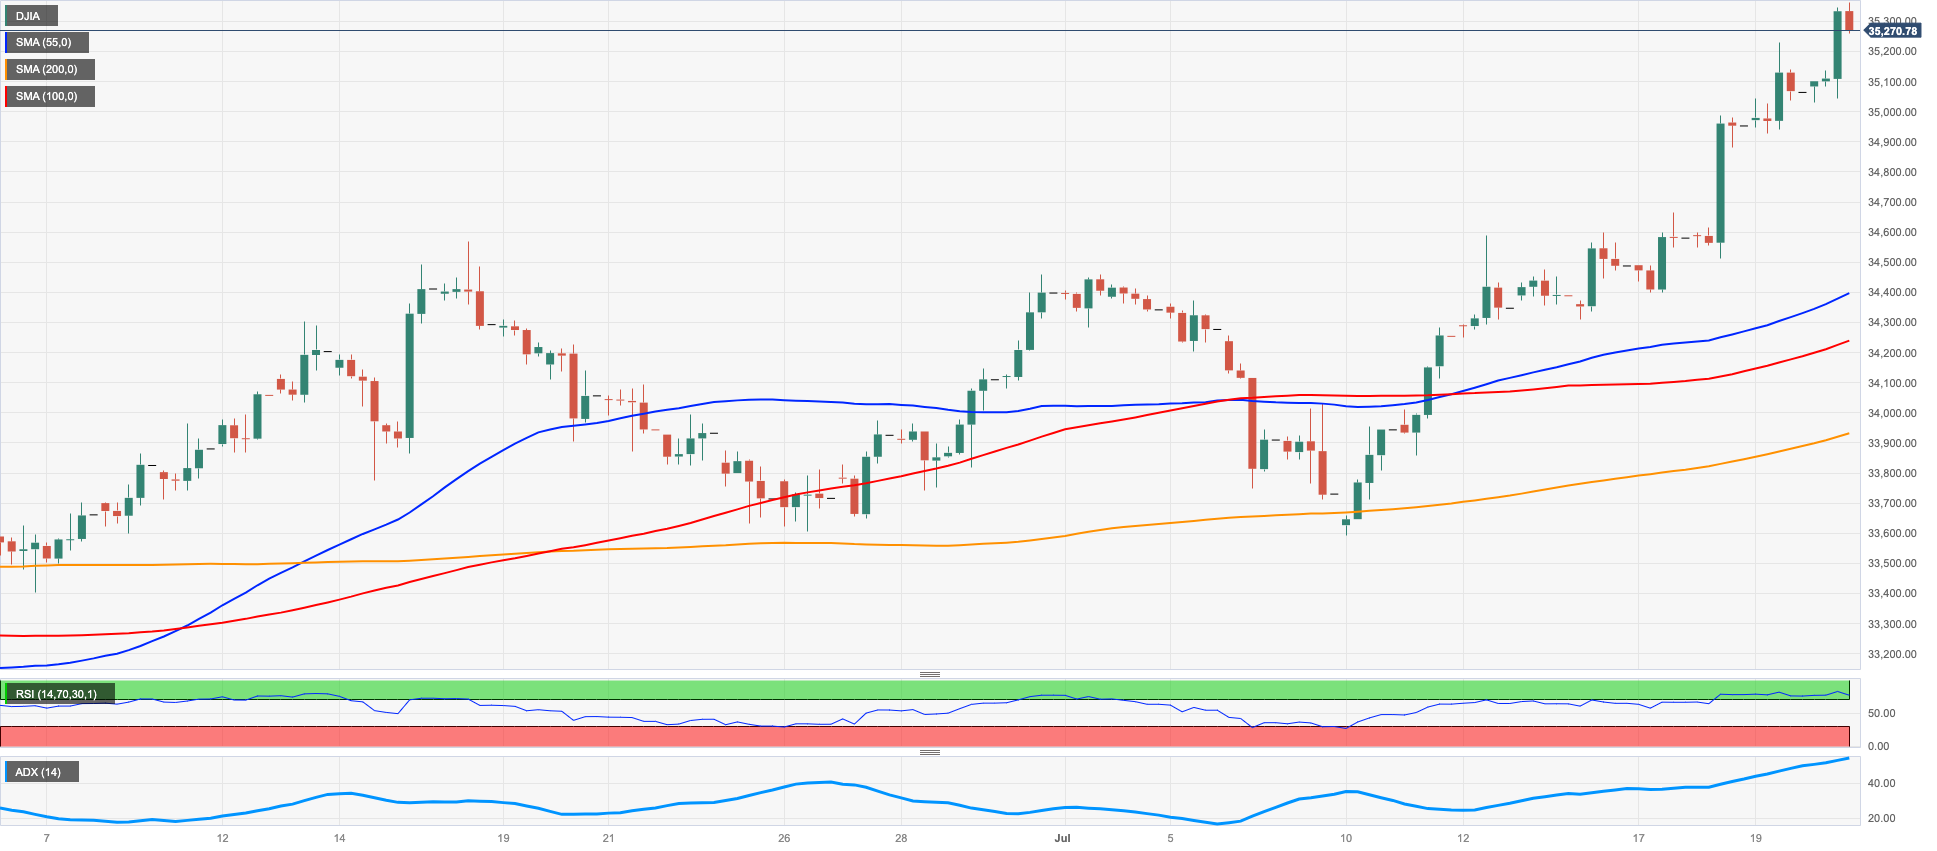
US equities, as represented by the Dow Jones, surged to a fresh 2023 high, reaching levels near 35400 on Thursday.
However, this upward movement was observed in the backdrop of mixed sentiments among investors. Indeed, market participants closely monitored earnings reports while maintaining a cautious stance ahead of the upcoming FOMC event scheduled for the following week. The focus remains particularly on the Federal Reserve's plans concerning its normalization program beyond the summer period.
All in all, the Dow Jones rose 0.68% to 35300, the S&P500 dropped 0.42% to 4546, and the tech-benchmark Nasdaq Composite deflated 1.52% to 14140.
If the Dow Jones exceeds the 2023 high of 35372 (July 20), it may try to test the April 2022 top of 35492 (April 21) before the February 2022 peak of 35824 (February 9). On the upside, the interim 55-day SMA at 33793 is projected to give initial support ahead of the weekly low of 33610 (June 26) and the transitory 100-day SMA at 33462. The breach of this zone reveals the critical 200-day SMA of 33200, which is located ahead of the May low of 32586 (May 25) and the 2023 low of 31429 (March 15). The daily RSI entered the overbought zone past 72.
Top Performers: J&J, Goldman Sachs, IBM
Worst Performers: Intel, Salesforce Inc, Microsoft
Resistance levels: 35372 35492 35824 (4H chart)
Support levels: 33705 33200 32586 (4H chart)
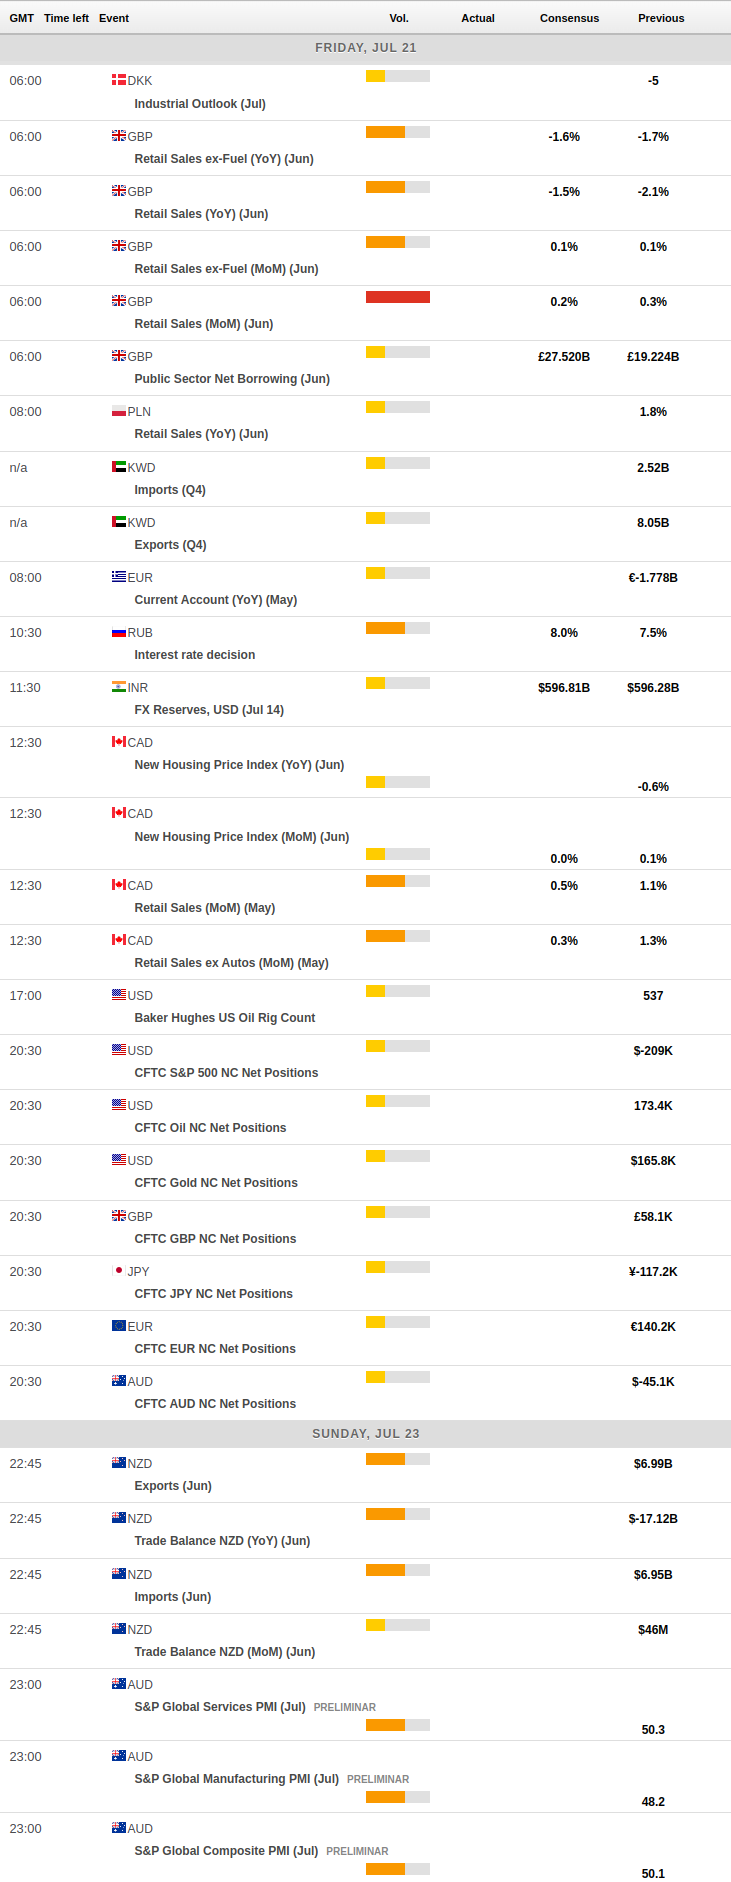
MACROECONOMIC EVENTS
All Information & Updates provided by:

All information relating to the financial markets available on this page has been prepared and issued by FXStreet (Forexstreet SL, Spain, Reg: B62498233) on the basis of publicly available information and all information believed to be reliable and does not conflict with Kuwaiti local laws, and all necessary care has been taken to before the company to ensure that the facts mentioned are correct from the source.
NCM Investment nor any of its directors or employees shall in any way be held responsible for the contents of this news, and the information contained on this page is intended only to provide clients with publicly available information and should not be construed as investment advice, report or analysis and/or constitute an offer or invitation to buy or sell financial instruments of any kind.
RISK WARNING: Forex and CFDs are highly risky leveraged products, as losses can exceed deposits. Please ensure you understand all the risks and take independent advice if necessary. NCM will segregate the clients based on the criteria of the regulator and its bylaws. NCM does not provide any advisory service; the material published does not constitute advice or a recommendation for a transaction in any financial instrument. NCM accepts no responsibility for any use of the content presented and any consequences of that use. Anyone acting on the information provided does so at their own risk.