
- Contact Us:
-

-

-

-


Daily Market Updates
25 Jul 2023
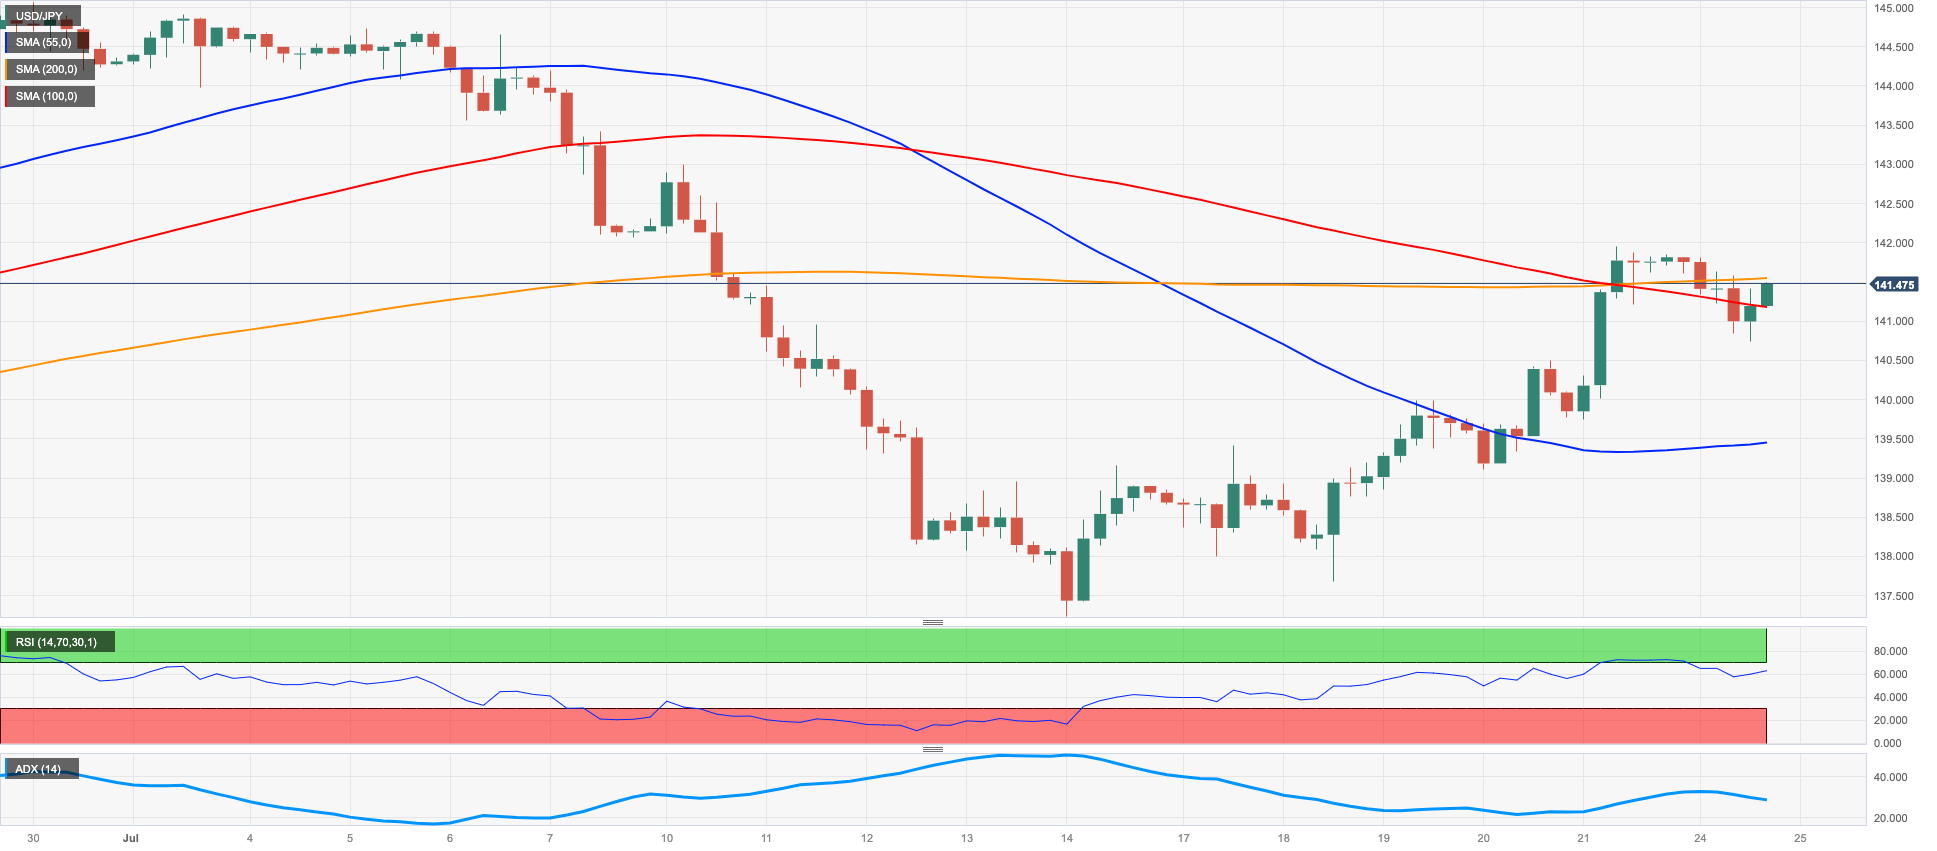
USDJPY
Following six consecutive days of gains, USD/JPY experienced a decline in momentum and briefly retreated to below the 141.00 level at the start of the new trading week.
This was likely due to the lack of support from US yields and the release of favourable readings from advanced PMIs, which helped boost the Japanese yen.
Moreover, the persistent caution among investors regarding possible government intervention in the event of further depreciation of the yen has also contributed to the yen’s strength.
In Japan, the preliminary Jibun Bank Manufacturing PMI is seen easing to 49.4 in July and the Services PMI is expected a tad lower at 53.9.
The continuance of the USD/JPY rebound should aim for the 2023 high of 145.07 (June 30), followed by the 2022 top of 151.94 (October 21), and finally the round level of 152.00. If the bears seize control, the pair may fall to the July low of 137.23 (July 14), which is just over the key 200-day SMA of 136.85. Before the April low of 130.62 (April 5) and the key round level of 130.00, the weekly low of 133.01 (April 26) and a minor support of 132.01 (April 13) are reached. The RSI for the day dropped below the 53 mark.
Resistance levels: 141.96 143.00 145.07 (4H chart)
Support levels: 139.42 137.67 137.23 (4H chart)
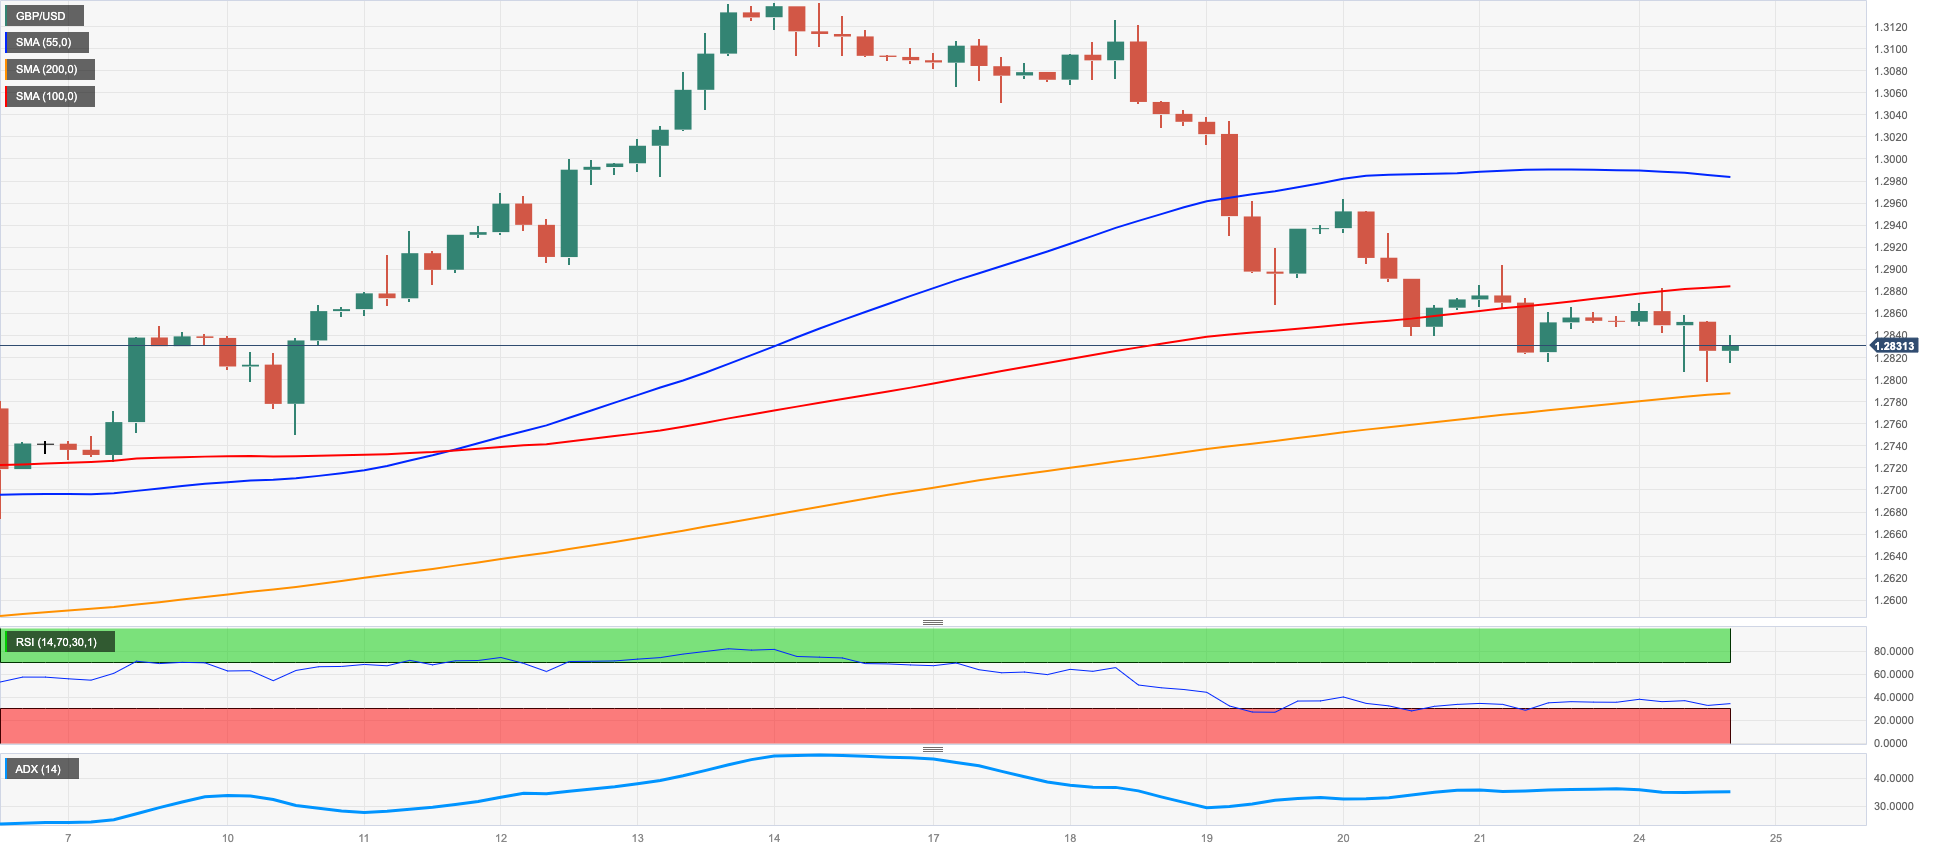
GBPUSD
At the beginning of this week, GBP/USD continued its recent decline and reached new lows just below the 1.2800 yardstick. This marks a continuation of the bearish sentiment that has persisted in recent sessions, with Cable closing with losses for the past seven days. It's worth noting that this decline comes after the pair hit new yearly highs around 1.3140 on July 14.
The USD Index (DXY) continued to gain strength, exerting further downward pressure on risk-linked assets, including the British pound.
Furthermore, the sterling's decline was exacerbated by discouraging preliminary Manufacturing and Services PMIs for July, which are expected to decline to 45.0 and 51.5, respectively, according to S&P Global/CIPS.
The loss of the weekly low at 1.2797 could force GBP/USD to test the temporary 55-day SMA at 1.2652 before the weekly low of 1.2590 (June 29). The collapse of the latter implies a move to the 1.2520 level, which corresponds to the 2021-2023 trend line and appears to be supported by the vicinity of the transitory 100-day SMA. The June low of 1.2368 (June 5) and the May low of 1.2308 (May 25) come next, before the critical 200-day SMA of 1.2251. On the upside, If the 2023 high of 1.3142 (July 14) is broken, spot may strive for weekly highs of 1.3146 (April 14, 2022) and 1.3298 (March 23, 2022). The daily RSI broke below the 50 threshold.
Resistance levels: 1.2964 1.3142 1.3166 (4H chart)
Support levels: 1.2797 1.2750 1.2591 (4H chart)
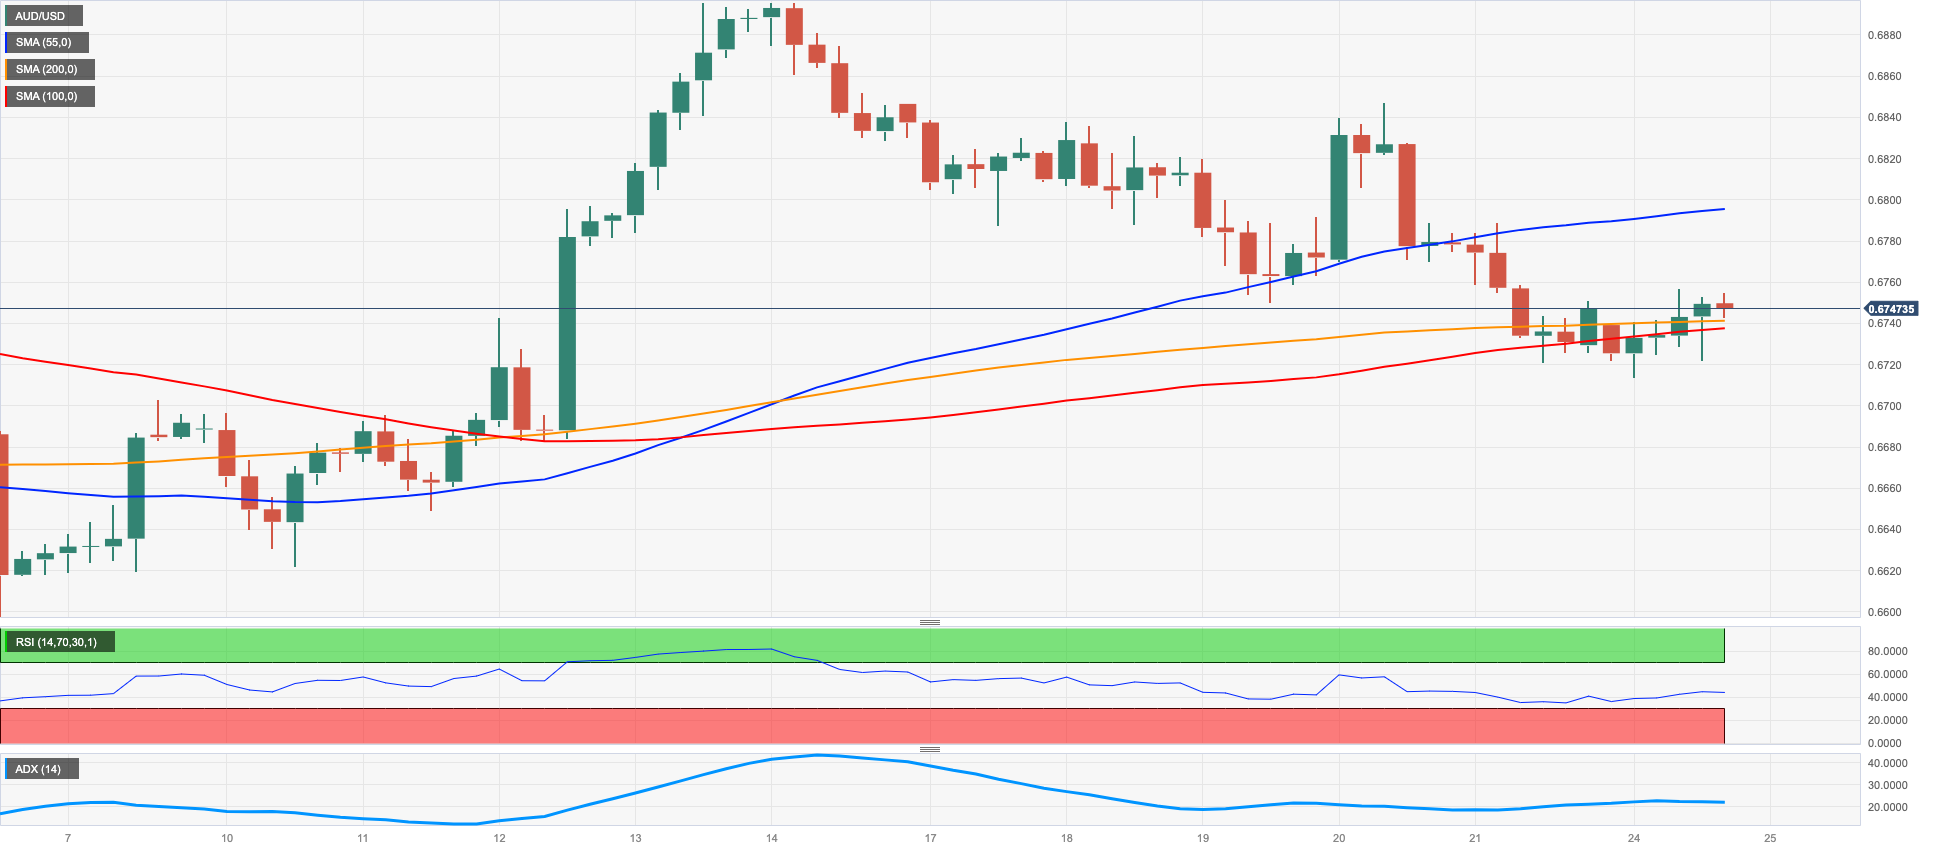
AUDUSD
AUD/USD displayed resilience by partially recovering from Friday's substantial decline and advancing, even in the face of a prevailing greenback bias, on Monday.
Notably, the Aussie dollar garnered renewed buying interest as it encountered the crucial 200-day SMA around 0.6720 in the early trading session. Additional support for the currency stemmed from a modest but widespread recovery in the commodity sector, coupled with a favourable outcome from the advanced Manufacturing PMI for the current month.
On the latter, flash Manufacturing and Services PMIs gauged by Judo Bank are seen at 49.6 and 48.0 for the month of July.
Immediately to the downside for AUD/USD comes the weekly low of 0.6714 (July 24), which appears propped up by the key 200-day SMA. Further decline might put the weekly low of 0.6595 (June 29) to the test before the 2023 low of 0.6458 (May 31). The November 2022 low of 0.6272 (November 3) happens south of here, before the 2022 low of 0.6169 (October 13). Just the opposite, the July high of 0.6894 (July 13) appears as the initial resistance shortly before the June top of 0.6899 (June 16). The breach of this zone might pave the way for a visit to the crucial 0.7000 level before the weekly peak of 0.7029 (February 14) and the 2023 high of 0.7157 (February 2). The everyday RSI improved past the 61 mark.
Resistance levels: 0.6790 0.6846 0.6894 (4H chart)
Support levels: 0.6714 0.6650 0.6599 (4H chart)
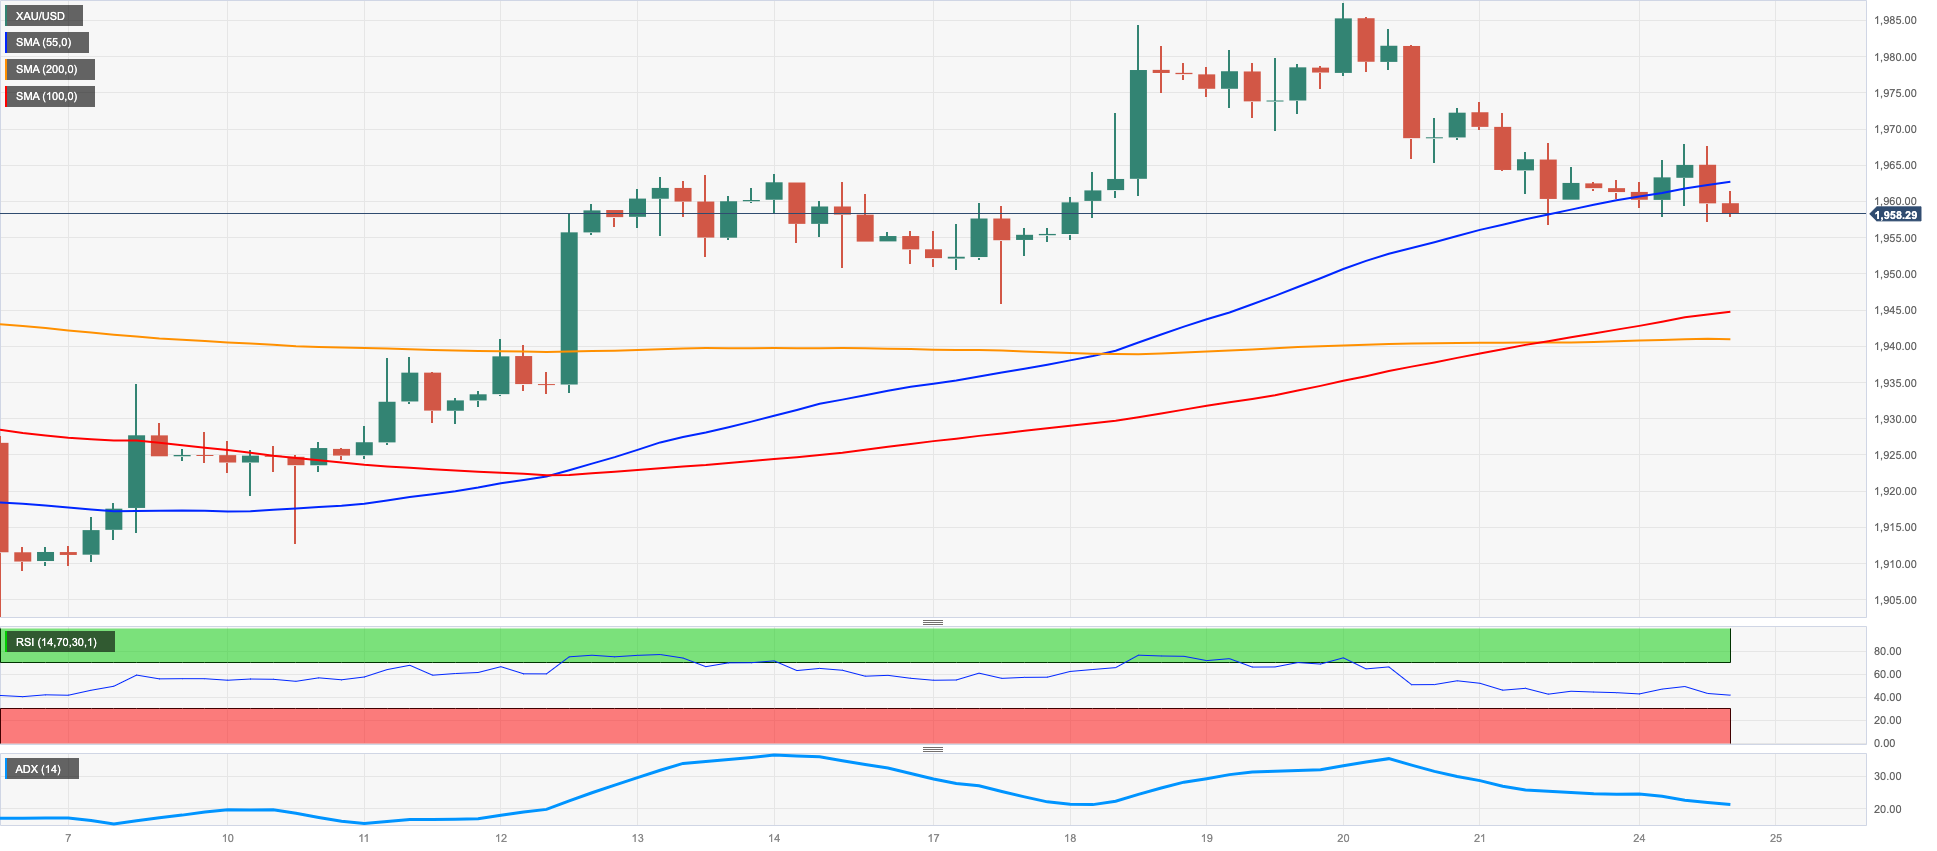
GOLD
The price of gold fell for the fourth consecutive session on Monday, this time breaking below the $1960 level to trade near the 55-day SMA.
The greenback's strength and small gains in US yields across the curve appear to have been enough to keep the yellow metal under pressure and weigh on its price action at the start of the week.
Looking ahead, bullion is likely to remain in focus ahead of the FOMC and ECB meetings later this week. While both central banks are widely expected to raise interest rates by 25 bps, traders will be closely watching for any hints about the future path of their monetary policies, particularly against the backdrop of cooling inflation and still tight labor markets in both the United States and Europe.
If the selling pressure increases, gold is projected to hit immediate resistance at the weekly low of $1945 (July 17). If this level is breached, the $1900 round level will be exposed ahead of the June low of $1893 (June 29). The critical 200-day SMA at $1879 is aligned south of here, followed by the 2023 low of $1804 (February 28) and the crucial $1800 level. By contrast, a break over the July high of $1984 (July 18) might open the door to a visit to the critical $2000 level. There is no strong northward resistance until the 2023 peak of $2067 (May 4), which follows the 2022 high of $2070 (March 8) and the all-time high of $2075 (August 7 2020).
Resistance levels: $1967 $1984 $2022 (4H chart)
Support levels: $1957 $1941 $1912 $1893 (4H chart)
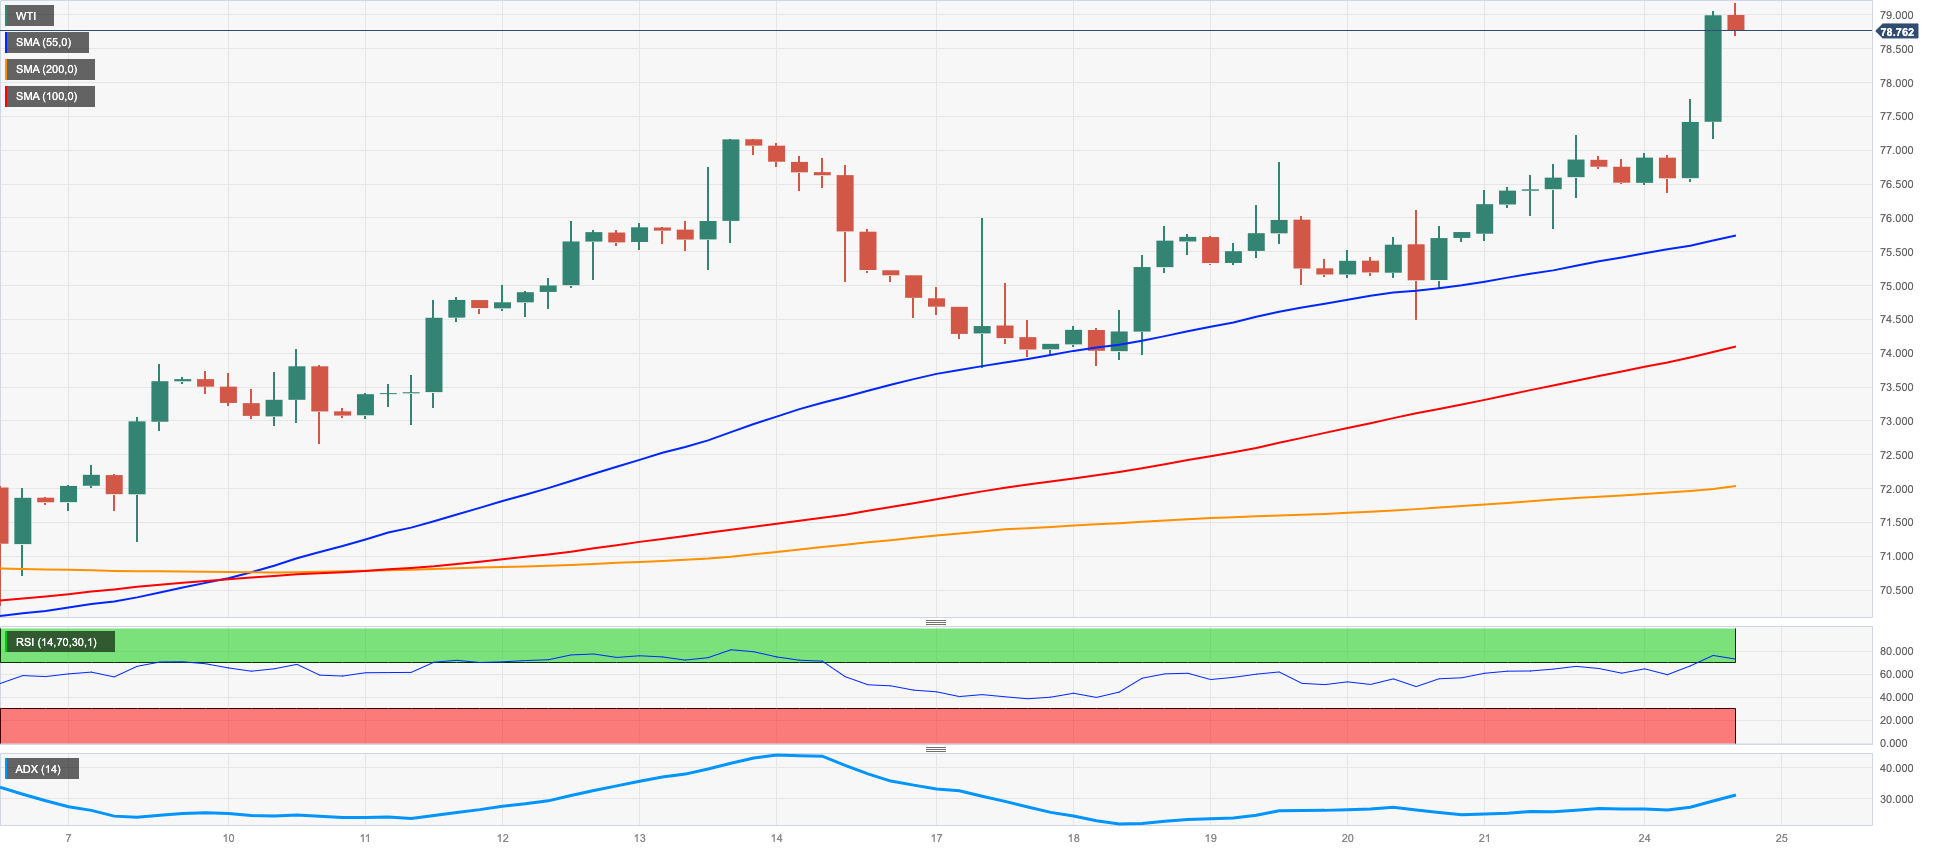
CRUDE WTI
At the start of the week, the prices of WTI continued to rise and surpassed the $79.00 per barrel mark, which was last seen in mid-April.
This was the third consecutive session where crude oil prices increased, and it was mainly due to the current limited supply and optimism about China's potential stimulus, as well as a stronger economic rebound in the latter part of the year. These factors contributed to Monday's robust increase.
The positive trend also extended to gasoline futures (RBOB), which surpassed the $2.93 level for the first time since mid-October 2022, indicating further upward movement in prices of the commodity.
The break over the July high of $79.24 (July 24) shows that a climb to the crucial $80.00 per barrel barrier is likely. If the current upswing continues, the 2023 top of $83.49 (April 12) may be reclaimed before the November 2022 high of $93.73 (November 7). On the other side, a break of the weekly low of $73.89 (July 17) might put pressure on the transitory 100-day and 55-day SMAs of $73.52 and $71.96, respectively, ahead of the June low of $66.86 (June 13) and the 2023 low of $63.61 (May 4). The December 2021 low of $62.46 and the critical $60.00 mark per barrel are both south of here.
Resistance levels: $79.24 $81.52 $83.49 (4H chart)
Support levels: $75.76 $73.81 $71.79 (4H chart)
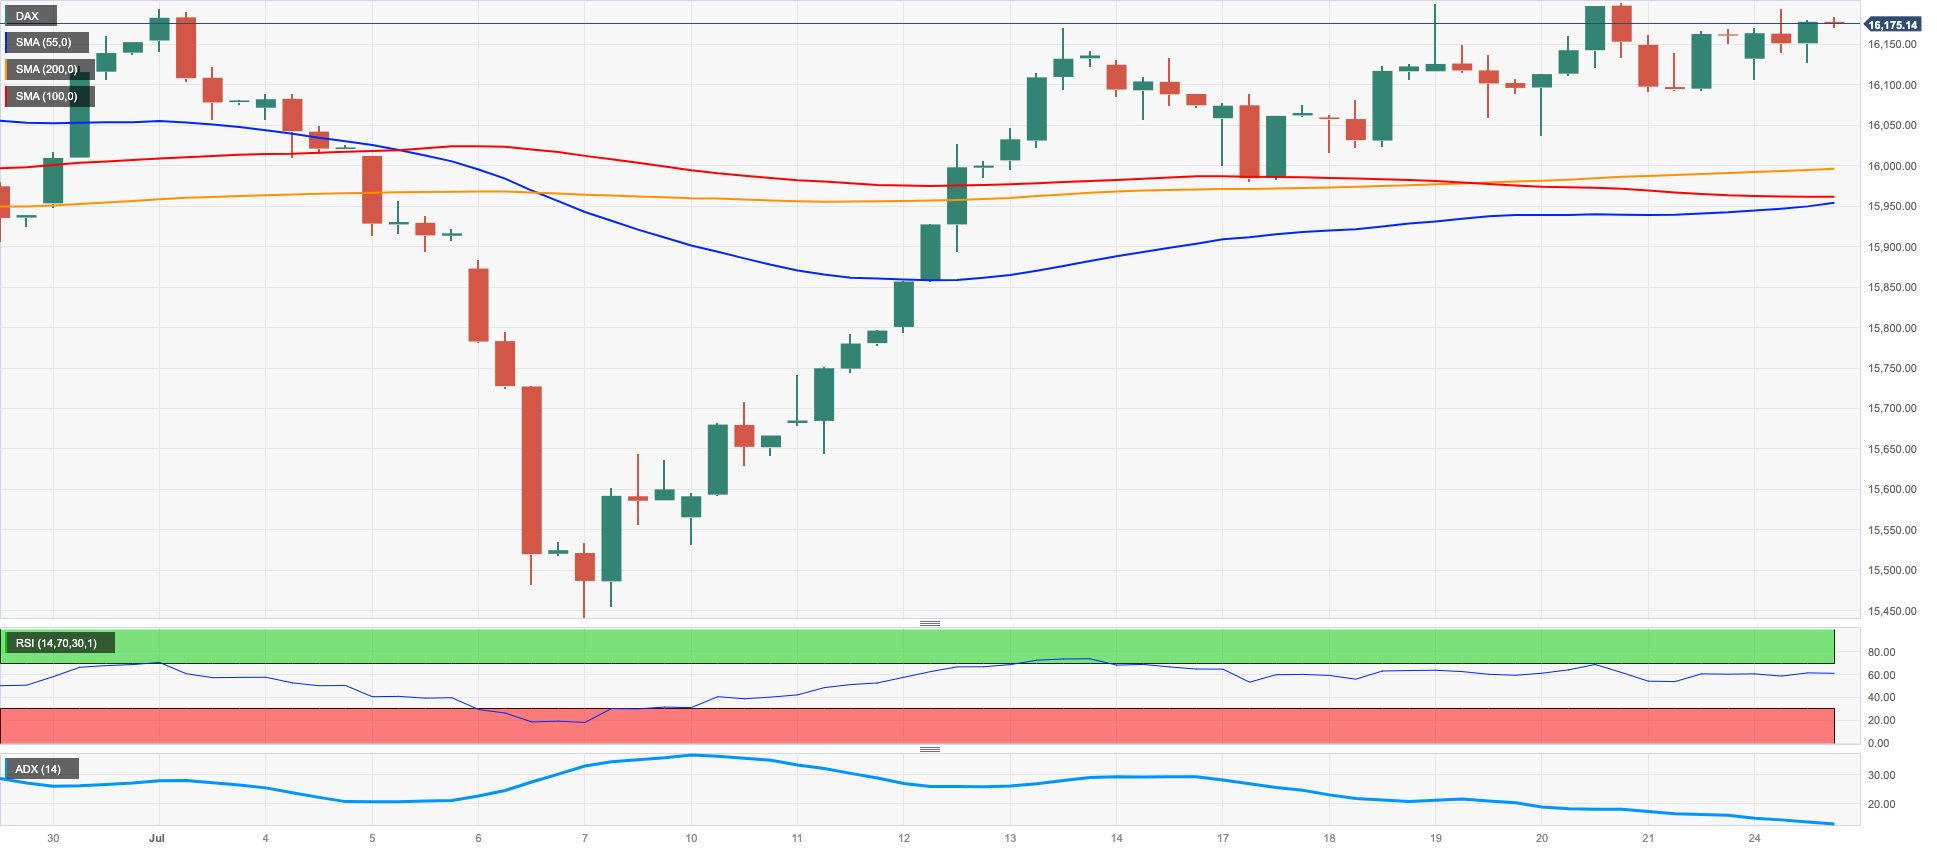
GER40
At the start of the week, the benchmark DAX40 index in Germany managed to recover from Friday's decline and record modest gains.
The index initially started on a negative note following the release of disappointing advanced PMIs in the core euro area, which raised concerns of an impending recession and caused the major European benchmark indices to fall.
In addition, investors remained cautious ahead of the key FOMC and ECB meetings scheduled for Wednesday and Thursday, respectively, which contributed to the overall sentiment in the market.
Meanwhile, in the domestic bonds market, the 10-year bund yields extended Friday's decline and closed at around the 2.40% level.
In Germany, the preliminary Manufacturing PMI came in at 38.8 in July and 52.0 when it comes to the Services sector.
The DAX40's weekly high of 16240 (July 19) is immediately to the upside, just ahead of the all-time top of 16427 (June 16). On the contrary, the intermediate 55-day and 100-day SMAs at 16000 and 15786, respectively, appear to be the first obstacle for bears as they approach the July low of 15456 (July 7). If the latter is lost, a retest of the 200-day SMA at 15081 before the March low of 14458 (March 20) and the December 2022 low of 13791 (December 20) might be in the cards. The daily RSI looked stable near 58.
Best Performers: Sartorius AG VZO, Qiagen, Continental AG
Worst Performers: Fresenius SE, Heidelbergcement, Daimler Truck Holding
Resistance levels: 16240 16427 17000? (4H chart)
Support levels: 15995 15971 15456 (4H chart)
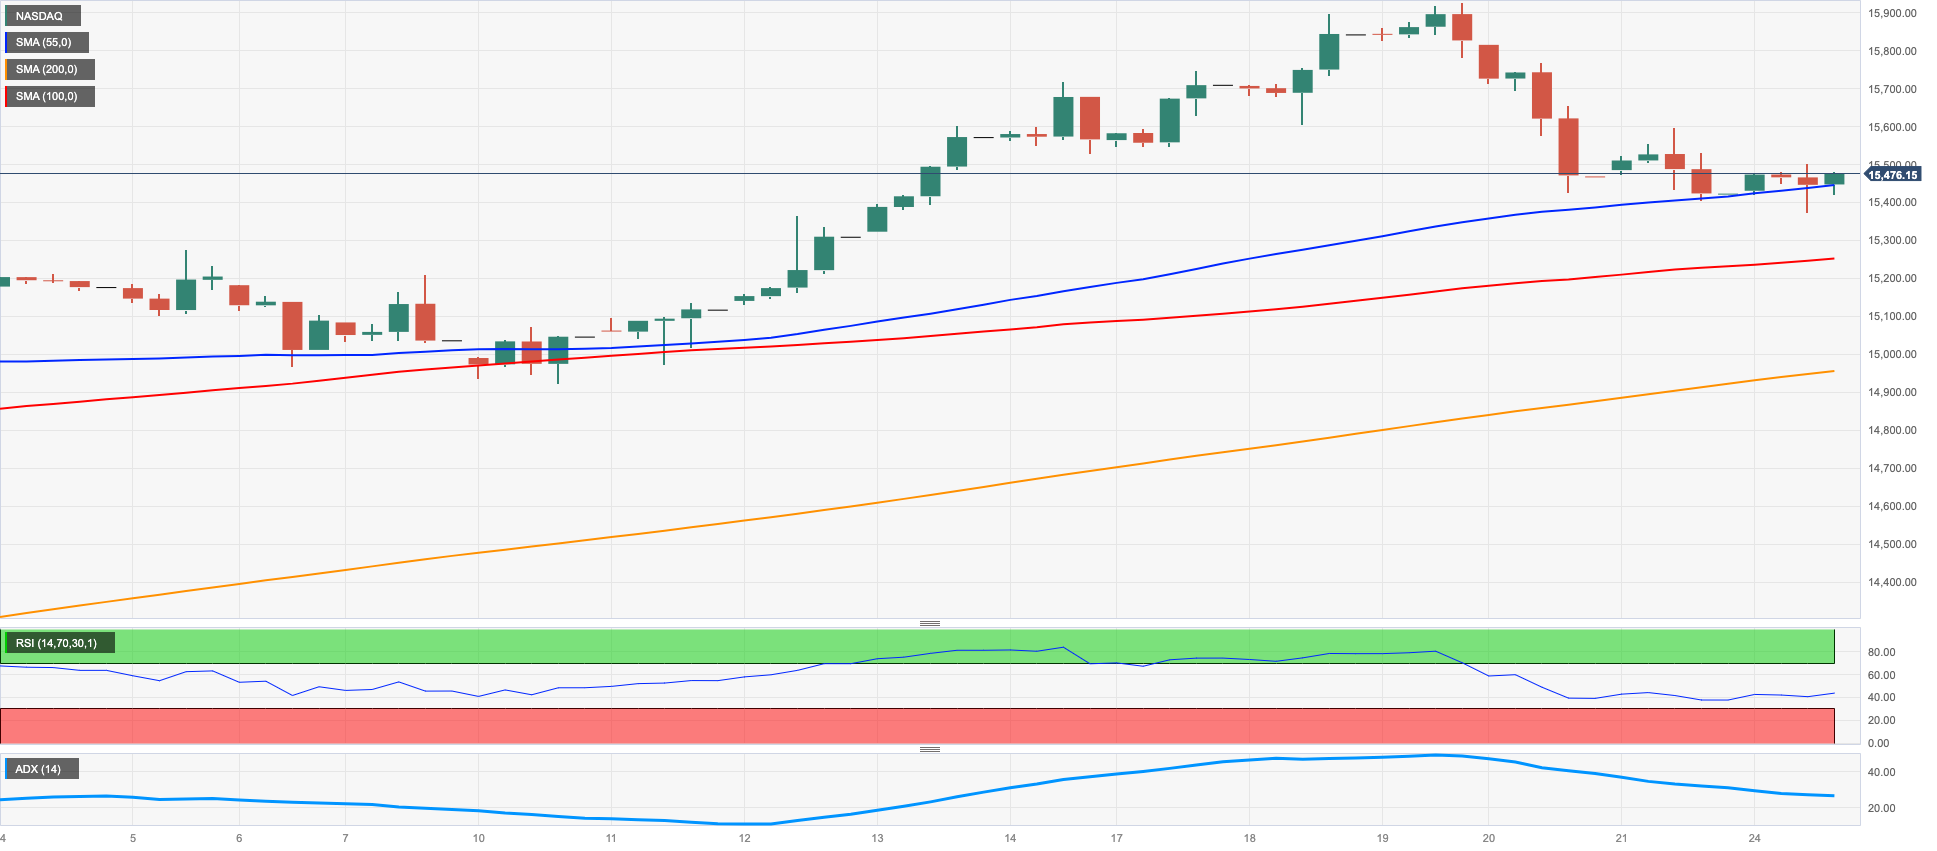
NASDAQ
At the onset of the new trading week, US tech stocks represented by the Nasdaq 100 showed a moderated bound, shrugging off three consecutive days of decline and rallying to reach the 15500 level.
In fact, the index gained further momentum, aligning itself with other US markets, in what proved to be an auspicious start to the week. This positive movement was primarily supported by expectations that the Federal Reserve might conclude its hiking campaign sooner than initially anticipated.
Moreover, investors' optimism was bolstered by the anticipation of favourable earnings reports from prominent tech giants such as Microsoft, Alphabet, and Meta Platforms, among others, scheduled for release later in the week. These expectations played a significant role in driving the daily advance of the Nasdaq 100 index.
When the Nasdaq 100 surpasses the 2023 high of 15932 (July 19), it will have reached the round milestone of 16000. On the downside, the July low of 14924 (July 10), followed by weekly lows of 14687 (June 26), 14283 (June 7), and 13520 (May 24), may herald the start of dissatisfaction. A further decline may drive the price below the May low of 12938 (May 4), which was followed by the April bottom of 12724 (April 25), the 200-day SMA at 12651, and the March low of 11695 (March 13). The daily RSI improved marginally to the boundaries of 60.
Top Gainers: PDD Holdings DRC, JD.com Inc Adr, Lucid Group
Top Losers: Sirius XM, Gilead, Intuitive Surgical
Resistance levels: 15932 16017 16607 (4H chart)
Support levels: 15374 14924 14687 (4H chart)
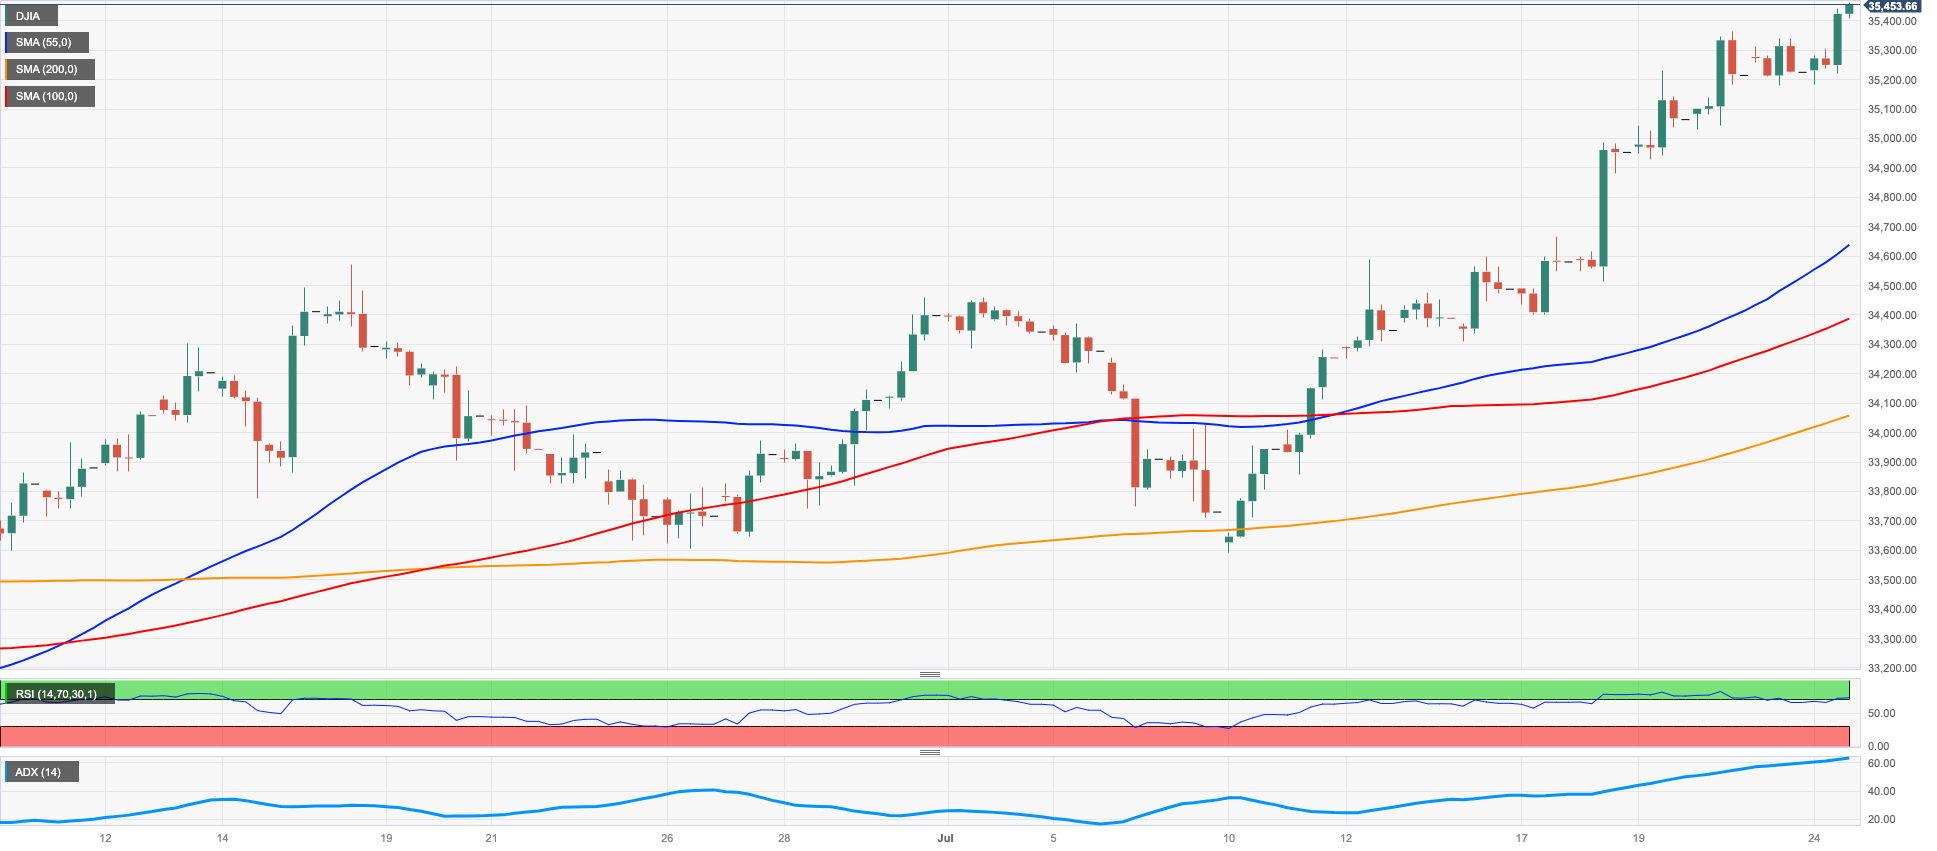
DOW JONES
The Dow Jones, which tracks the performance of 30 large publicly traded companies in the United States, rose to a new high for 2023, reaching nearly 3500 points.
Investors' optimism continued to grow ahead of further earnings reports from major companies later this week, and the possibility that the Federal Reserve could raise interest rates for the final time on Wednesday also contributed to the positive sentiment.
All in all, the Dow Jones rose 0.60% to 35437, the S&P500 advanced 0.50% to 4559, and the tech-heavy Nasdaq Composite gained 0.26% to 14068.
If the Dow Jones leave behind the 2023 high of 35443 (July 24), it may attempt to challenge the April 2022 high of 35492 (April 21) before the February 2022 top of 35824 (February 9). The transitory 55-day SMA at 33857, on the other hand, is projected to give early support before the weekly low of 33610 (June 26) and the temporary 100-day SMA at 33513. When this zone is violated, the 200-day SMA of 33254 is exposed, which is ahead of the May low of 32586 (May 25) and the 2023 low of 31924 (March 15). The daily RSI remained well in the overbought territory above 74.
Top Performers: Chevron, Goldman Sachs, JPMorgan
Worst Performers: Salesforce Inc, Merck&Co, American Express
Resistance levels: 35443 35492 35824 (4H chart)
Support levels: 34330 33705 33501 (4H chart)
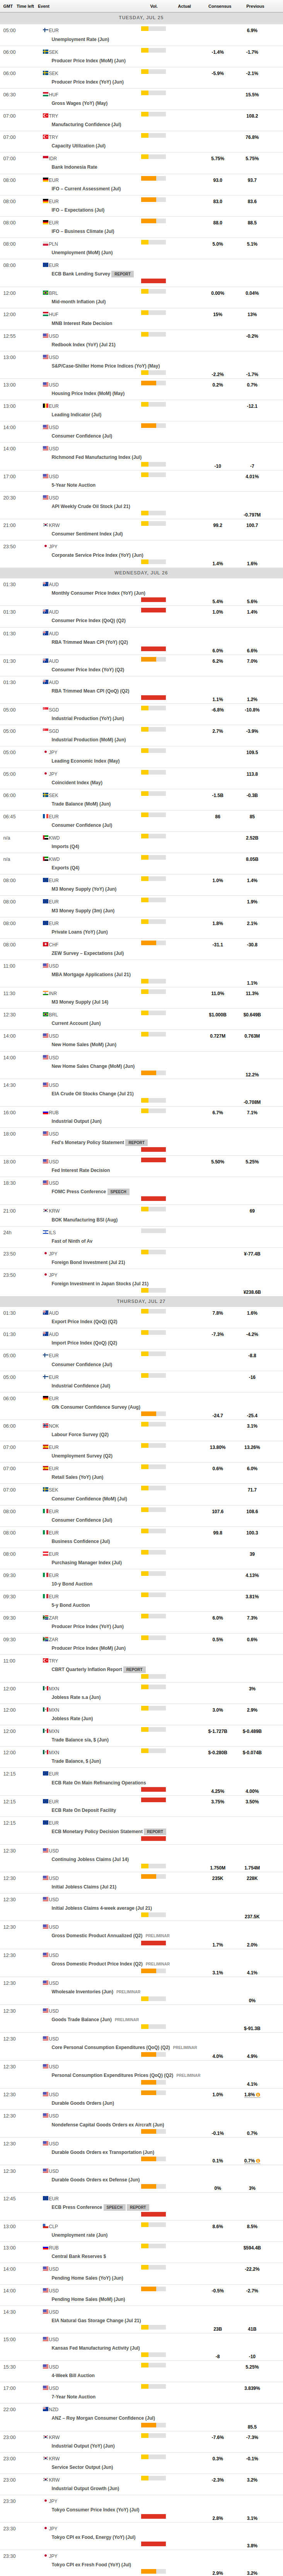
MACROECONOMIC EVENTS
All Information & Updates provided by:

All information relating to the financial markets available on this page has been prepared and issued by FXStreet (Forexstreet SL, Spain, Reg: B62498233) on the basis of publicly available information and all information believed to be reliable and does not conflict with Kuwaiti local laws, and all necessary care has been taken to before the company to ensure that the facts mentioned are correct from the source.
NCM Investment nor any of its directors or employees shall in any way be held responsible for the contents of this news, and the information contained on this page is intended only to provide clients with publicly available information and should not be construed as investment advice, report or analysis and/or constitute an offer or invitation to buy or sell financial instruments of any kind.
RISK WARNING: Forex and CFDs are highly risky leveraged products, as losses can exceed deposits. Please ensure you understand all the risks and take independent advice if necessary. NCM will segregate the clients based on the criteria of the regulator and its bylaws. NCM does not provide any advisory service; the material published does not constitute advice or a recommendation for a transaction in any financial instrument. NCM accepts no responsibility for any use of the content presented and any consequences of that use. Anyone acting on the information provided does so at their own risk.