
- Contact Us:
-

-

-

-


Daily Market Updates
26 Jul 2023
USDJPY
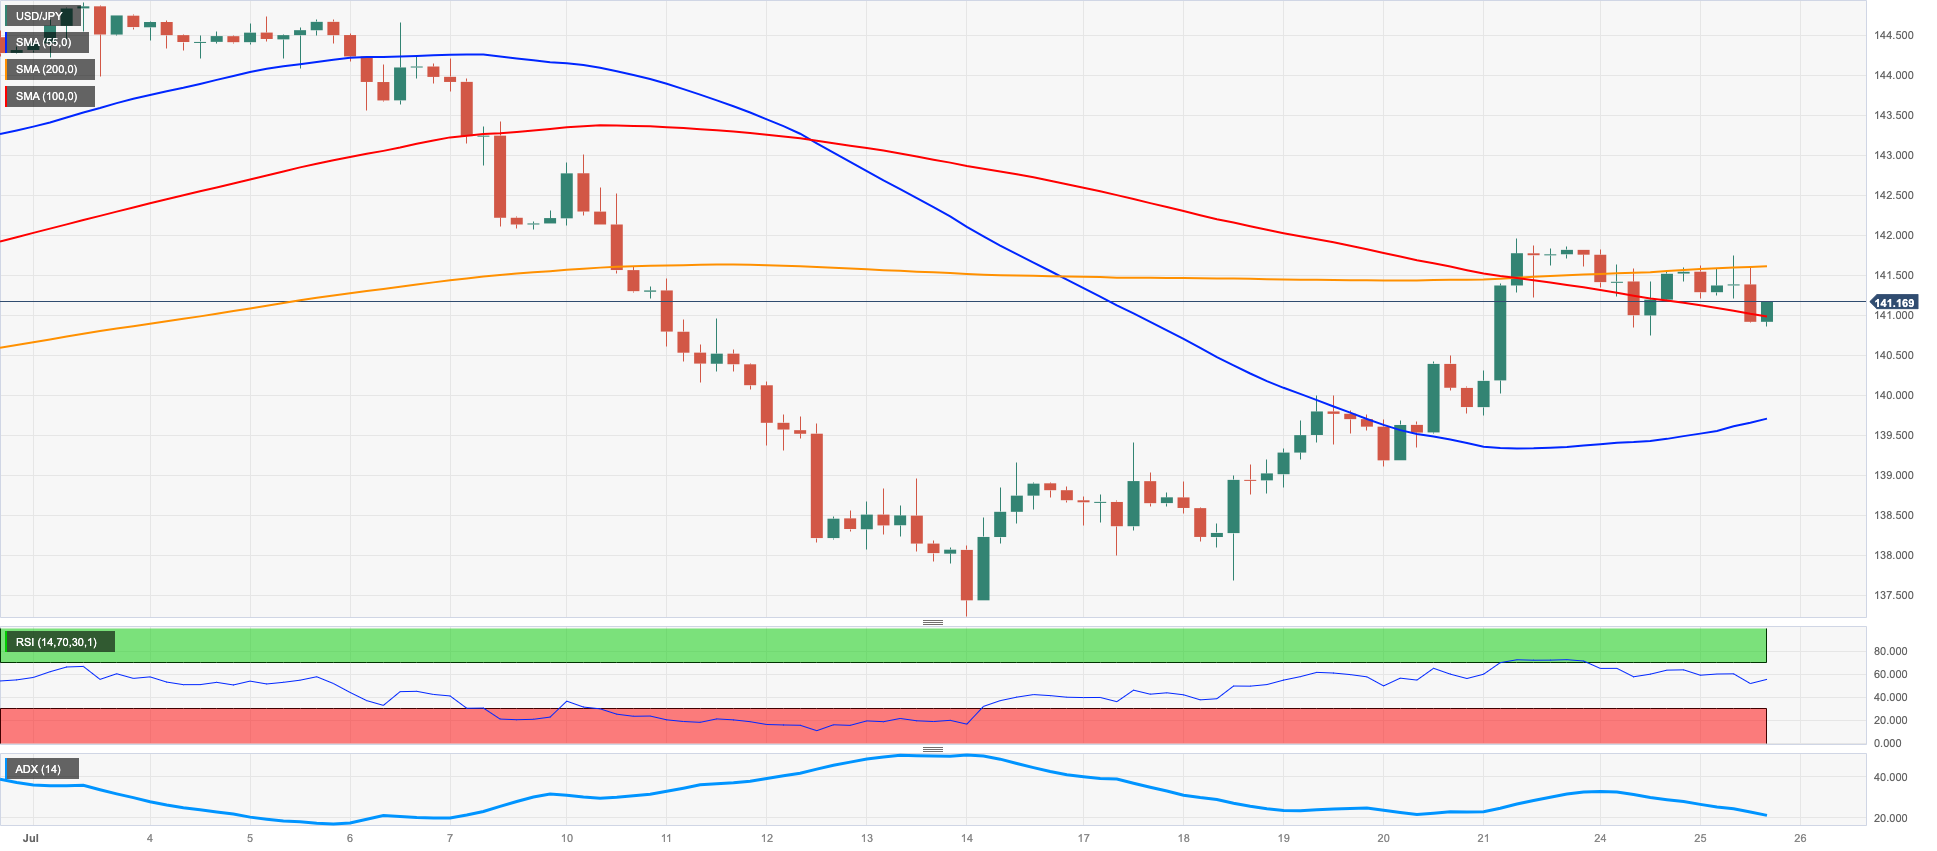
During the early part of the week, USD/JPY faced selling pressure and eventually dropped below the key support level of 141.00 on Tuesday. This decline was triggered by a loss of momentum in the greenback, causing the USD Index (DXY) to relinquish its previous gains and enter negative territory for the first time in five consecutive days of advances.
The drop in the pair was also influenced by mixed signals from US yields: While short-term yields showed a slight decline, the belly and long-end yields experienced modest gains. In contrast, the Japanese bonds market saw the JGB 10-year yields holding steady around 0.46%.
Adding to the downward pressure on the USD/JPY pair was the release of Japan's longer-term macro forecasts by the Cabinet Office. These forecasts indicated that headline inflation is expected to hover around 0.7% from FY27 to FY32, after experiencing higher rates of around 2.6% in FY23, 1.9% in FY24, and 1.2% in FY25.
Notably, there were no significant data releases on the Japanese calendar for Tuesday.
Immediate hurdle for bulls emerges at the weekly high at 141.74 (July 25). The breakout of this level could encourage USD/JPY to challenge the 2023 high of 145.07 (June 30), then the 2022 top of 151.94 (October 21), and lastly the round level of 152.00. If sellers grab control, the pair may drop to the July low of 137.23 (July 14), just above the crucial 200-day SMA of 136.81. The weekly low of 133.01 (April 26) and a minor support of 132.01 (April 13) are hit before the April low of 130.62 (April 5) and the crucial round level of 130.00. The RSI for the day fell to the sub-51 area.
Resistance levels: 141.96 143.00 145.07 (4H chart)
Support levels: 140.73 139.59 137.67 (4H chart)
GBPUSD
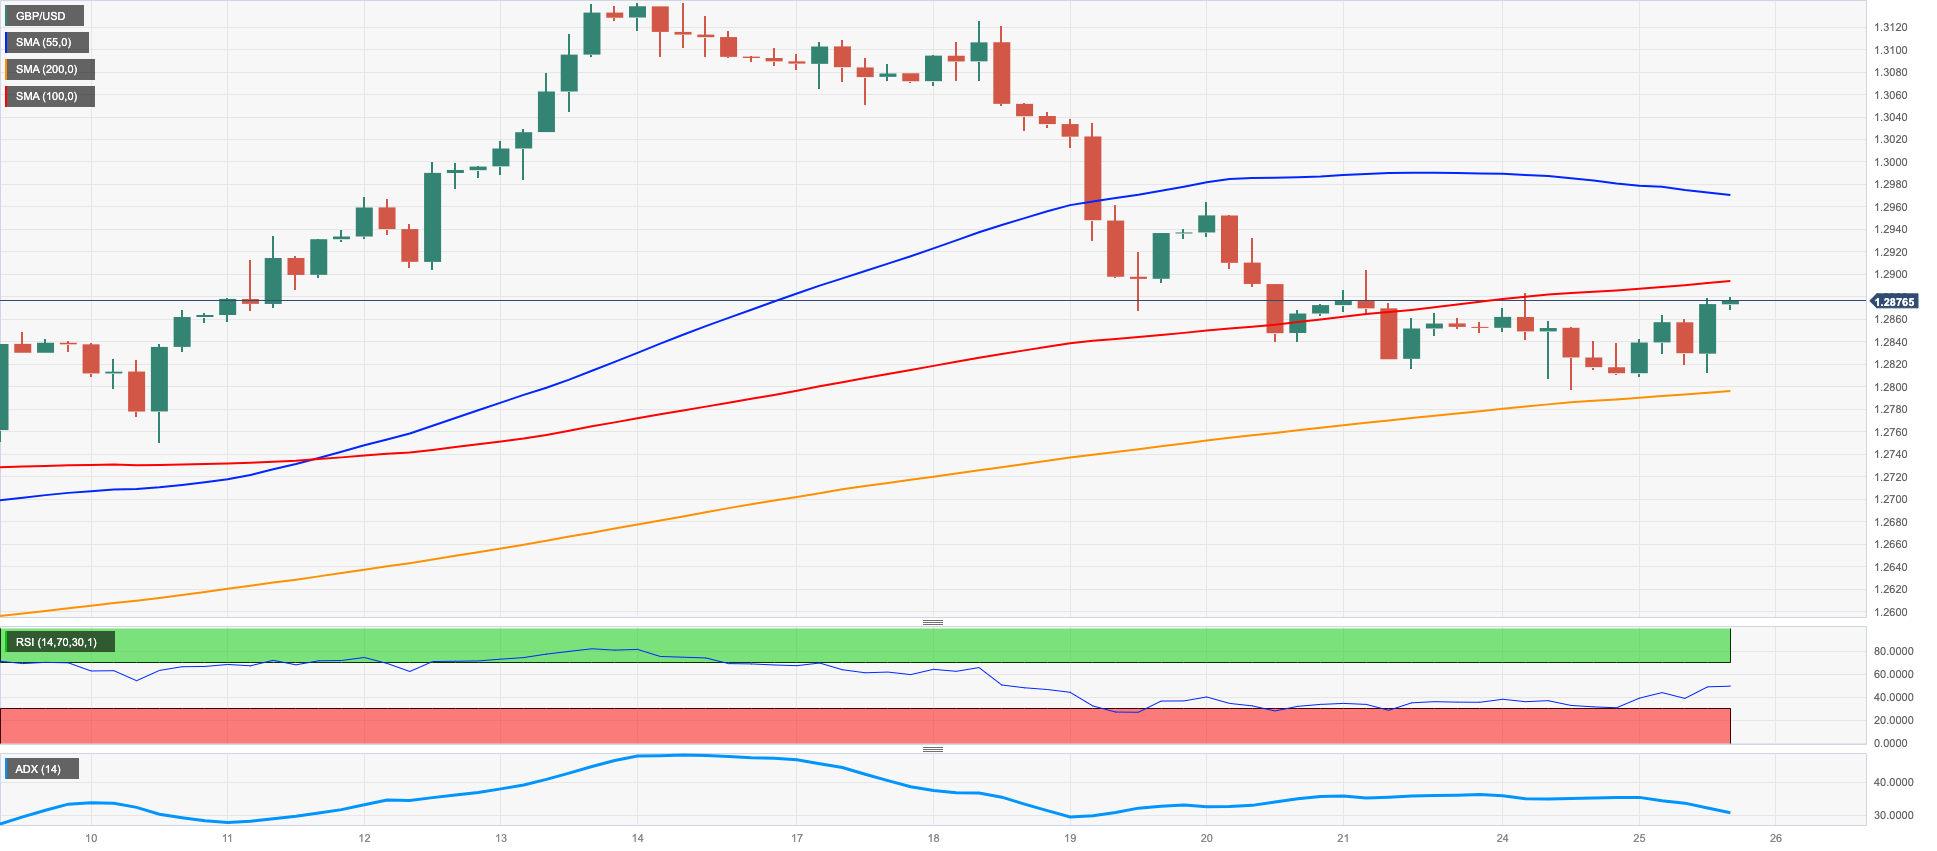
The British pound edged higher versus the greenback on Tuesday, motivating GBP/USD to notch a modest gain following seven straight days of declines.
The sterling’s slight recovery came as the dollar also inched up only marginally, amid caution ahead of the Fed's interest rate decision on Wednesday.
Still, the quid remained under pressure due to the dollar's rebound and diminished expectations for further aggressive rate hikes by the BoE, especially after recent UK inflation data.
Looking ahead, money markets are pricing in 25 bps hikes for both the bank's September and November meetings, with around a 60% chance of one final 25 bps increase in February. This would see the bank rate peak between 5.75% to 6.0%, lower than previous projections.
In the UK, some economic data provided a glimmer of optimism, with the CBI Business Optimism Index climbing to 6 in the third quarter and the CBI Industrial Trends Orders index ticking up slightly to -9 for the current month.
If the weekly low at 1.2797 is lost, GBP/USD may be forced to test the temporary 55-day SMA at 1.2656 before the weekly low of 1.2590 (June 29). The breakdown of the latter predicts a move to the 1.2520/10 band, which corresponds to the 2021-2023 trend line and the interim 100-day SMA. Before the key 200-day SMA of 1.2259, the June low of 1.2368 (June 5) and the May low of 1.2308 (May 25) are reached. On the upside, if the 2023 high of 1.3142 (July 14) is cleared, spot could then challenge weekly tops at 1.3146 (April 14, 2022) and 1.3298 (March 23, 2022). The daily RSI remained around the 50 zone
Resistance levels: 1.2964 1.3125 1.3142 (4H chart)
Support levels: 1.2797 1.2750 1.2591 (4H chart)
AUDUSD
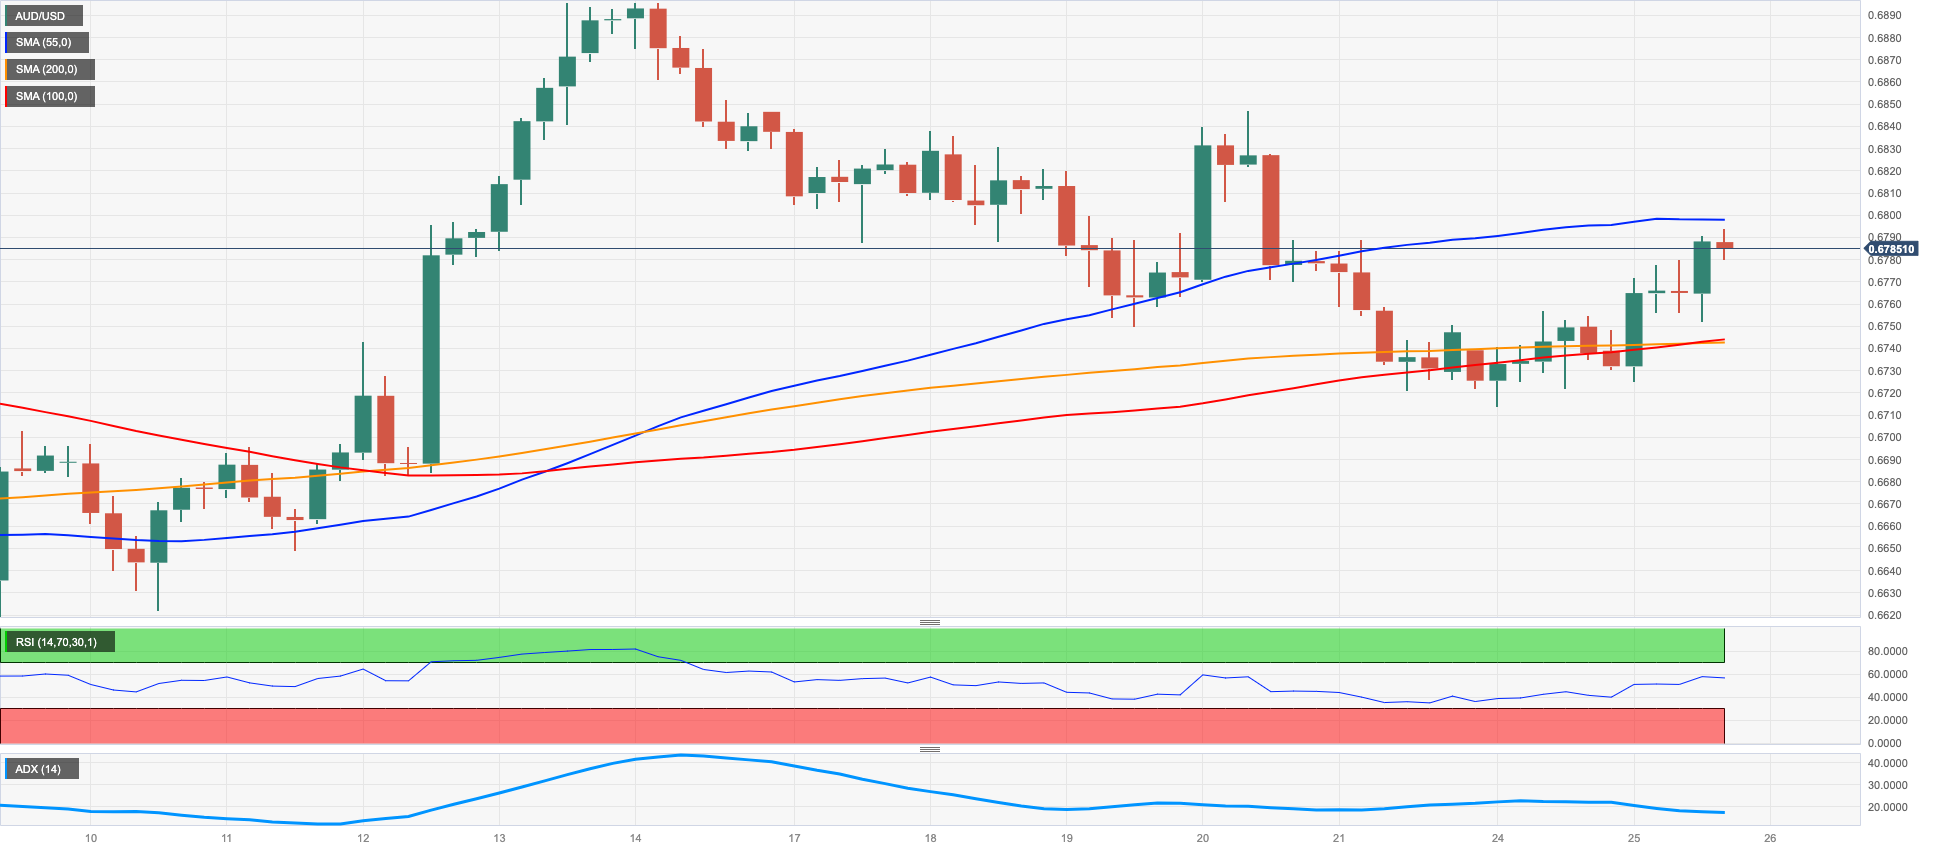
On Tuesday, AUD/USD maintained a strong position and made gains close to the 0.6800 region, adding to the positive momentum from the beginning of the week.
The overall positive sentiment in the commodity market supported the Aussie dollar's upward trend, which gained further strength due to the weakening of the greenback towards the end of the session.
There were no significant economic events or data releases in Australia on Tuesday, with investors looking forward to the announcement of important inflation figures on Wednesday.
Further gains in AUD/USD now target the July high of 0.6894 (July 13) just followed by the June top of 0.6899 (June 16). A break of this zone might pave the way for a trip to the important 0.7000 level before the weekly peak of 0.7029 (February 14) and the 2023 high of 0.7157 (February 2). On the contrary, the weekly low of 0.6714 (July 24) is immediately to the downside, which looks to be supported by the crucial 200-day SMA. If prices continue to fall, the weekly low of 0.6595 (June 29) might be tested before the 2023 low of 0.6458 (May 31). The November 2022 low of 0.6272 (November 3) occurs south of here, before the 2022 low of 0.6169 (October 13). The RSI on a daily basis flirted with the 55 region.
Resistance levels: 0.6792 0.6846 0.6894 (4H chart)
Support levels: 0.6714 0.6650 0.6599 (4H chart)
GOLD
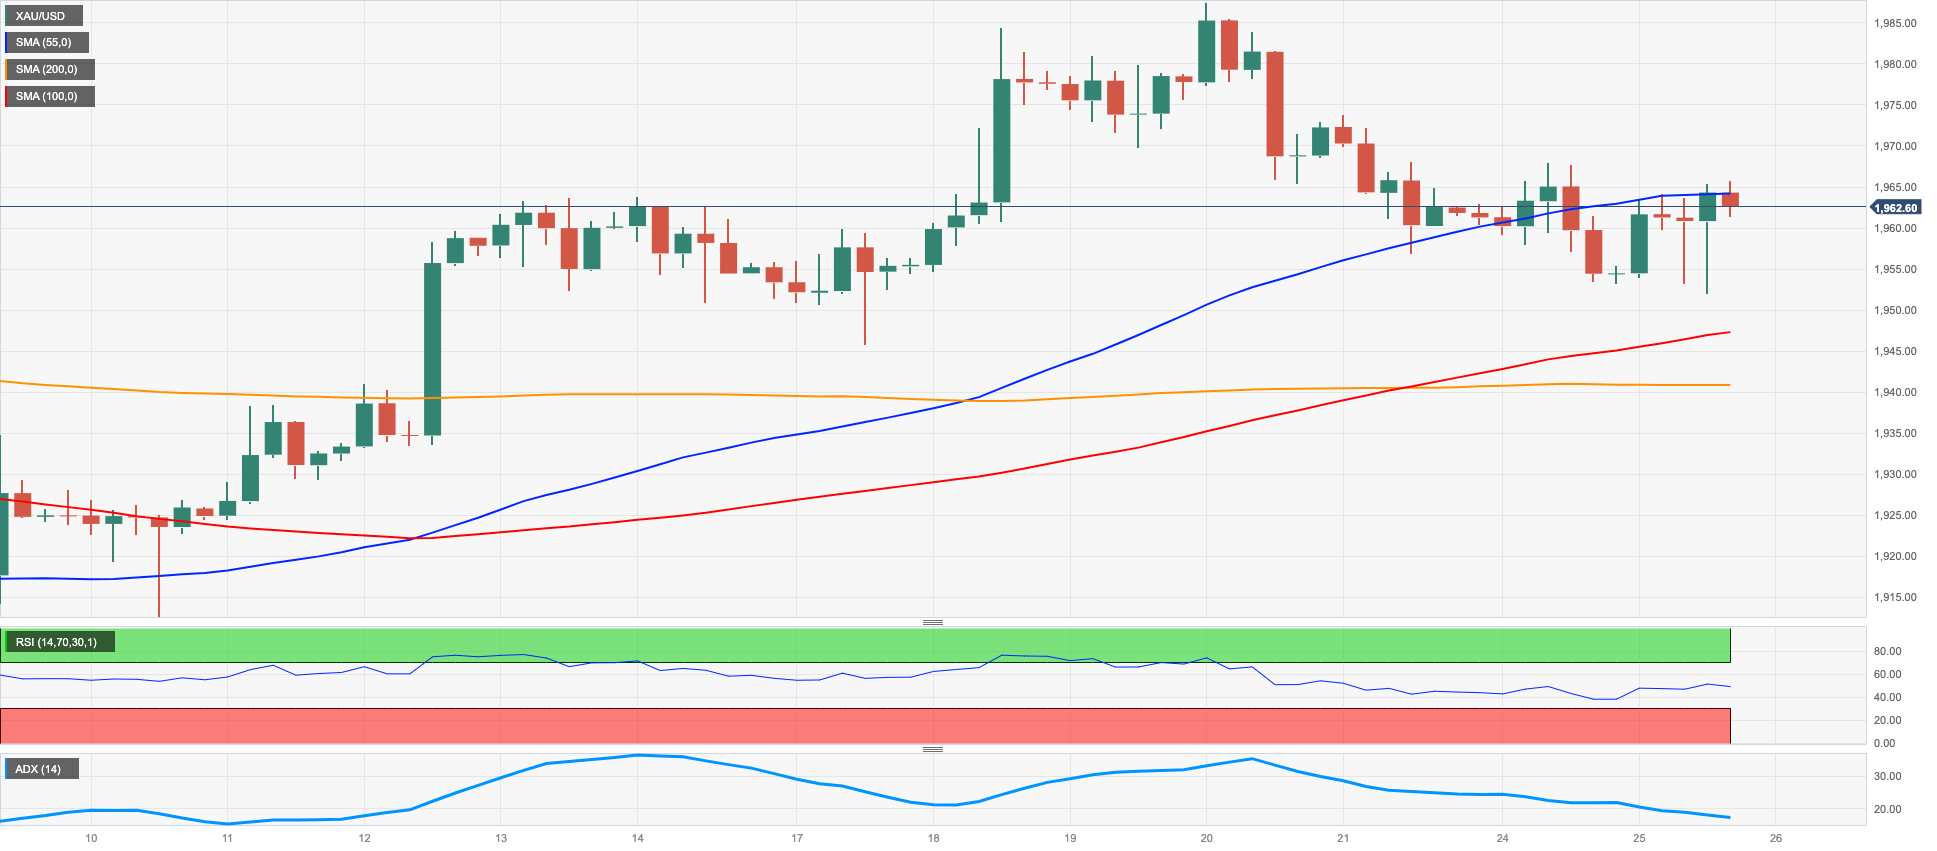
Gold prices bounced back on Tuesday after a 4-day decline and rose above the $1960 per troy ounce level.
The movement of the greenback was indecisive and US bond yields showed mixed performance across different maturity periods, which seemingly provided a fresh boost to the precious metal.
Moreover, investors' cautious approach ahead of the interest rate decisions by the FOMC and ECB on Wednesday and Thursday respectively, also helped to support the upward momentum in gold prices.
If selling pressure intensifies, gold is expected to face immediate support around the weekly low of $1945 (July 17). If this level is broken, the $1900 round level will be revealed before the June low of $1893 (June 29). South of here is the significant 200-day SMA at $1881, followed by the 2023 low of $1804 (February 28) and the vital $1800 barrier. In contrast, a break above the July high of $1984 (July 18) might open the door to a test of the key $2000 level. There is no significant opposition to the north until the 2023 peak of $2067 (May 4), which follows the 2022 high of $2070 (March 8) and the all-time top of $2075 (August 7 2020).
Resistance levels: $1967 $1984 $2022 (4H chart)
Support levels: $1952 $1941 $1912 $1893 (4H chart)
CRUDE WTI
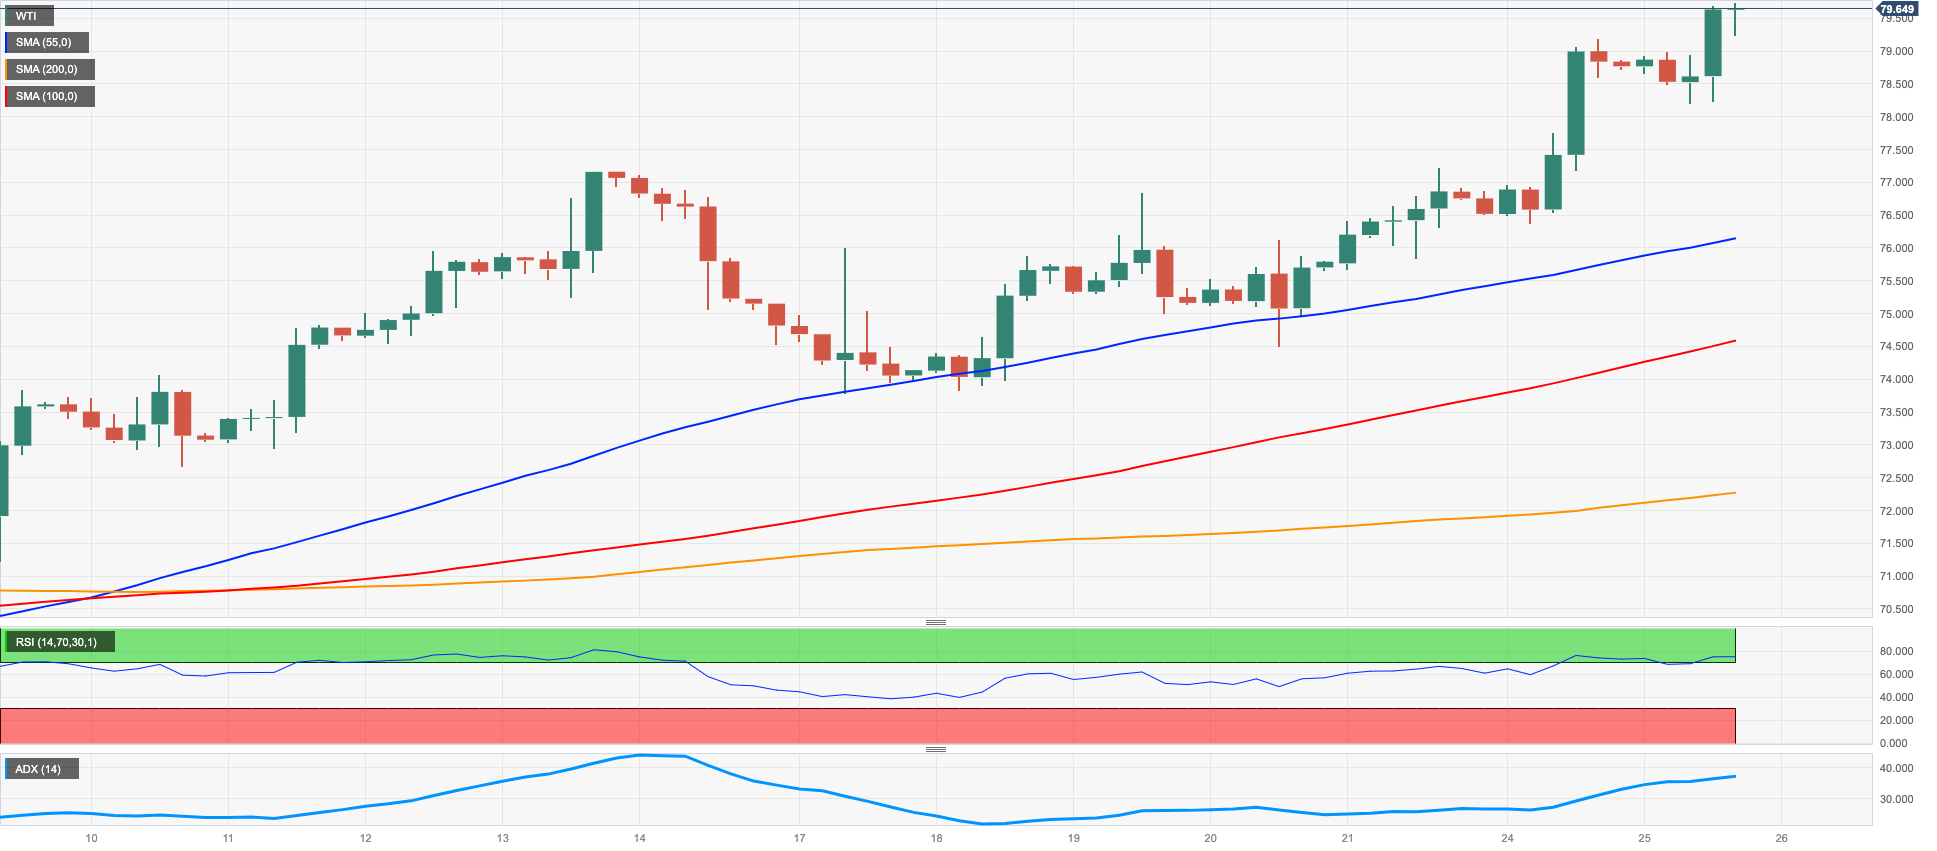
WTI prices continued their upward trajectory and came very close to reaching the significant barrier at $80.00 per barrel on Tuesday.
The commodity received an additional boost from the ongoing tight supply conditions in the market, which propelled prices to reach new 3-month highs just below $80.00.
Moreover, optimism surrounding the Chinese economy's potential for a strong rebound in the latter half of the year was bolstered by news of upcoming government stimulus measures.
Later during the North American session, the API (American Petroleum Institute) was scheduled to release its report on US crude oil supplies for the week ending July 21.
The break over the July high of $79.78 (July 25) indicates that a move to the critical $80.00 per barrel level is imminent. If the present uptrend continues, the 2023 high of $83.49 (April 12) might be recaptured before the November 2022 high of $93.73 (November 7). Just the opposite, a break of the weekly low of $73.89 (July 17) might put pressure on the transitory 100-day and 55-day SMAs of $73.51 and $72.07, respectively, ahead of the June low of $66.86 (June 13) and the 2023 low of $63.61 (May 4). Both the December 2021 low of $62.46 and the key $60.00 per barrel are below here.
Resistance levels: $79.78 $81.52 $83.49 (4H chart)
Support levels: $76.17 $73.81 $71.79 (4H chart)
GER40
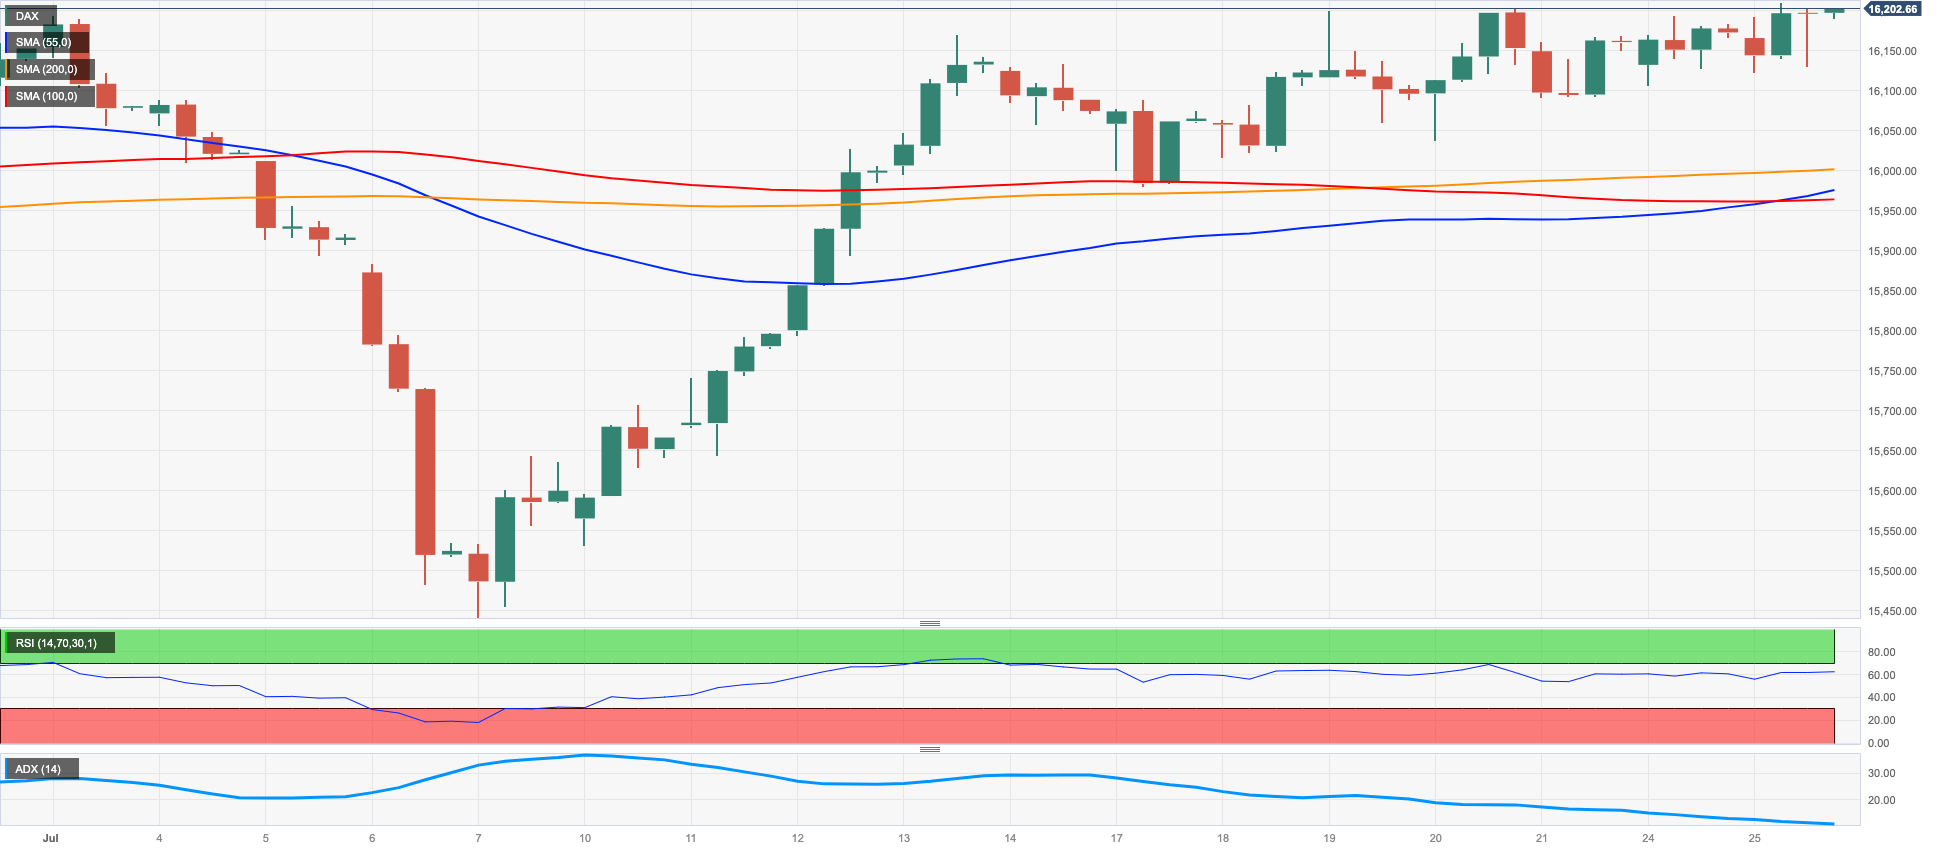
Germany's benchmark stock index, the DAX, increased further on Monday, continuing the consolidation phase it has been within since mid-July.
The index rose for the second straight session, supported by ongoing optimism regarding corporate earnings results and cautious optimism ahead of the upcoming Federal Reserve and European Central Bank policy meetings on Wednesday and Thursday respectively.
Investors shrugged off disappointing readings from Germany's Business Climate survey for July, conducted by the IFO Institute, as well as the gloomy IMF growth forecast which now projects the German economy will contract 0.3% this year.
The DAX40's weekly high of 16240 (July 19) sits just below the all-time high of 16427 (June 16). The intermediate 55-day and 100-day SMAs, which are at 16005 and 15795, respectively, look to be the first hurdle for bears as they approach the July low of 15456 (July 7). If the latter is breached, a retest of the 200-day SMA at 15101 before the March low of 14458 (March 20) and the December 2022 low of 13791 (December 20) is possible. The daily RSI seems to be consistent around 58.
Best Performers: Adidas, Siemens Healthineers, Beiersdorf AG
Worst Performers: MTU Aero, Airbus Group, Commerzbank
Resistance levels: 16240 16427 17000? (4H chart)
Support levels: 15995 15978 15456 (4H chart)
NASDAQ
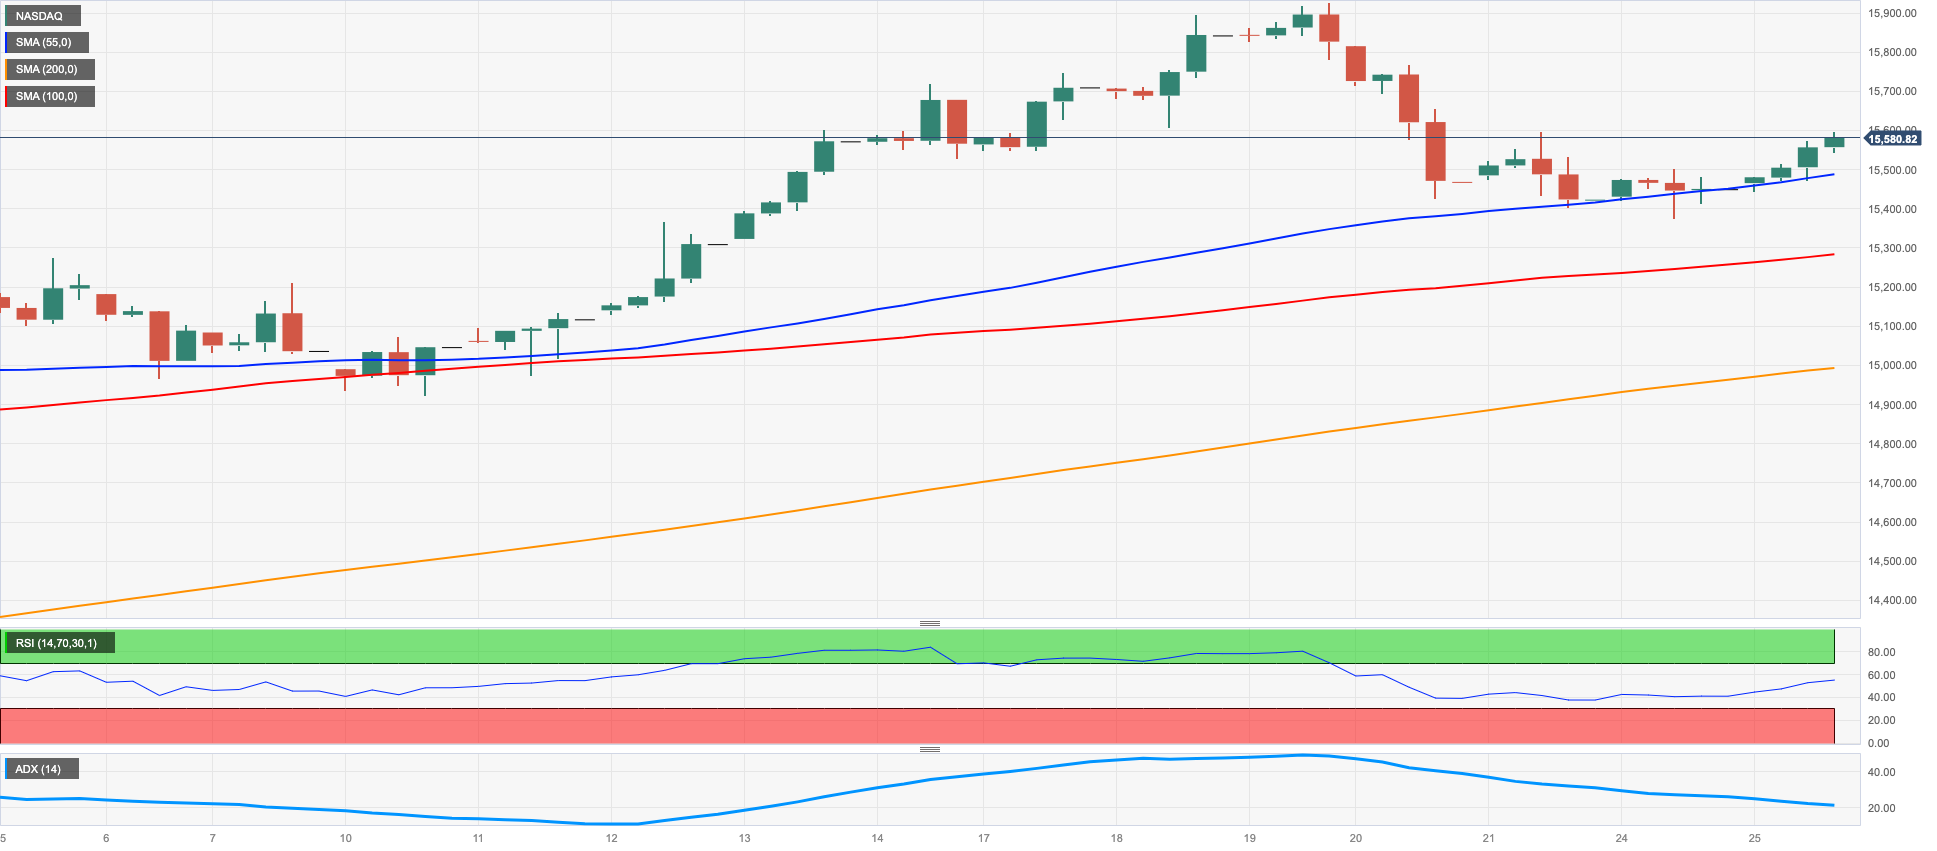
US tech stocks included in the Nasdaq 100 index extended their gains from Monday and approached the 15600 level on turnaround Tuesday.
Investors maintained an optimistic outlook, with many viewing the situation as a glass “half full”, as they awaited the outcome of the FOMC event scheduled for Wednesday. There was increasing speculation that the Federal Reserve might end its tightening cycle earlier than expected, adding to the positive sentiment.
Furthermore, investors were optimistic about the upcoming earnings reports from major companies such as Microsoft and Alphabet, among others.
The Nasdaq 100 will have hit the round milestone of 16000 when it reaches the 2023 high of 15932 (July 19). On the downside, the July low of 14924 (July 10), followed by weekly lows of 14687 (June 26), 14283 (June 7), and 13520 (May 24), may signal the beginning of discontent. A further drop may push the price below the May low of 12938 (May 4), which was followed by the April low of 12724 (April 25), the 200-day SMA at 12671, and the March low of 11695 (March 13). The daily RSI increased modestly past the 62 mark.
Top Gainers: Zscaler, PDD Holdings DRC, Datadog
Top Losers: Sirius XM, Biogen, Align
Resistance levels: 15932 16017 16607 (4H chart)
Support levels: 15374 14924 14687 (4H chart)
DOW JONES
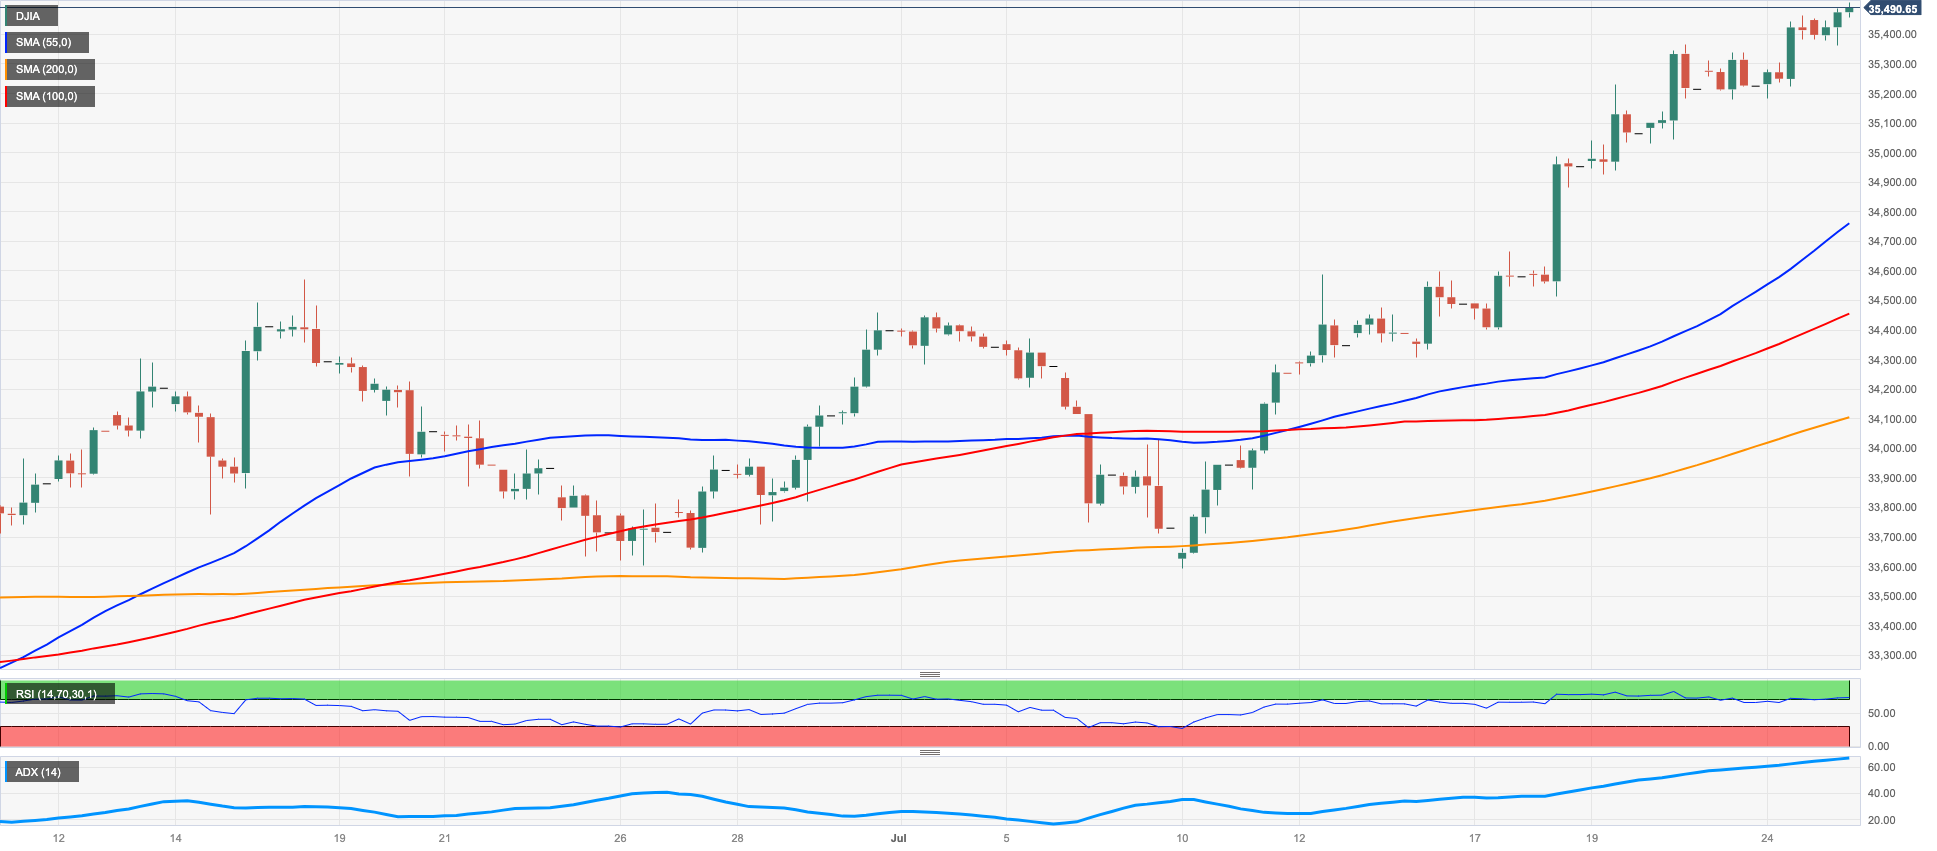
Once again, the Dow Jones has hit a new high, surpassing the 35500 level for the first time since February 2022.
Investors remained optimistic as they awaited important earnings reports from major companies Microsoft and Alphabet. Additionally, the possibility that the Federal Reserve could end its hiking cycle earlier than expected contributed to the overall positive sentiment among market participants.
On the whole, the Dow Jones advanced 0.25% to 35500, the S&P500 gained 0.42% to 4573, and the tech-benchmark Nasdaq Composite rose 0.89% to 14183.
If the Dow Jones leaves behind the 2023 high of 35513 (July 25), it may attempt to test the February 2022 top of 35824 (February 9) ahead of the all-time peak at 36952 (January 5 2022). On the flip side, the transitory 55-day SMA at 33899 is expected to provide early support before the weekly low of 33610 (June 26) and the temporary 100-day SMA at 33541. The loss of this zone could put a test of the key the 200-day SMA of 33280 back on the radar prior to the May low of 32586 (May 25) and the 2023 low of 31429 (March 15). The daily RSI stayed considerably over 74, indicating extreme overbought conditions.
Top Performers: 3M, Dow, Caterpillar
Worst Performers: Merck&Co, Travelers, Boeing
Resistance levels: 35513 35824 36513 (4H chart)
Support levels: 34375 33705 33530 (4H chart)
MACROECONOMIC EVENTS

All Information & Updates provided by:

All information relating to the financial markets available on this page has been prepared and issued by FXStreet (Forexstreet SL, Spain, Reg: B62498233) on the basis of publicly available information and all information believed to be reliable and does not conflict with Kuwaiti local laws, and all necessary care has been taken to before the company to ensure that the facts mentioned are correct from the source.
NCM Investment nor any of its directors or employees shall in any way be held responsible for the contents of this news, and the information contained on this page is intended only to provide clients with publicly available information and should not be construed as investment advice, report or analysis and/or constitute an offer or invitation to buy or sell financial instruments of any kind.
RISK WARNING: Forex and CFDs are highly risky leveraged products, as losses can exceed deposits. Please ensure you understand all the risks and take independent advice if necessary. NCM will segregate the clients based on the criteria of the regulator and its bylaws. NCM does not provide any advisory service; the material published does not constitute advice or a recommendation for a transaction in any financial instrument. NCM accepts no responsibility for any use of the content presented and any consequences of that use. Anyone acting on the information provided does so at their own risk.