
- Contact Us:
-

-

-

-


Daily Market Updates
27 Jul 2023
USDJPY
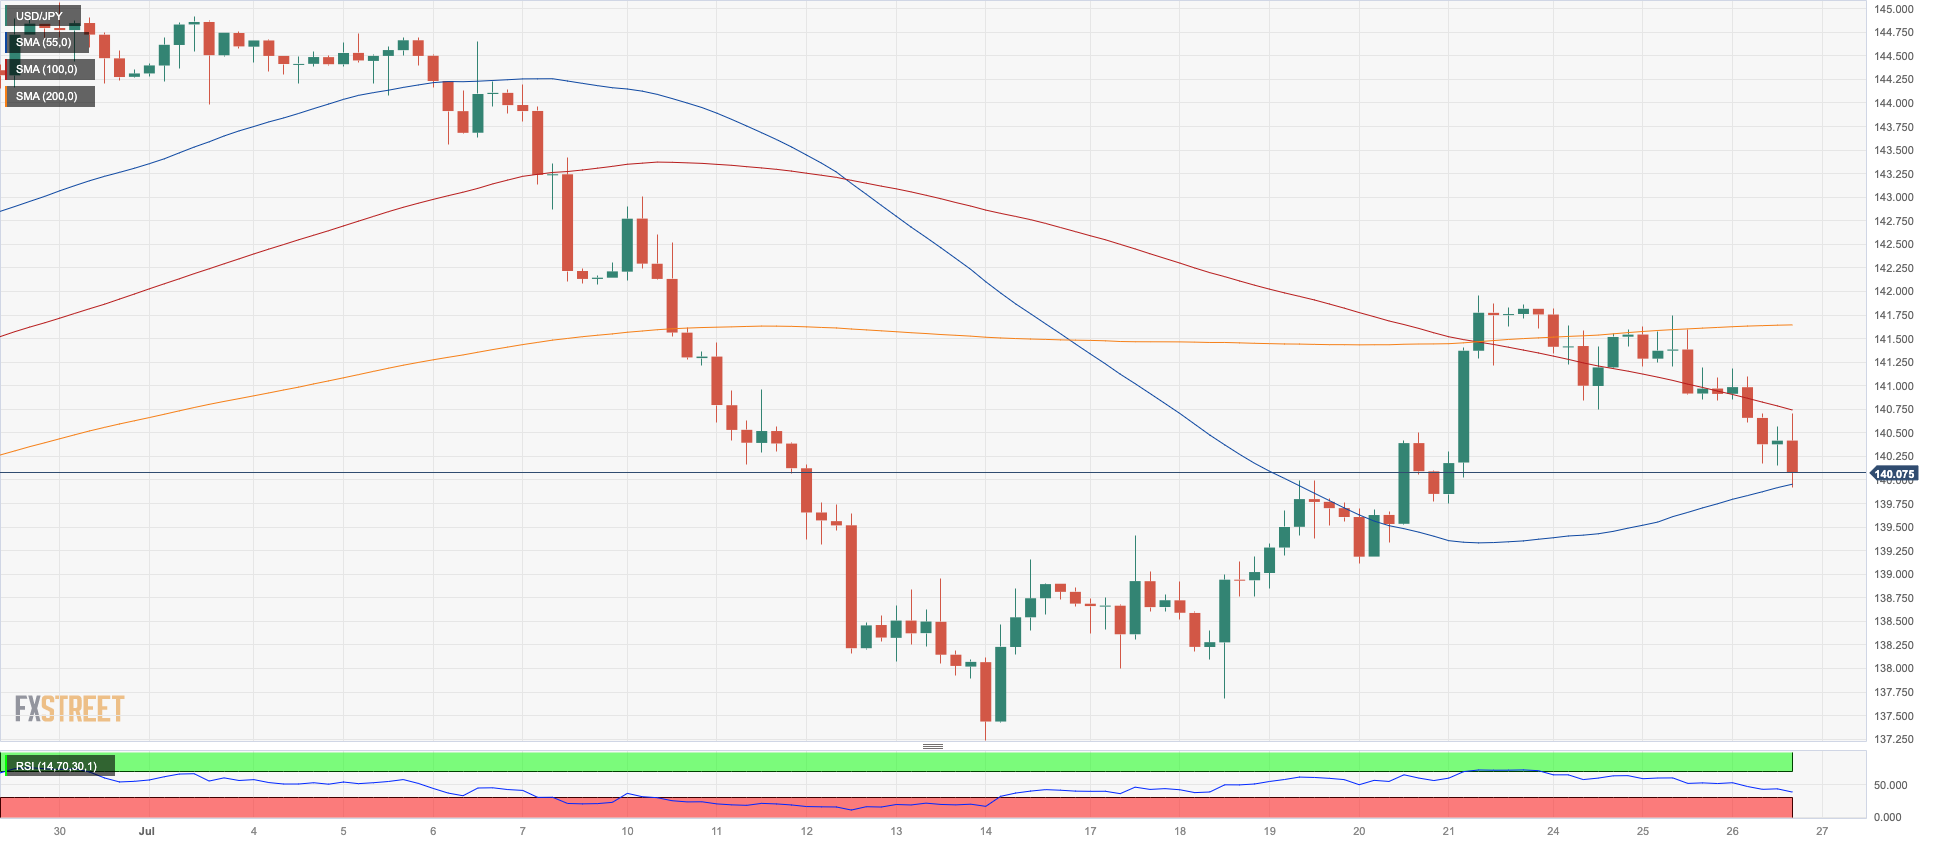
USD/JPY continued its decline for the third consecutive session on Wednesday, marking a disappointing start to the week and following the rejection from tops near the 142.00 yardstick, which occurred last week.
The pair's downtrend on Wednesday was a result of the corrective retracement in the greenback and the generalized drop in US yields that occurred after the Federal Reserve's decision to raise rates by 25 basis points, as was widely expected.
Turning to economic data from Japan, the final figures for the month of May revealed the Coincident Index at 114.3 and the Leading Economic Index at 109.2.
Bulls face an immediate obstacle at the weekly high of 141.95 (July 21) ahead of the 2023 top of 145.07 (June 30) and the 2022 peak of 151.94 (October 21). On the flip side, the July low of 137.23 (July 14) emerges a an immediate contention just over the significant 200-day SMA of 136.77. Before the April low of 130.62 (April 5) and the important round level of 130.00, the weekly low of 133.01 (April 26) and a minor support of 132.01 (April 13) are located. For the day, the RSI eased to the proximity of 46.
Resistance levels: 141.56 141.96 143.00 (4H chart)
Support levels: 139.92 139.10 137.67 (4H chart)
GBPUSD
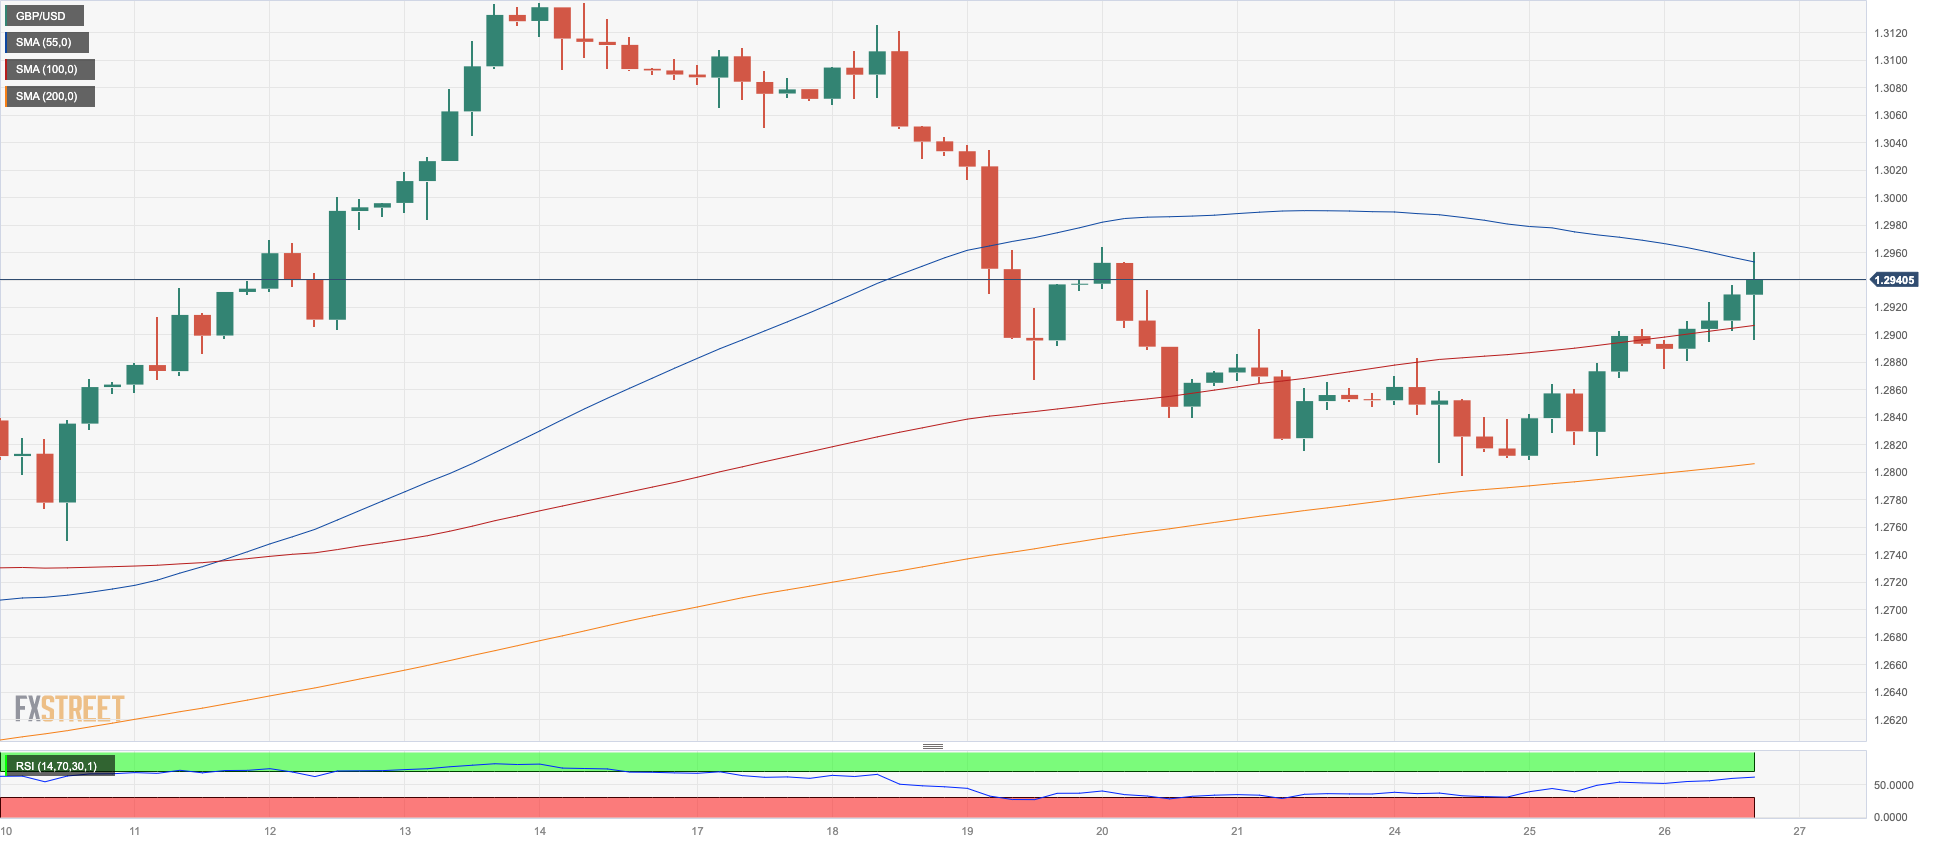
The British pound continued its upward trajectory for the week, gaining ground for the second consecutive session on Wednesday and surpassing the 1.2900 level, following a positive session on Monday.
The US dollar's weakness contributed to the positive momentum, providing some relief for the riskier assets, especially following the FOMC event, which saw the USD index (DXY) pick up extra downside impulse.
Looking ahead, the money markets predict that the bank will increase the interest rate by 25 bps at both the September and November meetings, with a probability of about 60% for one more quarter-point hike in February. This would mean that the bank rate will reach a peak of between 5.75% to 6.0%, which is lower than the previous estimates.
There were no scheduled economic releases in the region on Wednesday.
GBP/USD might test the weekly tops at 1.3146 (April 14, 2022) and 1.3298 (March 23, 2022) if the 2023 high of 1.3142 (July 14) is cleared. Just the opposite, the loss of the weekly low of 1.2797 (July 24) might force spot to test the short-term 55-day SMA at 1.2662 before reaching the previous week's bottom of 1.2590 (June 29). Down from here comes the temporary 100-day SMA at 1.2535 prior to the 1.2510 zone, which is corresponding to the 2021–2023 trend line. The June low of 1.2368 (June 5) and the May low of 1.2308 (May 25) are reached prior to the crucial 200-day SMA of 1.2268. The daily RSI improved north of the 56 yardstick.
Resistance levels: 1.2959 1.3125 1.3142 (4H chart)
Support levels: 1.2797 1.2750 1.2591 (4H chart)
AUDUSD
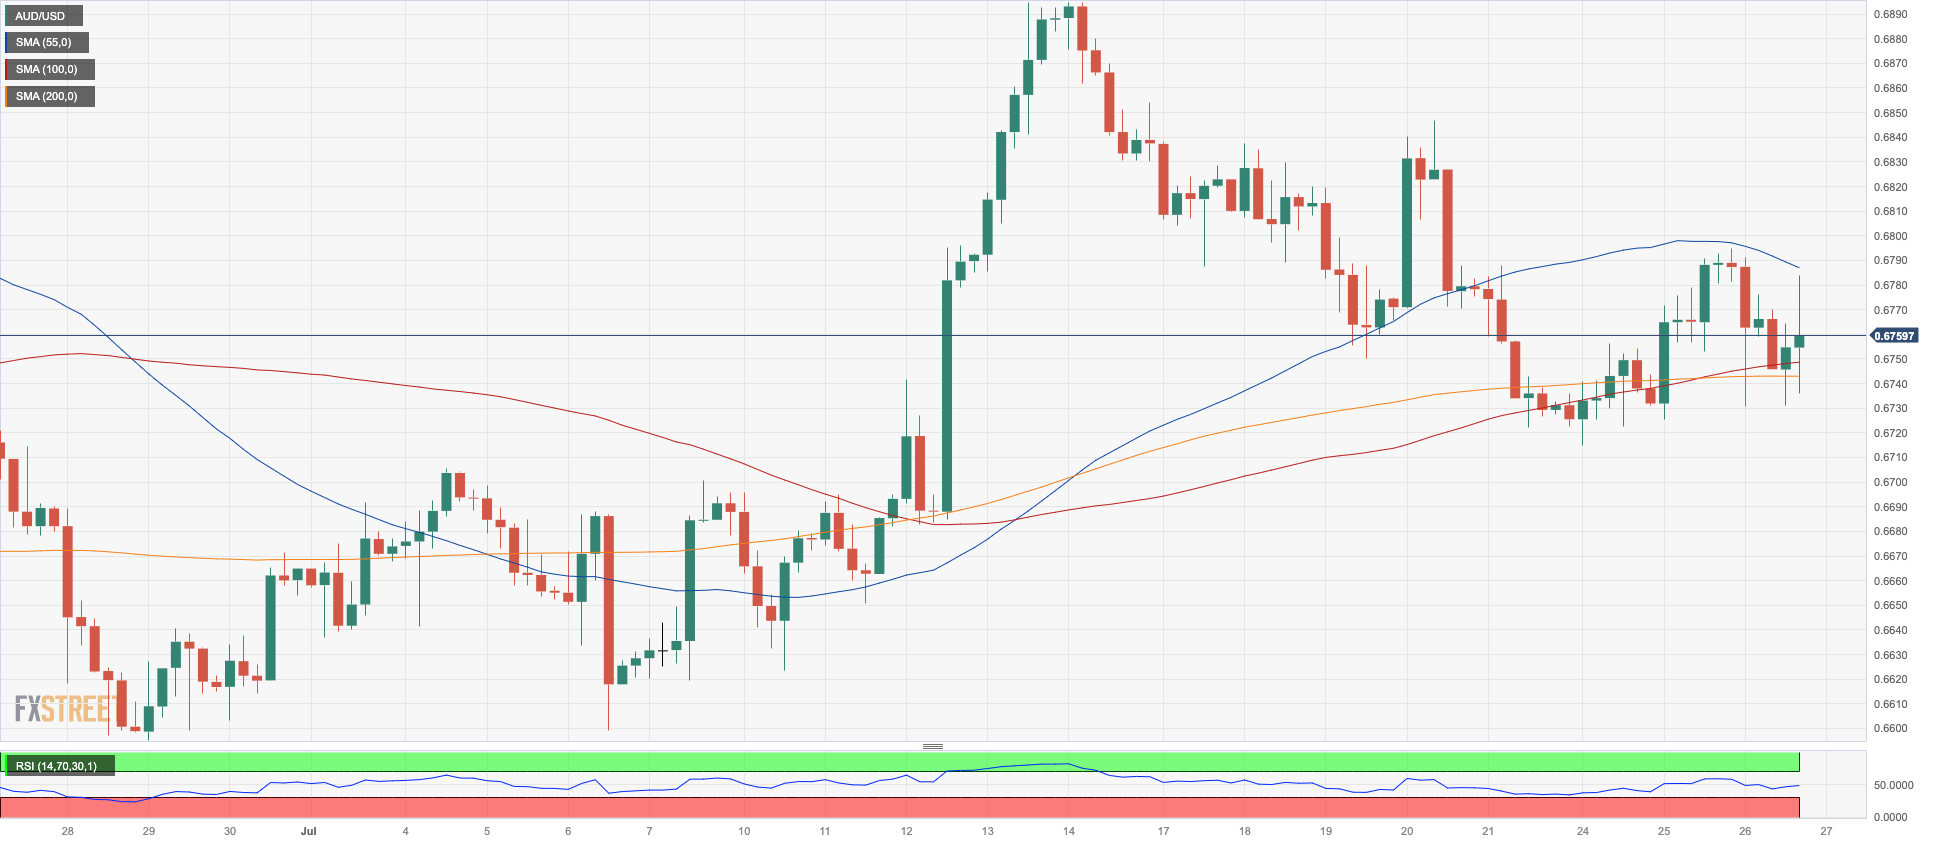
Despite the greenback retreating for two straight sessions, the Aussie dollar declined against it on Wednesday, motivating AUD/USD to end two consecutive daily gains.
The pair dipped to around $0.6720, near its 200-day moving average, primarily due to softer-than-expected Australian inflation data., while the mostly negative session for commodity prices likely also contributed to the daily pullback.
Australian inflation data came in below estimates. The annual Inflation Rate increased 6% in the second quarter but slowed to 0.8% on a quarterly basis. Additionally, the Monthly CPI Indicator rose 5.4% in June, down from 5.5% the prior month.
The July high of 0.6894 (July 13) and the June peak of 0.6899 (June 16) are the current targets for additional advances in AUD/USD. Before the weekly top of 0.7029 (February 14) and the 2023 high of 0.7157 (February 2), a break of this zone would open the door for a journey to the crucial 0.7000 level. On the other hand, the critical 200-day SMA (0.6724) appears to be supporting a downward move towards the recent weekly low of 0.6714 (July 24). The weekly low of 0.6595 (June 29) may be hit before the 2023 low of 0.6458 (May 31), if prices keep dropping. South of here, before the 2022 low of 0.6169 (October 13), is the 0.6272 low for November 2022 (November 3). The everyday RSI dropped below the 52 yardstick.
Resistance levels: 0.6794 0.6846 0.6894 (4H chart)
Support levels: 0.6714 0.6650 0.6599 (4H chart)
GOLD
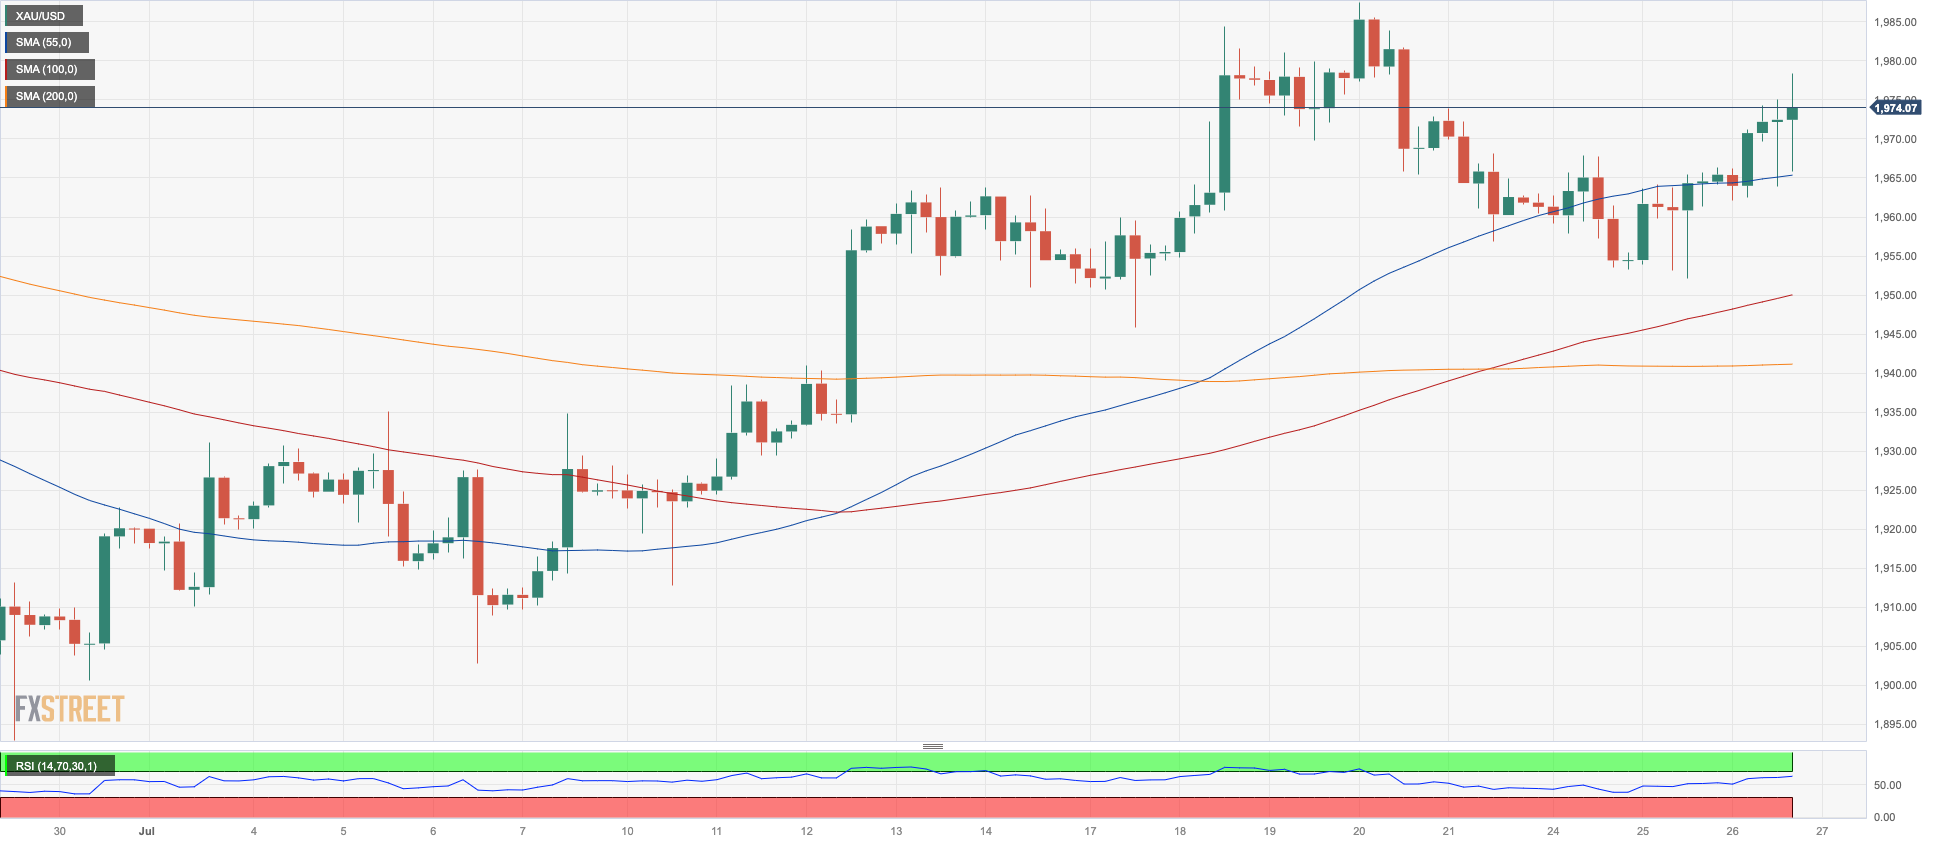
The cost of one troy ounce of the yellow metal increased and continued to rise on Wednesday, approaching the $1980 mark.
This upward trend can be attributed to the consistent decrease in the value of the dollar, along with falling US yields, particularly after the FOMC event.
This has provided renewed momentum for the bullion market's weekly recovery and has kept the target for monthly peaks above $1980 (which was reached on July 20th) within reach.
Further rebound in gold should meet the initial up-barrier at the July high of $1984 (July 18) prior to the important $2000 level. Further up aligns the 2023 peak of $2067 (May 4) seconded by the 2022 high of $2070 (March 8) and the all-time high of $2075 (August 7 2020). On the contrary, the metal is expected to encounter immediate contention near the weekly low of $1945 (July 17) before the $1900 round level and the June low of $1893 (June 29). The loss of the latter exposes the important 200-day SMA at $1882 ahead of the 2023 low of $1804 (February 28) and the crucial $1800 threshold.
Resistance levels: $1978 $1984 $2022 (4H chart)
Support levels: $1952 $1941 $1912 $1893 (4H chart)
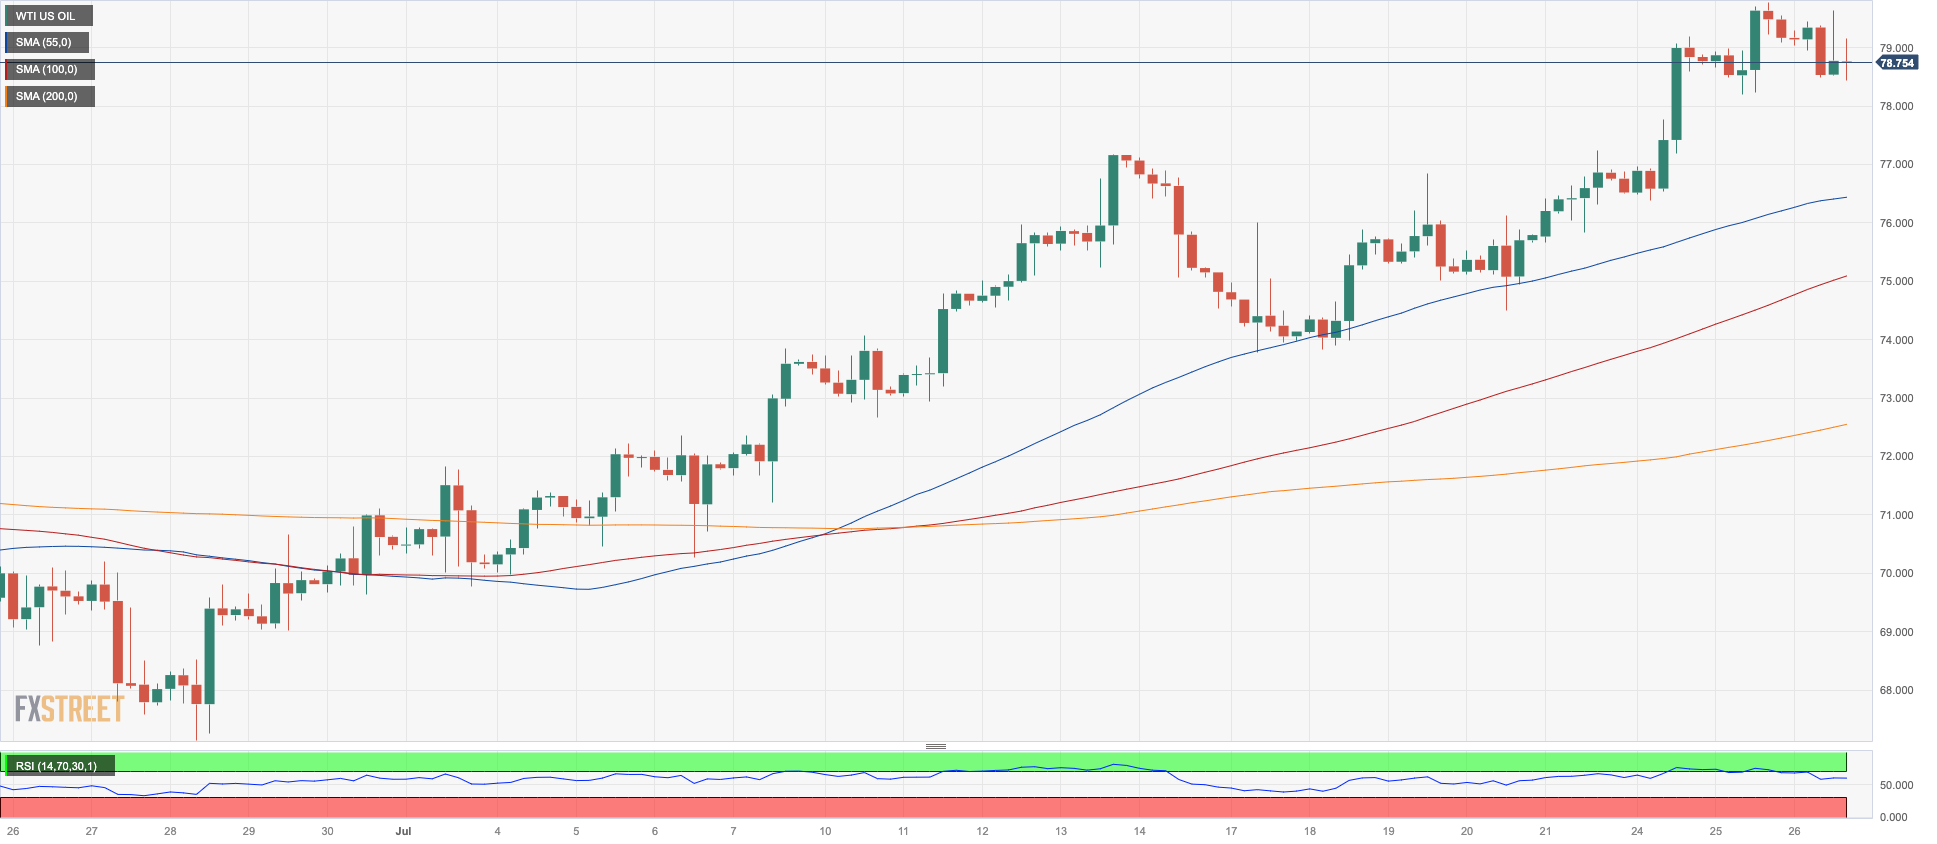
CRUDE WTI
Prices of WTI dropped modestly on Wednesday on the back of disappointing weekly prints from the EIA report, while the expected increase of Russian exports in September also played against the continuation of the rally in the commodity.
Back at the EIA, its report showed that crude oil inventories shrank by 0.600M barrels in the week to July 21, while supplies at Cushing dropped by 2.609M barrels, Weekly Distillate Stocks went down by 0.245M barrels, and gasoline stockpiles decreased by 0.786M barrels.
Somewhat limiting the downside emerged the softer tone in the US dollar as well as steady hopes on a strong economic recovery in China in the second part of the year.
Immediately to the upside in WTI emerges the crucial $80.00 mark per barrel seconded by the 2023 high of $83.49 (April 12) and the November 2022 top of $93.73 (November 7). On the downside, a break of the weekly low of $73.89 (July 17) might put pressure on the short-term 100-day and 55-day SMAs of $73.49 and $72.17, respectively, ahead of the June low of $66.86 (June 13) and the 2023 low of $63.61 (May 4). The December 2021 low of $62.46 and the crucial $60.00 per barrel are both down here.
Resistance levels: $79.86 $81.52 $83.49 (4H chart)
Support levels: $76.53 $73.81 $71.79 (4H chart)
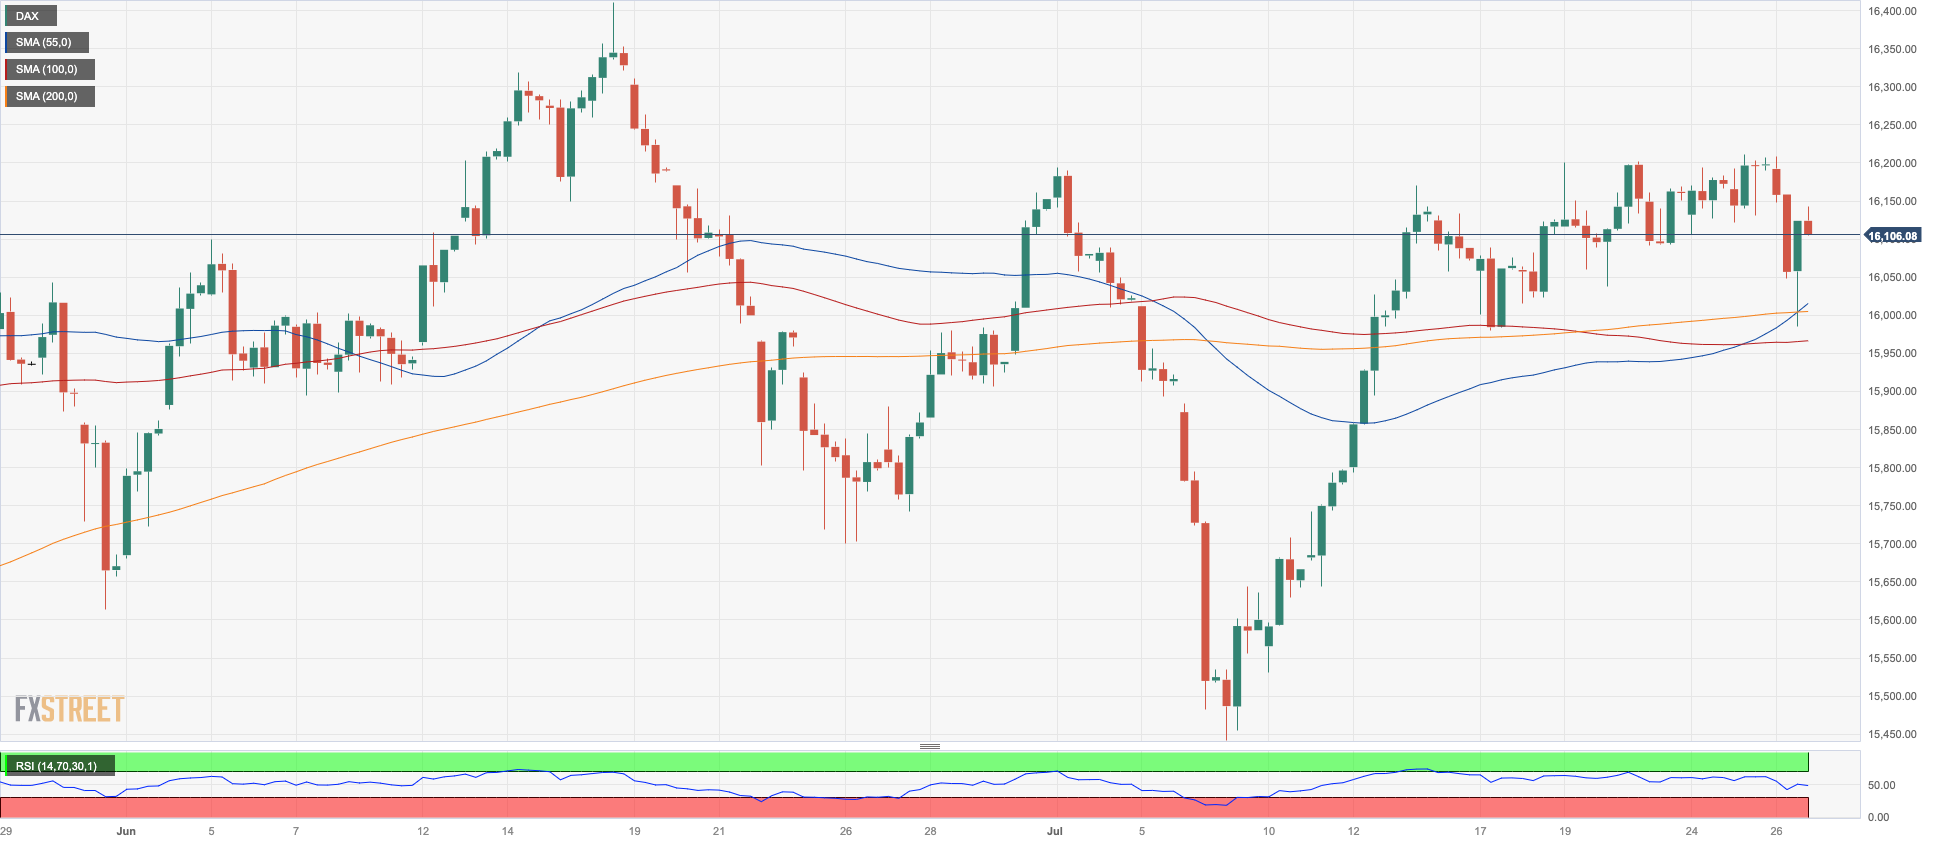
GER40
European stocks suffered widespread losses on Wednesday, with the majority of indices finishing the day in negative territory. Germany's DAX40, a key benchmark index, was no exception, surrendering two straight days of gains and retreating to the 16000 region. The downside test at this level was met with some support, however.
Several factors contributed to the subdued investor sentiment, including the release of more corporate earnings reports and mounting caution ahead of the FOMC event. Additionally, the anticipated interest rate hike by the European Central Bank (ECB) on Thursday appeared to dampen risk appetite.
In the German bond market, 10-year bund yields surged to multi-day highs around 2.47%, mirroring the trend in US Treasury yields.
The weekly high of 16240 for the DAX40 (July 19) is barely shy of the record high of 16427 (June 16). As bears get closer to the July low of 15456 (July 7), the intermediate 55-day and 100-day SMAs, which are at 16009 and 15800, respectively, appear to be the first obstacle. The 200-day SMA at 15120 could be tested again before the March low of 14458 (March 20) and the December 2022 low of 13791 (December 20) if the latter is broken. The daily RSI deflated to the vicinity of 54.
Best Performers: Fresenius SE, RWE AG ST, Deutsche Bank AG
Worst Performers: Adidas, MTU Aero, Dr Ing hc F Porsche Prf
Resistance levels: 16240 16427 17000? (4H chart)
Support levels: 16000 15981 15456 (4H chart)
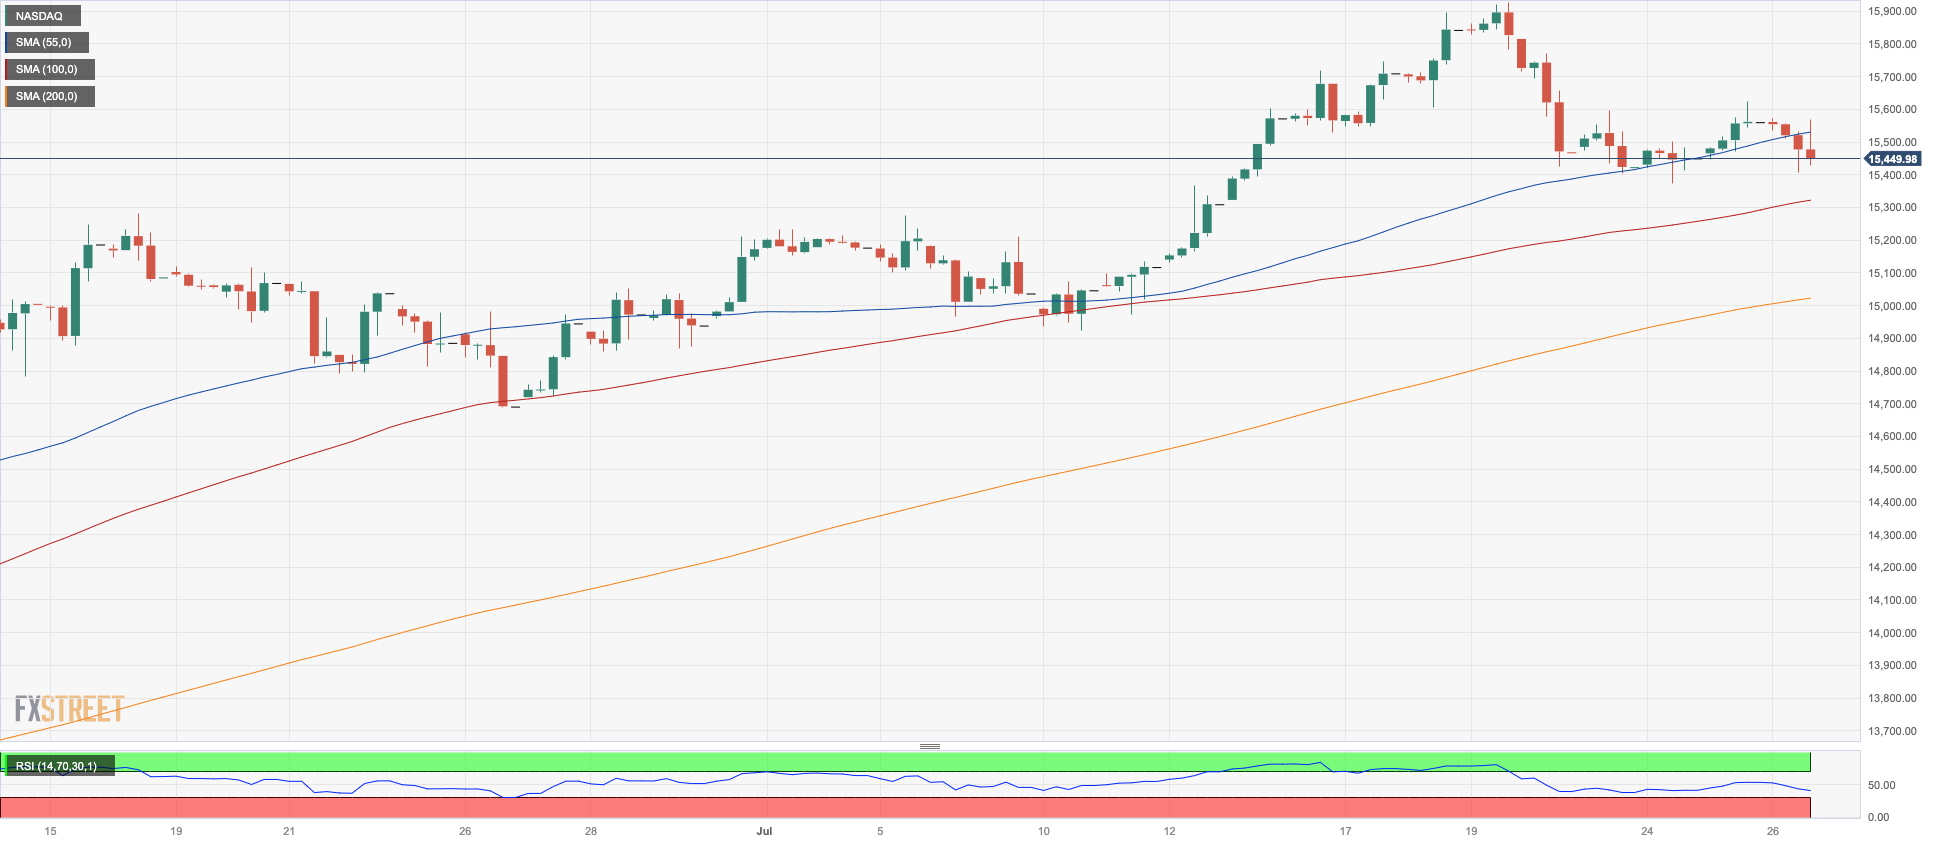
NASDAQ
The US tech sector extended the erratic performance seen in past sessions and retreated modestly when tracked by the reference index Nasdaq 100 on Wednesday.
Indeed, the index reversed two consecutive sessions of gains on Wednesday despite extra losses in the greenback and the absence of a clear direction in US yields across all maturities, especially following the expected quarter-point interest rate raise by the Fed at its event.
The immediate up-barrier for the Nasdaq 100 comes at the 2023 high of 15932 (July 19) just ahead of the round milestone of 16000. On the opposite side, the July low of 14924 (July 10) precedes the weekly lows of 14687 (June 26), 14283 (June 7), and 13520 (May 24). A further decline might take the price below the May low of 12938 (May 4) prior to the April low of 12724, the 200-day SMA at 12691, and the March low of 11695 (March 13). The daily RSI ticked higher past the 54 mark.
Top Gainers: Alphabet A, Old Dominion Freight Line, Alphabet C
Top Losers: CoStar, Texas Instruments, Datadog
Resistance levels: 15622 15932 16017 (4H chart)
Support levels: 15374 14924 14687 (4H chart)
DOW JONES
US stocks tracked by the Dow Jones extended its positive performance for yet another session and printed a new 2023 peak past 35600 on Wednesday. The index, however, surrendered part of those gains to end the session broadly unchanged from Tuesday.
Indeed, the benchmark index navigated the 35600 region with decent gains after the Federal Reserved hiked the Fed Funds Target Range (FFTR) by 25 bps, as widely anticipated, while investors continued to look at earnings report for direction for the time being.
All in all, the Dow Jones gained 0.07% to 35457, the S&P500 dropped 0.23% to 4556, and the tech-heavy Nasdaq Composite deflated 0.40% to 14090.
The surpass of the 2023 high 35633 (July 26) should motivate the Dow Jones to dispute the February 2022 top of 35824 (February 9) before reaching the all-time high of 36952 (January 5 2022). On the other hand, early support is anticipated to come from the transient 55-day SMA at 33930 before the weekly low of 33610 (June 26) and the interim 100-day SMA at 33565. If this zone is lost, a test of the 200-day SMA of 33307 might return to the forefront of attention before the May low of 32586 (May 25) and the 2023 low of 31429 (March 15). The daily RSI continued to be over 74, signifying extremely overbought conditions.
Top Performers: Boeing, 3M, Home Depot
Worst Performers: Microsoft, Caterpillar, Chevron
Resistance levels: 35633 35824 36513 (4H chart)
Support levels: 34425 33705 33530 (4H chart)
-638259978301420931.png)
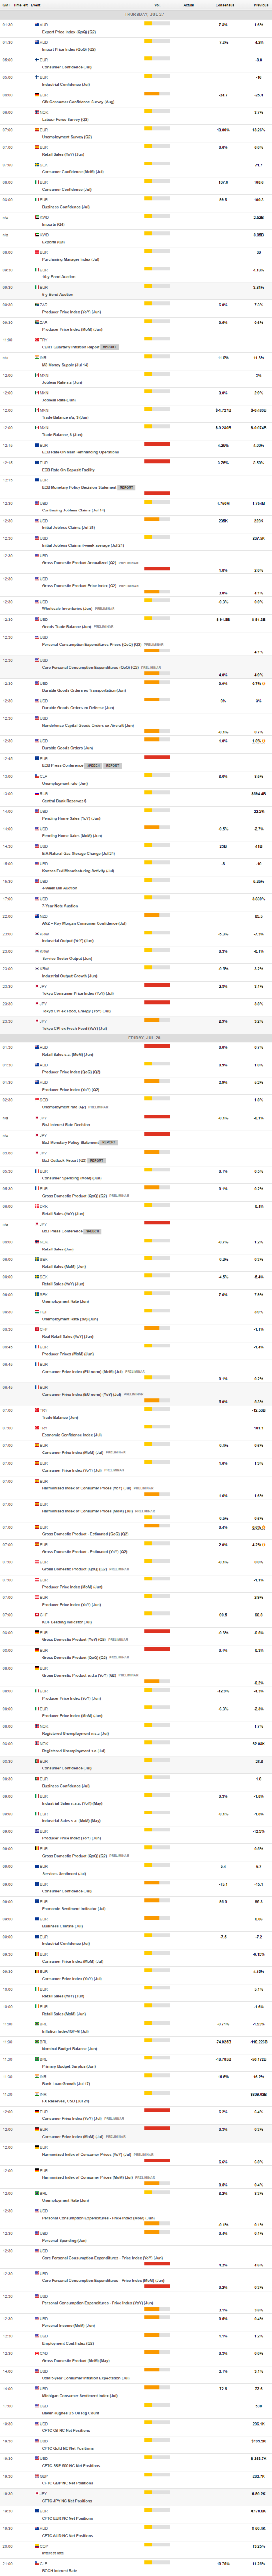
MACROECONOMIC EVENTS
All Information & Updates provided by:

All information relating to the financial markets available on this page has been prepared and issued by FXStreet (Forexstreet SL, Spain, Reg: B62498233) on the basis of publicly available information and all information believed to be reliable and does not conflict with Kuwaiti local laws, and all necessary care has been taken to before the company to ensure that the facts mentioned are correct from the source.
NCM Investment nor any of its directors or employees shall in any way be held responsible for the contents of this news, and the information contained on this page is intended only to provide clients with publicly available information and should not be construed as investment advice, report or analysis and/or constitute an offer or invitation to buy or sell financial instruments of any kind.
RISK WARNING: Forex and CFDs are highly risky leveraged products, as losses can exceed deposits. Please ensure you understand all the risks and take independent advice if necessary. NCM will segregate the clients based on the criteria of the regulator and its bylaws. NCM does not provide any advisory service; the material published does not constitute advice or a recommendation for a transaction in any financial instrument. NCM accepts no responsibility for any use of the content presented and any consequences of that use. Anyone acting on the information provided does so at their own risk.