
- Contact Us:
-

-

-

-


Daily Market Updates
28 Jul 2023
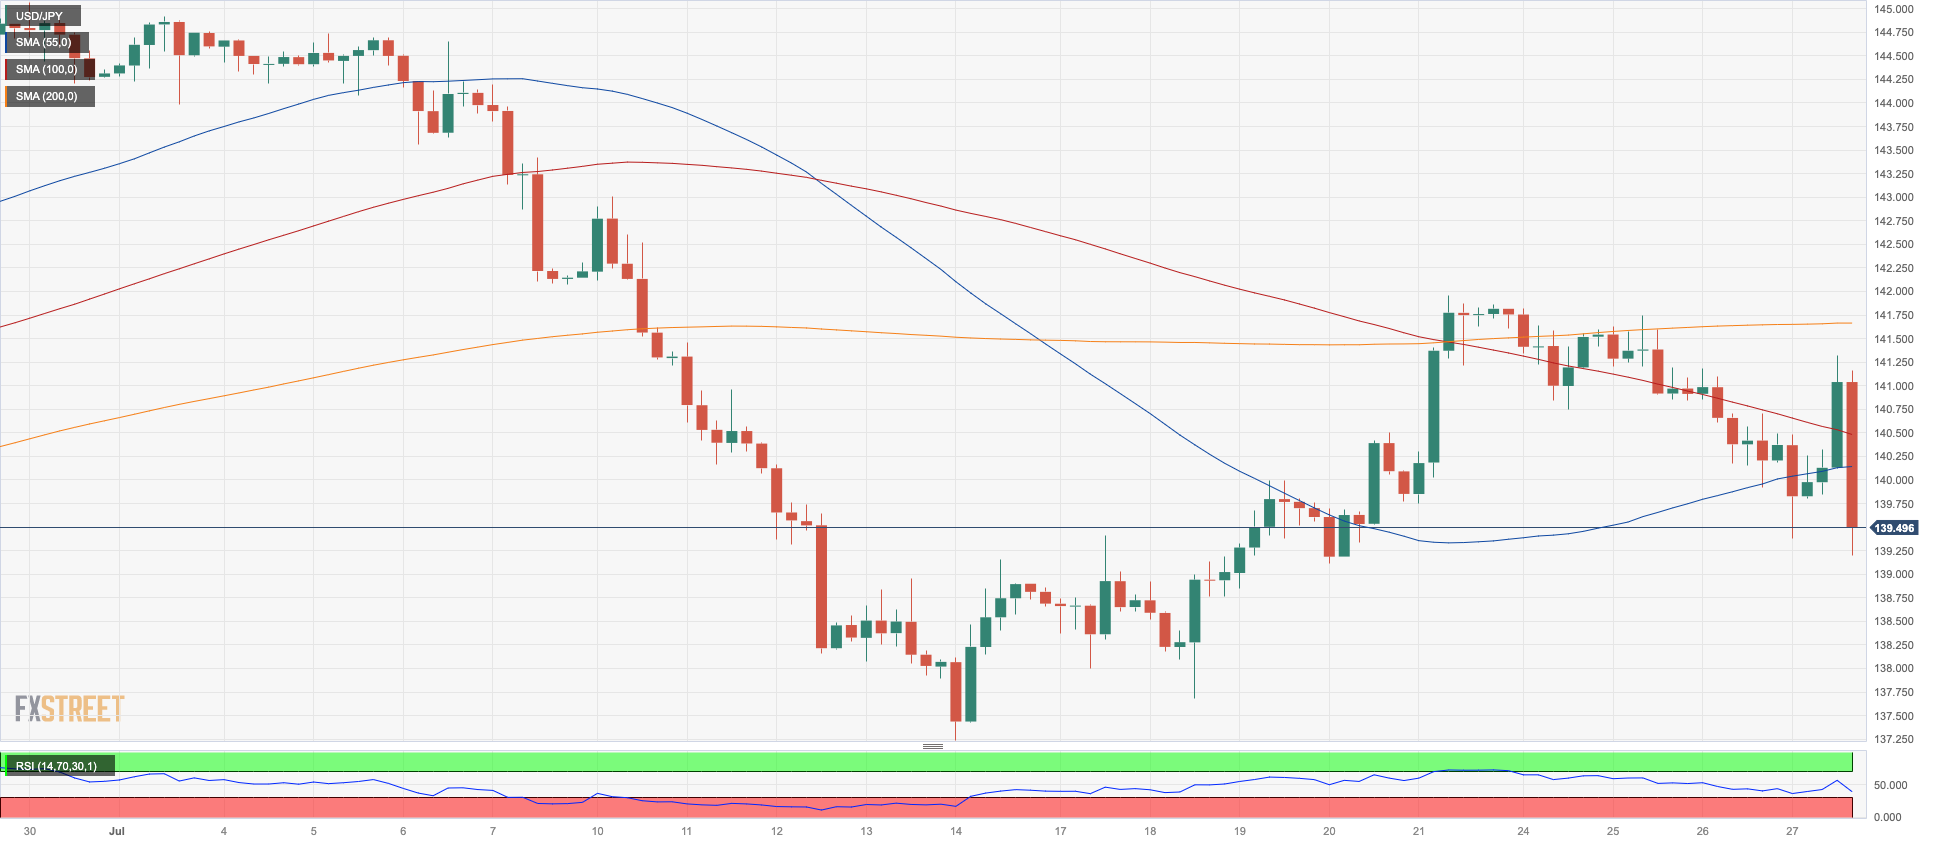
USDJPY
USD/JPY added to the weekly decline and dropped sharply to the sub-140.00 region on Thursday, quickly eroding earlier gains to the area north of 141.00 the figure.
The yen unexpectedly strengthened in response to late news citing the likelihood that the BoJ could discuss a tweak to its Yield Curve Control (YCC) to allow rates to surpass the 0.50% threshold.
Earlier in the session, the JPY depreciated markedly against the dollar amid a broad-based rally in the greenback and a notable rise in U.S. yields, particularly following the ECB meeting where the central bank carried out its widely expected 25 basis point interest rate hike.
Over in Japan, data showed that Foreign Bond Investment contracted by ¥973.8B in the week ending July 22.
Immediately to the upside for USD/JPY comes the weekly high of 141.95 (July 21) seconded by the 2023 top of 145.07 (June 30) and the 2022 peak of 151.94 (October 21). On the downside, the July low of 137.23 (July 14) appears as an immediate contention just above the key 200-day SMA of 136.72. The weekly low of 133.01 (April 26) and a minor support of 132.01 (April 13) are situated before the April low of 130.62 (April 5) and the significant round level of 130.00.The everyday RSI dropped to the 42 region.
Resistance levels: 141.58 141.96 143.00 (4H chart)
Support levels: 139.37 139.10 137.67 (4H chart)
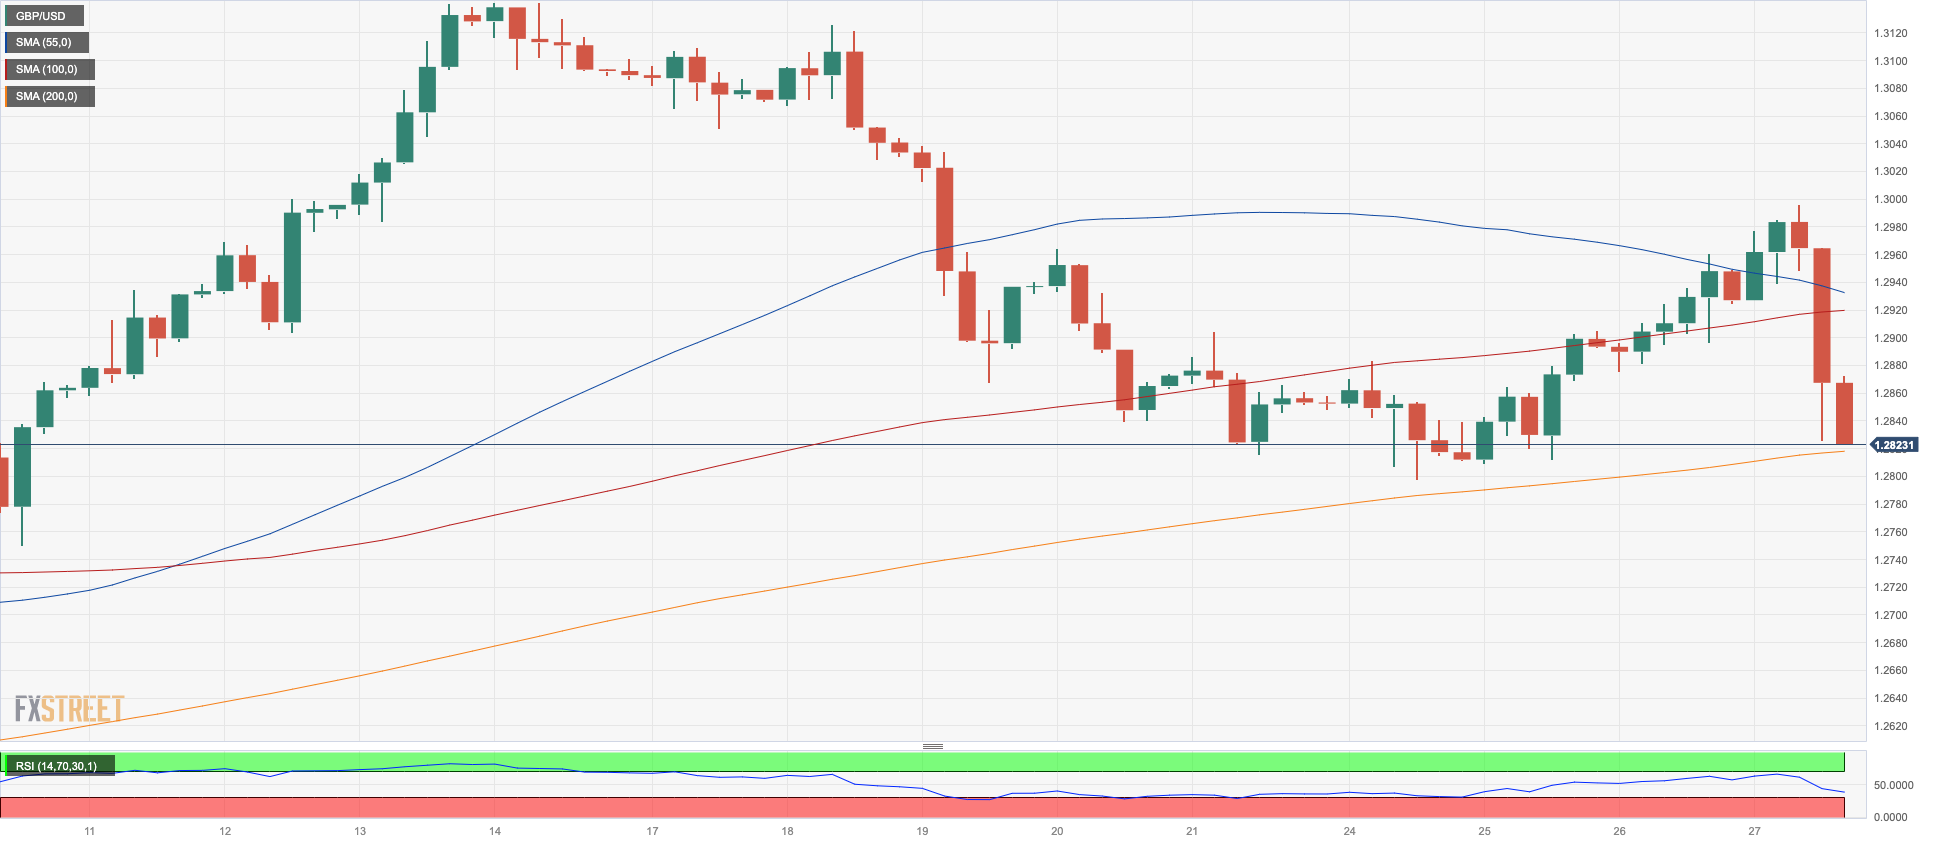
GBPUSD
The renewed strength in the greenback sparked concerns across the risk-linked galaxy, leading to a significant retreat in GBP/USD towards the 1.2820 area on Thursday.
Notably, the British pound lost over a cent shortly after surging close to the critical 1.3000 mark on Thursday. Unfortunately, all those gains were relinquished as the currency continued to slide, eventually reaching the low-1.2800s by the end of the trading session.
Within the UK, Car Production experienced a notable 16.2% growth in the year up to June, while the CBI Distributive Trades index worsened, falling to -25 in July.
Further losses could prompt GBP/USD to revisit the weekly low of 1.2797 (July 24) ahead of the short-term 55-day SMA at 1.2668 and the weekly low of 1.2590 (June 29). The 2021–2023 trend line emerges as the next support near 1.2500 followed by the June low of 1.2368 (June 5), the May low of 1.2308 (May 25) and the critical 200-day SMA of 1.2276. On the flip side, if the 2023 high of 1.3142 (July 14) is cleared, GBP/USD might then attempt to test the weekly peaks at 1.3146 (April 14, 2022) and 1.3298 (March 23, 2022). The daily RSI slipped back to the 50 region.
Resistance levels: 1.2995 1.3125 1.3142 (4H chart)
Support levels: 1.2797 1.2750 1.2591 (4H chart)
AUDUSD
The persistent strength of the US dollar had a negative impact on high-beta currencies, resulting in AUD/USD retreating for a second consecutive session on Thursday.
The Aussie dollar fell back to the 0.6720 range, which aligns with the important 200-day SMA, where it found some decent support.
Furthermore, the overall pessimistic market sentiment towards commodities added to the selling pressure on the pair.
On the economic front, data from Australia showed that Export Prices declined by 8.5% QoQ in Q2, while Import Prices dropped by 0.8% QoQ.
AUD/USD remains under pressure and extra losses should meet initial support at the weekly low of 0.6714 (July 24) ahead of another weekly low of 0.6595 (June 29), all prior to the 2023 low of 0.6458 (May 31). Down from here aligns the November 2022 low of 0.6272 (November 3) before the 2022 low of 0.6169 (October 13). On the other hand, the July high of 0.6894 (July 13) and the June top of 0.6899 (June 16) emerge as the initial up-barriers. A break of this region would pave the way for a trip to the important 0.7000 level before the weekly top of 0.7029 (February 14) and the 2023 peak of 0.7157 (February 2). The day-to-day RSI eased to the 50 zone.
Resistance levels: 0.6821 0.6846 0.6894 (4H chart)
Support levels: 0.6714 0.6650 0.6599 (4H chart)

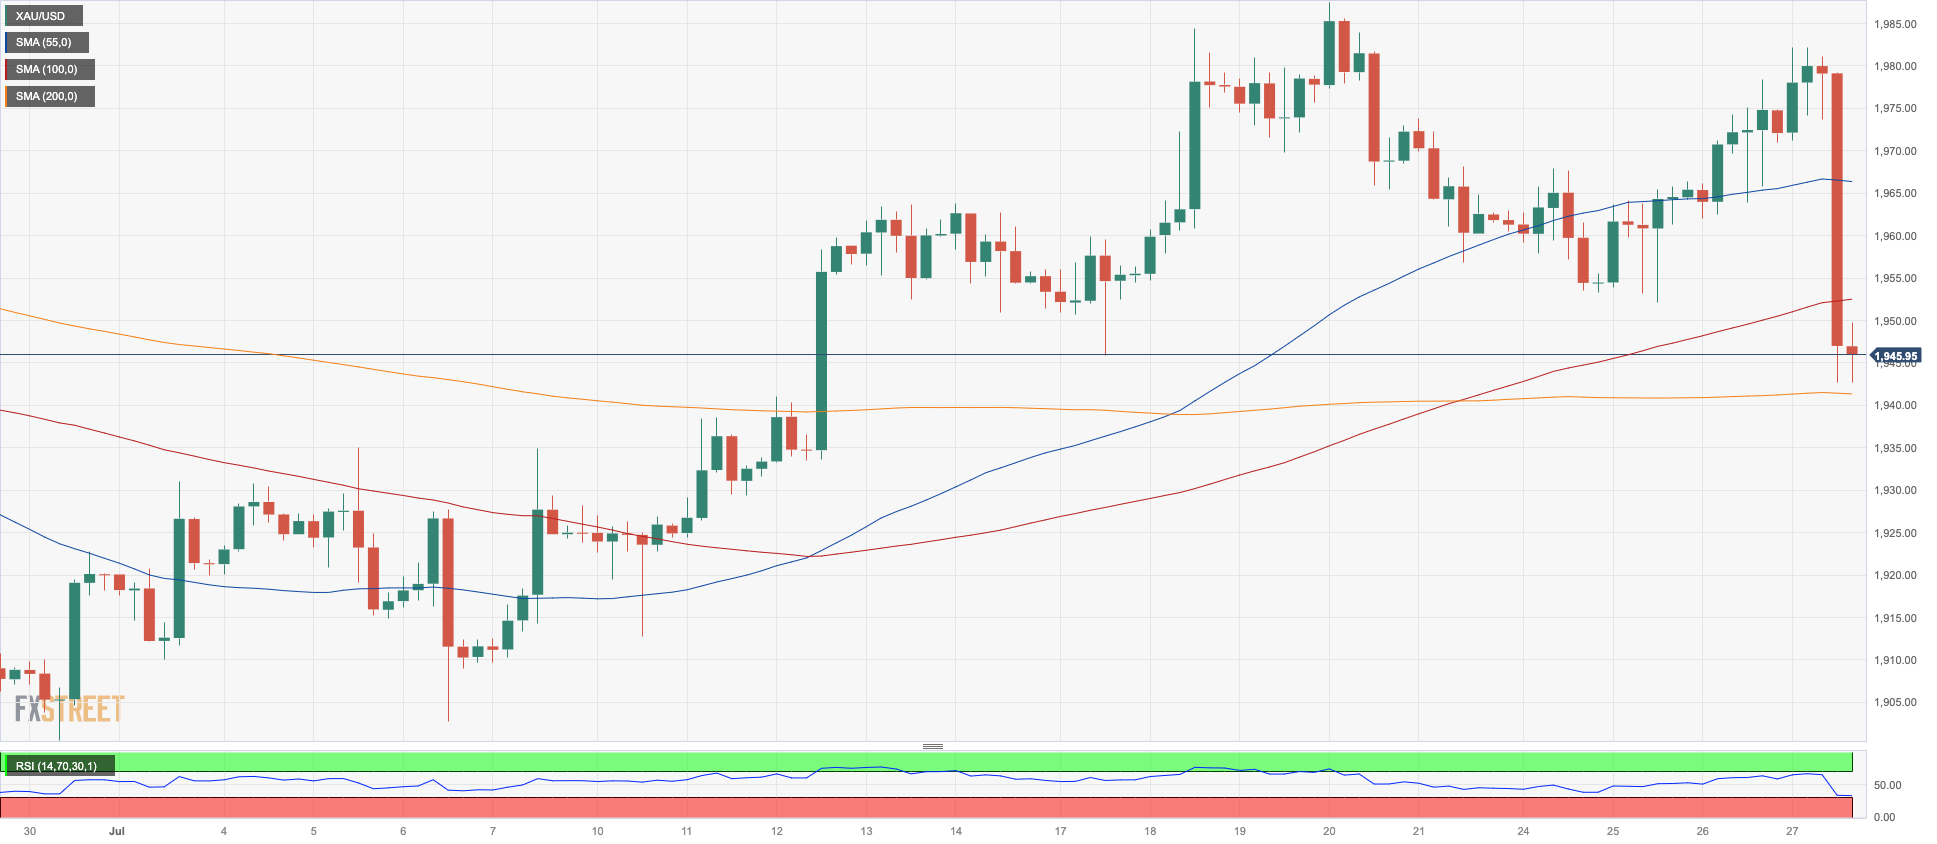
GOLD
The robust upward momentum of the US dollar negatively impacted the sentiment surrounding gold, causing prices to drop to new two-week lows near $1940 per troy ounce on Thursday.
Additionally, the significant increase in US yields across the curve contributed to the decline in gold prices, reversing the previous two days of gains.
The loss of the weekly low of $1942 (July 27) could put the $1900 round level to the test ahead of the June low of $1893 (June 29). South from here comes the significant 200-day SMA at $1884 before the 2023 low of $1804 (February 28) and the vital $1800 region. Having said that, bulls are expected to meet the initial hurdle at the July high of $1987 (July 20). The surpass of the latter exposes a move to the crucial $2000 level seconded by the 2023 top of $2067 (May 4) the 2022 high of $2070 (March 8) and the all-time peak of $2075 ( August 7 2020),
Resistance levels: $1987 $2022 $2048 (4H chart)
Support levels: $1942 $1912 $1893 (4H chart)
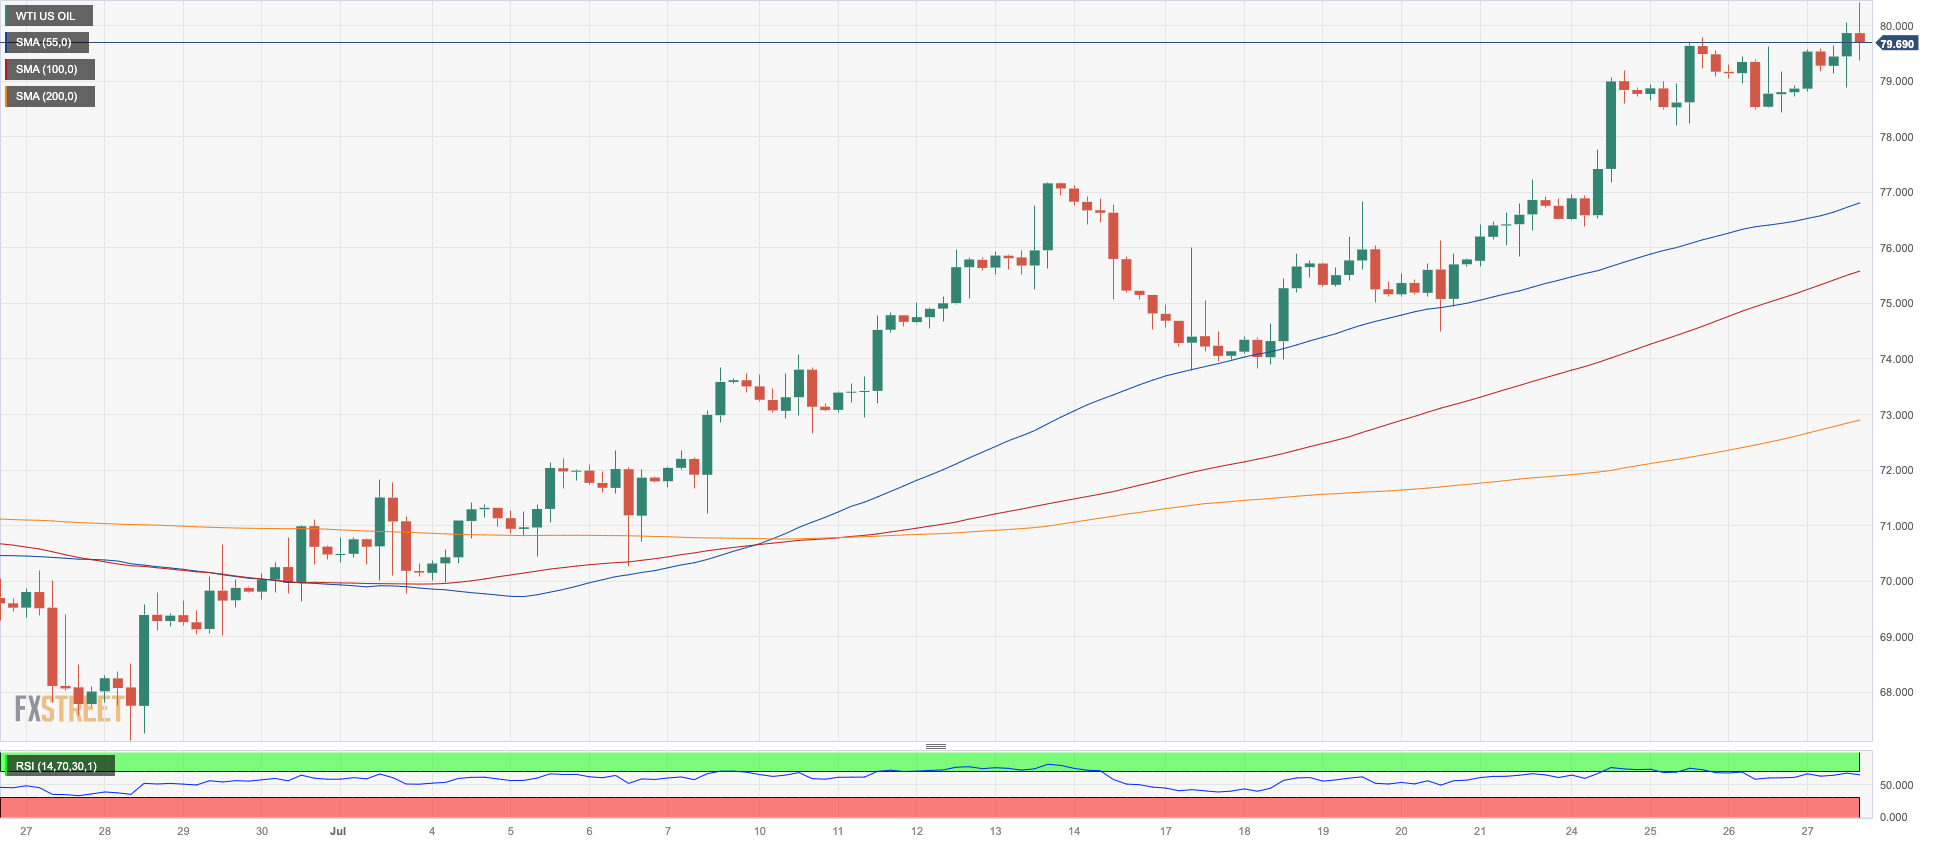
CRUDE WTI
WTI prices finally exceeded the crucial threshold of $80.00 per barrel on Thursday, marking a significant milestone.
The ongoing rally, which has persisted for several weeks, was once again reinforced by the narrative of limited oil supply and optimistic expectations of an economic recovery in China during the latter half of the year. Additionally, the OPEC+ decision to reduce oil output further buoyed market sentiment.
Contributing to the positive sentiment surrounding the commodity were the better-than-anticipated US Q2 GDP figures and traders' growing belief that both the Federal Reserve and the European Central Bank might soon conclude their interest rate hiking cycles.
If WTI prices leave behind the July high of $80.57 (July 27), they could then challenge the 2023 top of $83.49 (April 12) seconded by the 2022 peak of $93.73 (November 7). On the downside, the key 200-day SMA at $76.66 should hold the initial test followed by the weekly low of $73.89 (July 17) and the transitory 100-day and 55-day SMAs of $73.52 and $72.33, respectively. The breakdown of this region exposes the June low of $66.86 (June 13) and the 2023 low of $63.61 (May 4). Further down sits the December 2021 low of $62.46 (December 2) ahead of the key $60.00 per barrel.
Resistance levels: $80.57 $83.08 $83.49 (4H chart)
Support levels: $78.25 $74.47 $73.81 (4H chart)
GER40
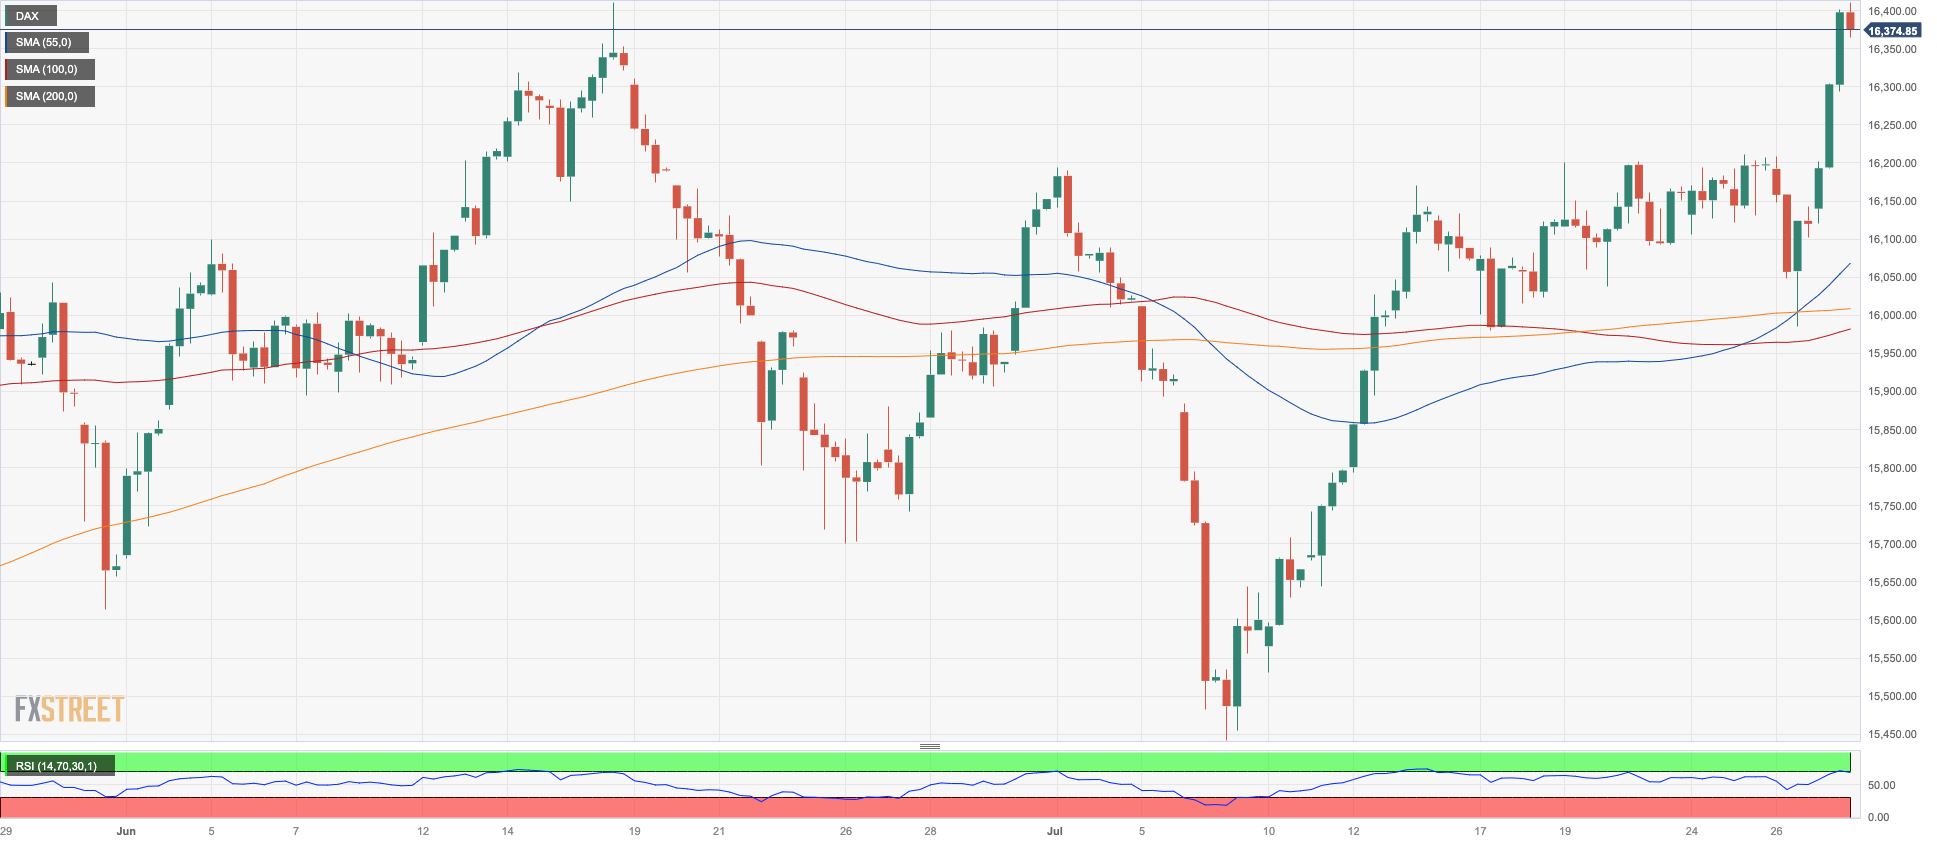
On Thursday, European stocks experienced a significant increase, building on the week's recovery. The German DAX40, in particular, reached levels just below its all-time high, surpassing the 16400 mark.
Market participants' optimism was fueled by the belief that both the European Central Bank (ECB) and the Federal Reserve are close to concluding their monetary policy normalization.
This perception was reinforced by the ECB's dovish tone during its event earlier in the day, despite a 25 bps rate hike, which was largely anticipated.
In addition, Germany's 10-year bund yields rose to weekly highs, nearing the 2.50% mark.
Further up for the DAX40 comes the record high of 16427 set on June 16. The intermediate 55-day and 100-day SMAs, which are around 16019 and 15808, respectively, look to represent the first barrier as bears approach the July low of 15456 (July 7). A deeper drop could retest the 200-day SMA at 15140 before the March low of 14458 (March 20) and the December 2022 low of 13791 (December 20). The daily RSI jumped to the boundaries of 64.
Best Performers: Infineon, Heidelbergcement, Sartorius AG VZO
Worst Performers: Deutsche Bank AG, Volkswagen VZO, RWE AG ST
Resistance levels: 16408 16427 17000? (4H chart)
Support levels: 16000 15989 15456 (4H chart)
NASDAQ
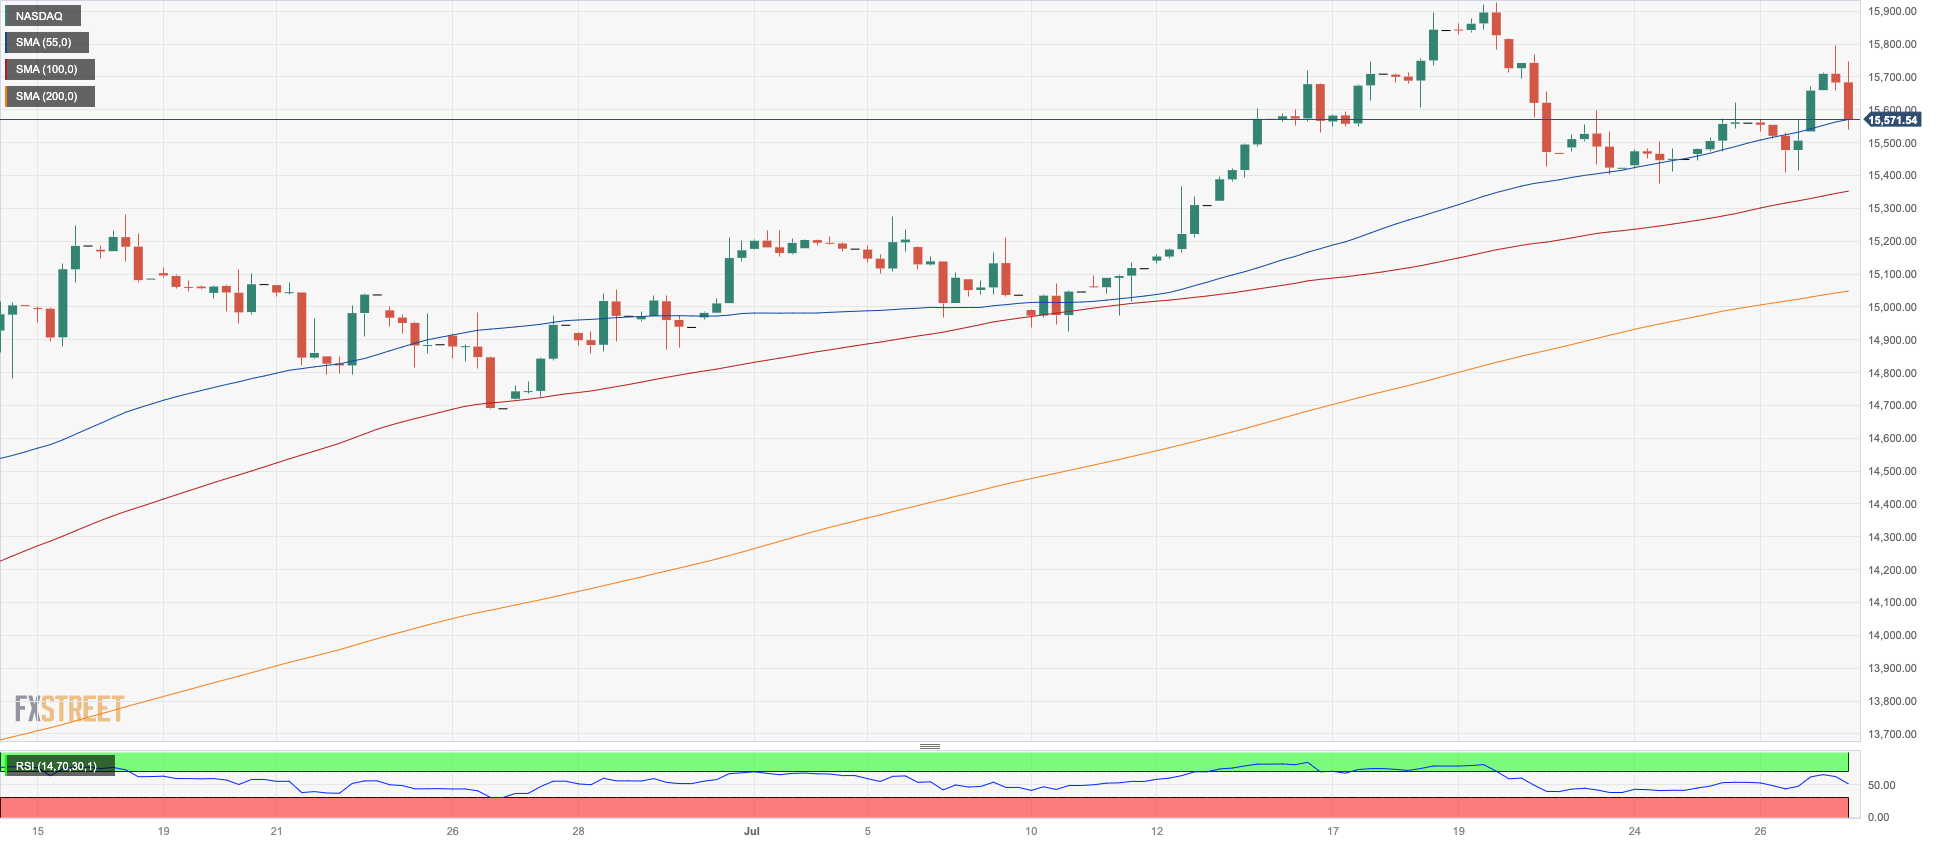
Technology stocks represented by the Nasdaq 100 experienced a renewed surge and climbed to reach new weekly highs, approaching the 15800 level, on Thursday.
The rise in tech stocks was notably influenced by encouraging earnings reports from Meta Platforms and Alphabet, which added momentum to the sector.
Furthermore, investors' growing belief that the Federal Reserve might be approaching the end of its interest rate hiking cycle also contributed to the positive sentiment surrounding tech equities.
The Nasdaq 100 faces an immediate uphill challenge at its 2023 high of 15932 (July 19), well shy of the round 16000 mark. By contrast, initial support comes at the weekly low of 15374 (July 24) seconded by the July low of 14924 (July 10). Down from here aligns another weekly lows at 14687 (June 26) and 14283 (June 7). The breach of this level could pave the way for a drop to the weekly low of 13520 (May 24) and the May low of 12938 (May 4) ahead of the April low of 12724, which looks reinforced by the 200-day SMA (12714). A deeper drop could see the March low of 11695 (March 13) revisited. The daily RSI improved to the 63 area.
Top Gainers: Align, Lam Research, Applied Materials
Top Losers: eBay, Honeywell, CoStar
Resistance levels: 15795 15932 16017 (4H chart)
Support levels: 15374 14924 14687 (4H chart)
DOW JONES
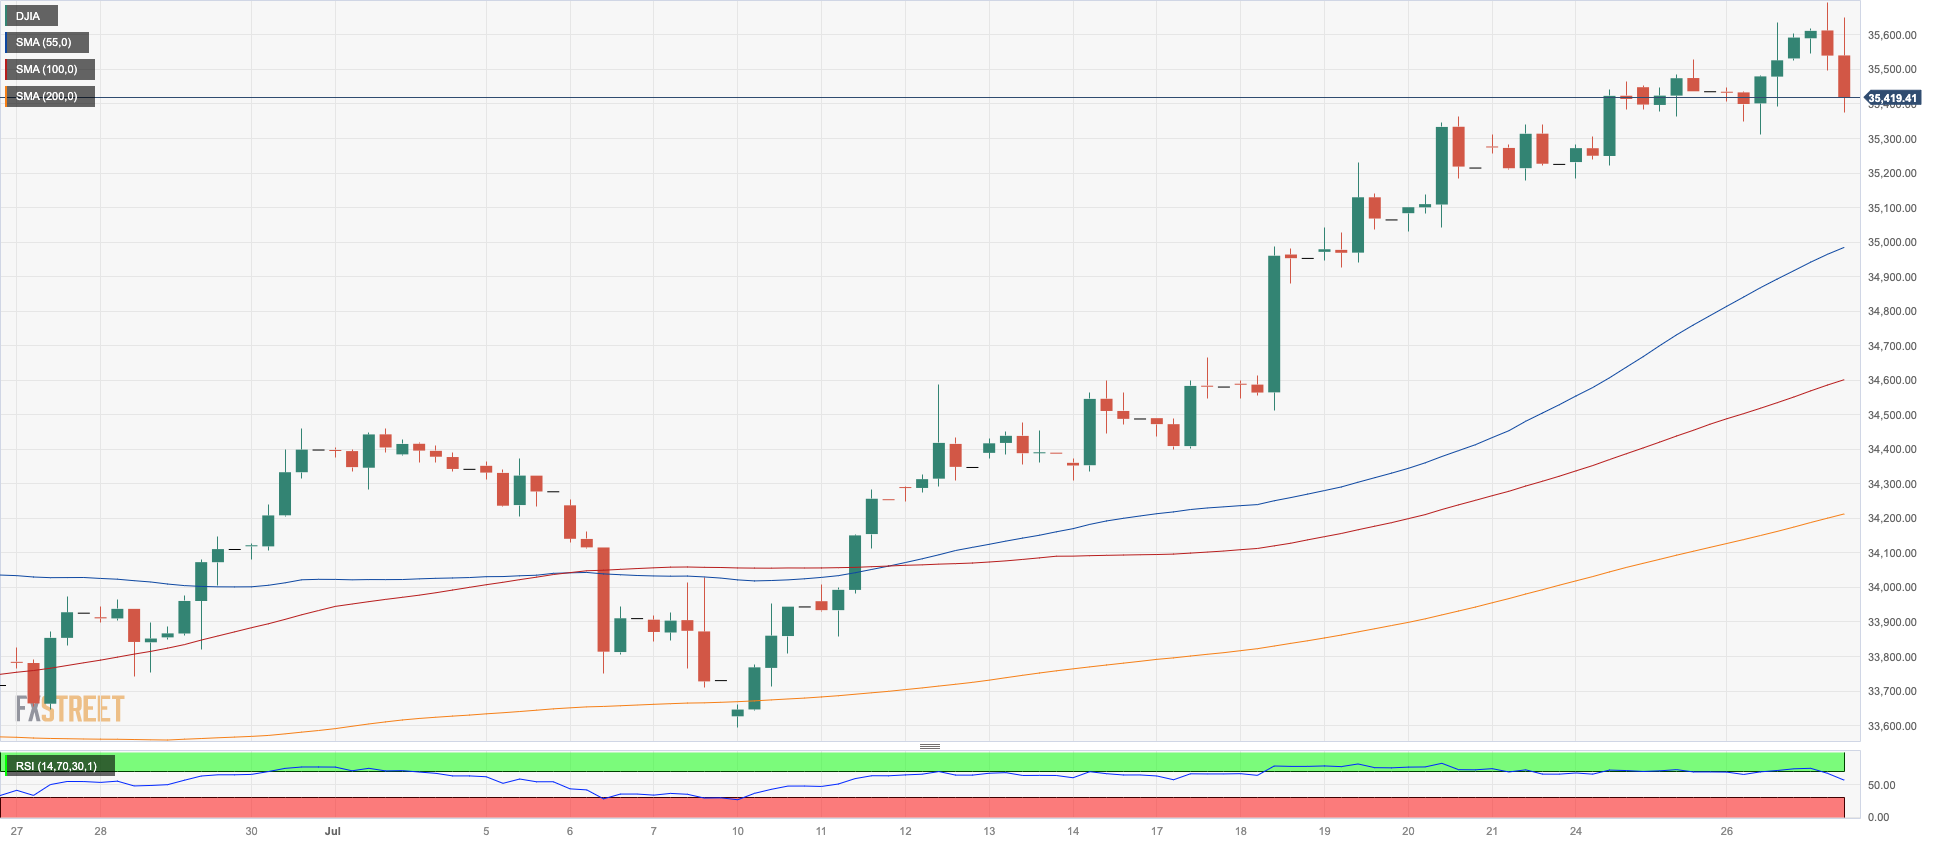
The US stock market, as measured by the Dow Jones, experienced a volatile trading session that ended inconclusively, following a climb to new highs near 35650 earlier on Thursday.
However, the positive sentiment surrounding the US markets remained intact due to a combination of factors. Firstly, investors expect that the Federal Reserve's recent interest rate hike, which took place on Wednesday, will be the last one in its current tightening campaign. Secondly, the US economy's second-quarter GDP data was strong, and it appears that the country has avoided a recession. These factors helped to maintain a positive outlook for US markets.
Overall, the Dow Jones dropped 0.07% to 35490, the S&P500 gained 0.16% to 4573, and the tech-benchmark Nasdaq Composite advanced 0.48% to 14196.
The Dow Jones faces the next hurdle at the 2023 high of 35645 (July 27). Once cleared, the index could confront the February 2022 peak of 35824 (February 9) before testing the all-time top of 36952 (January 5 2022). On the other side, early support is predicted to emerge from the intermediate 55-day SMA at 33966 and the weekly low of 33610 (June 26), which appears reinforced by the temporary 100-day SMA at 33586. Down from here comes the 200-day SMA at 33338 prior to the May low of 32586 (May 25) and the 2023 low of 31429 (March 15). The daily RSI eased a tad below 74, still indicating that the market is still severely overbought.
Top Performers: McDonald’s, Dow, Boeing
Worst Performers: Honeywell, Verizon, Microsoft
Resistance levels: 35645 35824 36513 (4H chart)
Support levels: 34468 33705 33581 (4H chart)
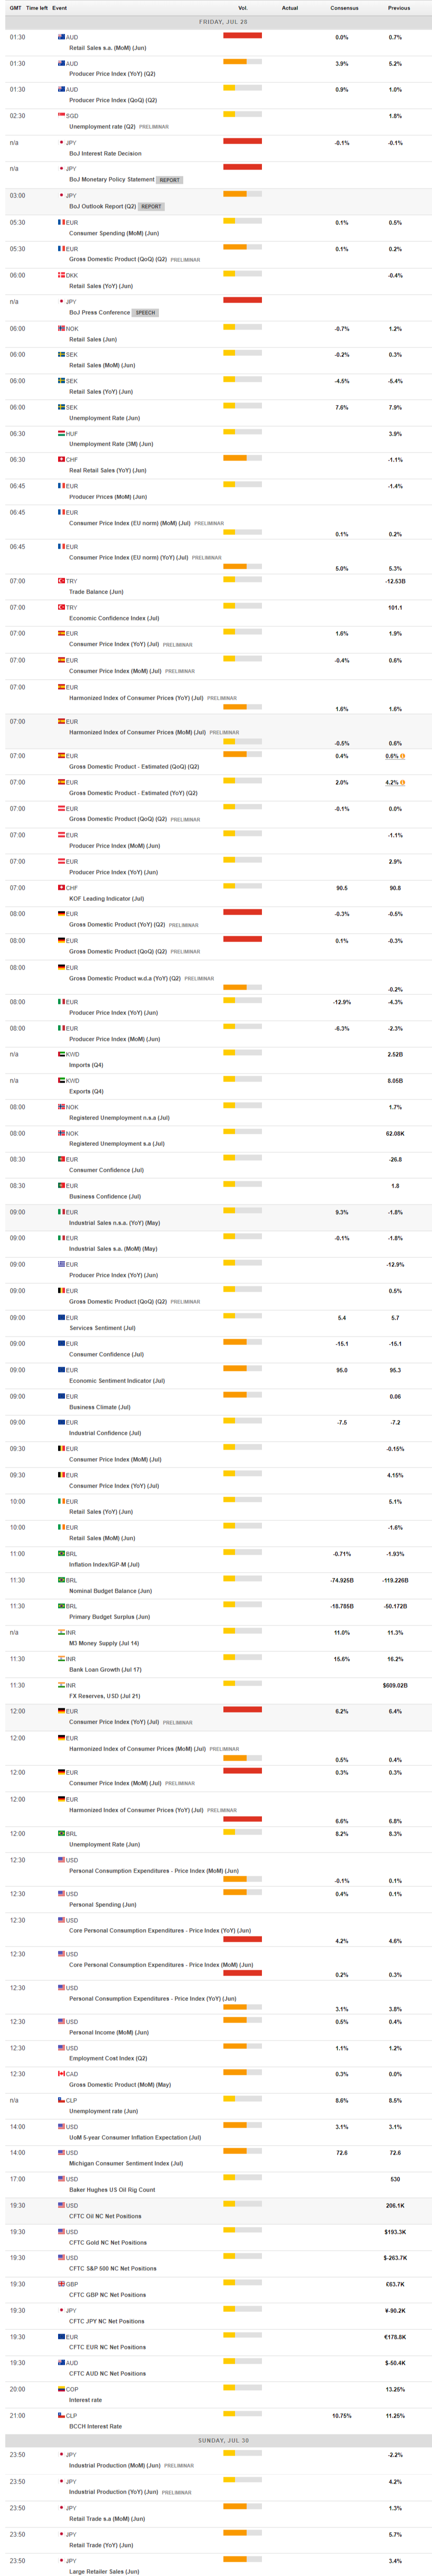
MACROECONOMIC EVENTS
All Information & Updates provided by:

All information relating to the financial markets available on this page has been prepared and issued by FXStreet (Forexstreet SL, Spain, Reg: B62498233) on the basis of publicly available information and all information believed to be reliable and does not conflict with Kuwaiti local laws, and all necessary care has been taken to before the company to ensure that the facts mentioned are correct from the source.
NCM Investment nor any of its directors or employees shall in any way be held responsible for the contents of this news, and the information contained on this page is intended only to provide clients with publicly available information and should not be construed as investment advice, report or analysis and/or constitute an offer or invitation to buy or sell financial instruments of any kind.
RISK WARNING: Forex and CFDs are highly risky leveraged products, as losses can exceed deposits. Please ensure you understand all the risks and take independent advice if necessary. NCM will segregate the clients based on the criteria of the regulator and its bylaws. NCM does not provide any advisory service; the material published does not constitute advice or a recommendation for a transaction in any financial instrument. NCM accepts no responsibility for any use of the content presented and any consequences of that use. Anyone acting on the information provided does so at their own risk.