
- Contact Us:
-

-

-

-


Daily Market Updates
31 Jul 2023
USDJPY
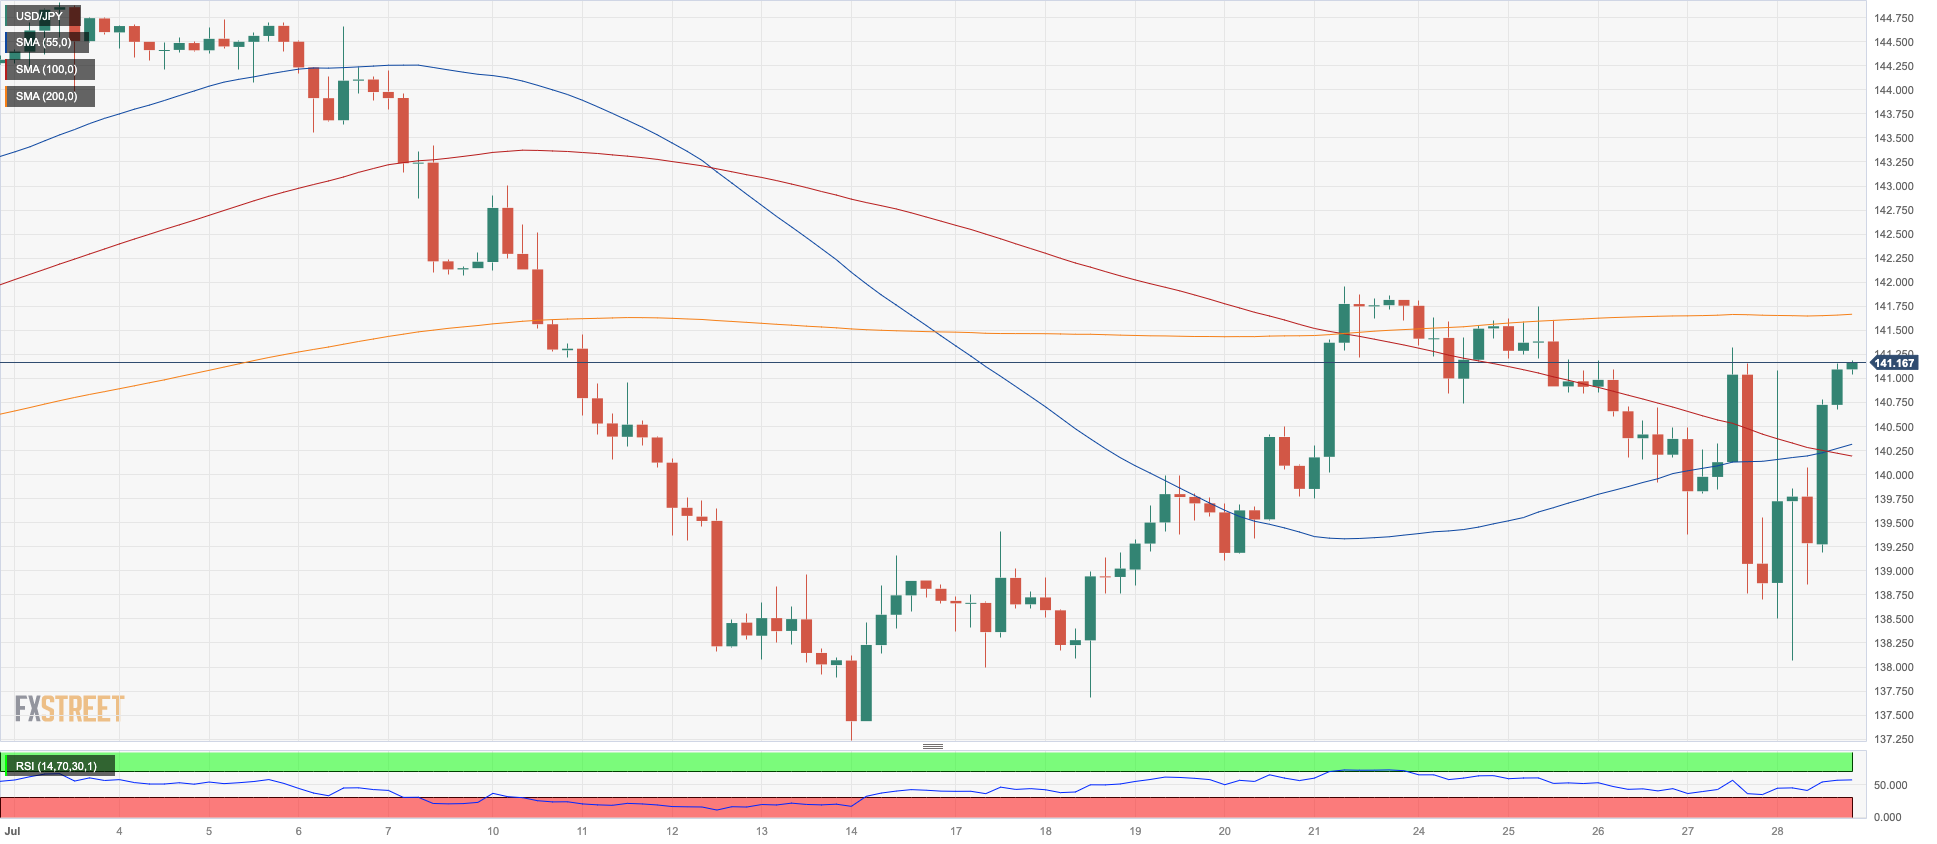
Following the initial BoJ-led pullback to multi-day lows within the boundaries of the 138.00 support, USD/JPY managed to gather upside traction and end Friday’s session with marked gains beyond the 141.00 yardstick.
The pair’s daily reversal came on the back of the strong rebound in sentiment surrounding the risk complex, which was in turn underpinned by the renewed offered stance in the greenback.
In the meantime, declining US yields seem to have limited the downside potential in spot for the time being.
In the Japanese money market, the key JGB 10-year yields surged to new tops near 0.60% following the BoJ monetary policy meeting. On this, the BoJ caused a stir by adjusting its Yield Curve Control (YCC) framework in an unexpected move. The BoJ has decided to introduce more flexibility in relation to its 10-year JGB target of 0% +/- 50 bp. This means that the band will no longer be inflexible, and the BoJ has allowed 10-year JGBs to trade up to 1% for the time being. This is being viewed as a step towards an eventual exit from YCC. Despite this move, the BoJ is still cautious about the inflation outlook and is maintaining its stance that it will not hesitate to implement further easing measures if necessary.
Immediately on the upside of USD/JPY is the weekly high of 141.95 (July 21), followed by the 2023 top of 145.07 (June 30) and the 2022 peak of 151.94 (October 21). On the downside, immediate contention emerges at the weekly low of 138.05 (July 28) prior to the July low of 137.23 (14 July) and the important 200-day SMA of 136.67.The weekly low of 133.01 (April 26) and minor support of 132.01 (April 13) are ahead of the April low of 130.62 (5 April) and the important round mark of 130.00.The daily RSI leapt north of the 48 mark.
Resistance levels: 141.31 141.96 143.00 (4H chart)
Support levels: 138.05 137.67 137.23 (4H chart)
GBPUSD
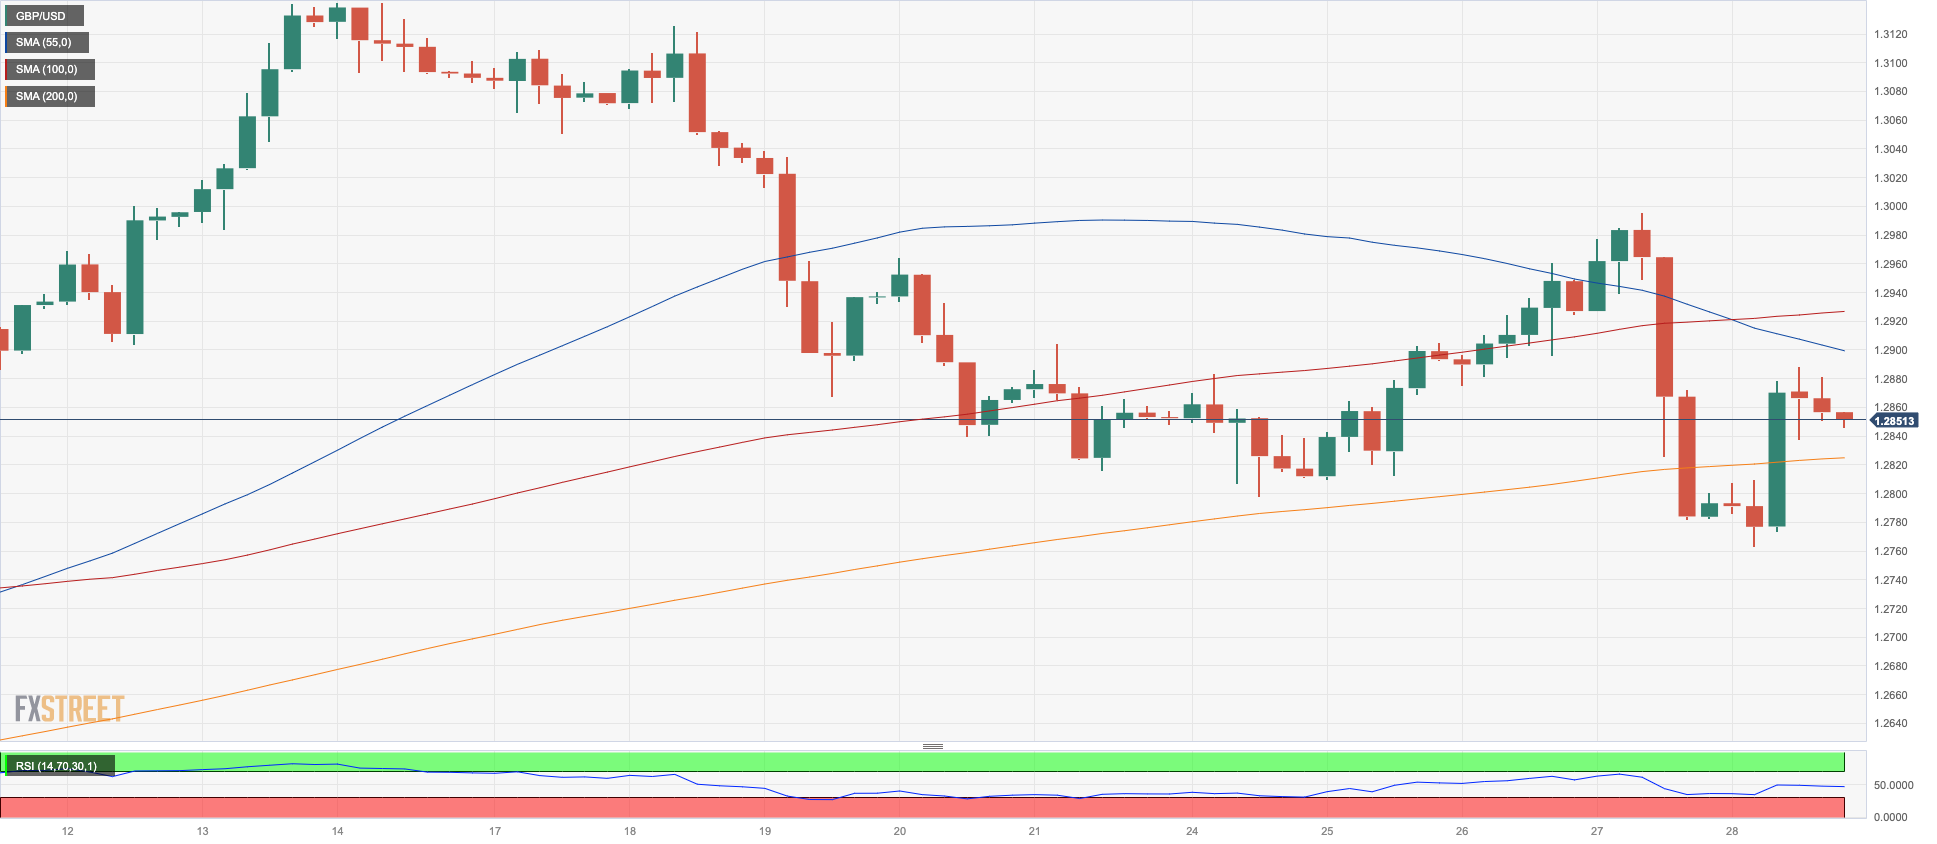
Friday’s correction in the greenback allowed GBP/USD to regain its composure after a significant pullback on Thursday. As a result, the pair ended the session comfortably above the 1.2800 level with slight gains on the weekly chart.
Notably, the British pound followed suit with other risky currencies and managed to reverse its earlier decline, which had taken it to a 2-week low around 1.2760. This turnaround was triggered by the loss of momentum in the greenback, causing the USD Index (DXY) to surrender its gains and retreat from the multi-day peaks just above the 102.00 mark, an area also coincident with the 100-week SMA.
There were no data releases across the Channel at the end of the week.
The weekly low of 1.2762 (July 28) seconded by the short-term 55-day SMA at 1.2675 and the weekly low of 1.2590 (June 29) may be revisited by GBP/USD if losses gather steam. Down from here comes the 1.2500 region, where the 2021-2023 trend line sits, before the June low of 1.2368 (June 5), the May low of 1.2308 (May 25) and the key 200-day SMA at 1.2284. On the other hand, there is an immediate hurdle at the weekly high of 1.2995 (July 27) ahead of the 2023 top of 1.3142 (July 14). Once cleared, Cable may next try to challenge the weekly peaks at 1.3146 (April 14, 2022) and 1.3298 (March 23, 2022). The daily RSI ticked higher near 51.
Resistance levels: 1.2995 1.3125 1.3142 (4H chart)
Support levels: 1.2762 1.2750 1.2591 (4H chart)
AUDUSD
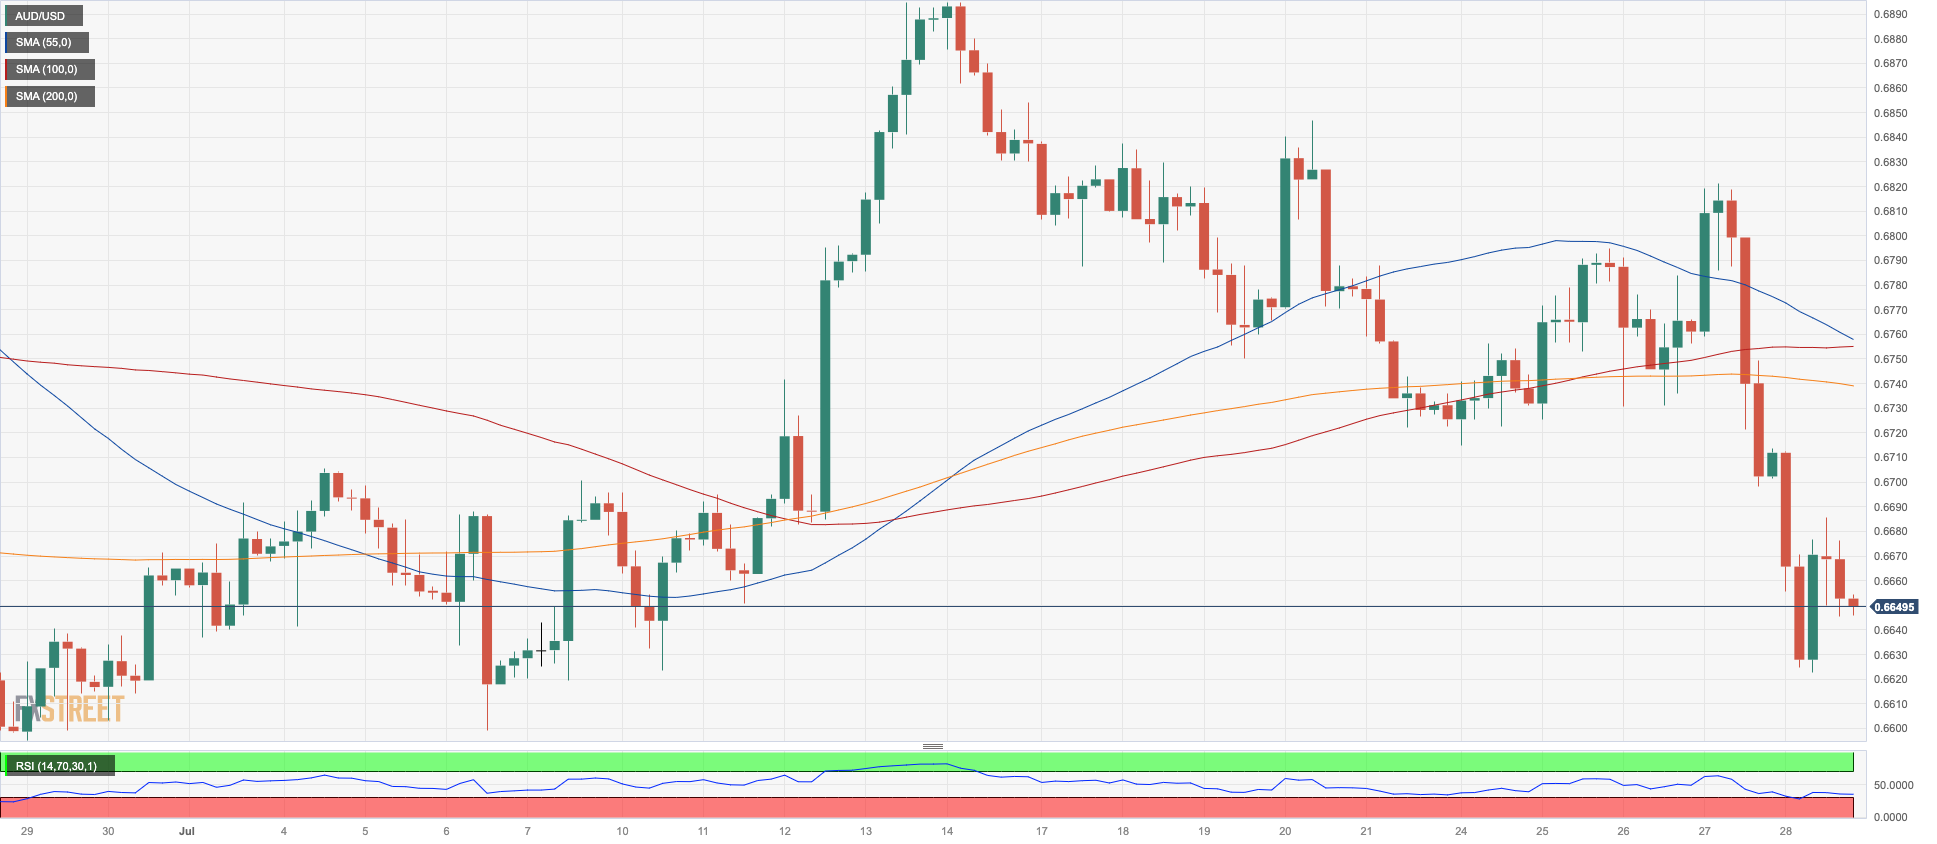
The Australian dollar faced increased weakness on Friday, causing AUD/USD to retreat and reach levels not seen in two weeks, hovering near 0.6620. At the same time, the pair broke below the significant 200-day SMA at 0.6725, which does not bode well when it comes to gauging potential rebounds.
Despite the pair managing to rebound from that level, the overall sentiment remained negative, leading to the third consecutive session of losses for AUD/USD and the second consecutive week in negative territory.
Interestingly, this decline in the pair happened despite a broader recovery in the commodity market, where copper prices and iron ore saw modest gains.
In Australia, preliminary figures indicate that Retail Sales likely contracted by 0.8% in June compared to the previous month.
Additional losses in AUD/USD could find first support around the weekly low of 0.6622 (July 28), followed by another weekly low of 0.6595 (June 29), all before the 2023 low of 0.6458 (May 31). From here, the November 2022 low of 0.6272 (November 3) will come before the 2022 low of 0.6179 (October 13). On the upside, the initial up-barriers appear to be the July high of 0.6894 (July 13) closely followed by the June peak of 0.6899 (June 16). Breaking through this area would open the door for a move to the crucial 0.7000 level prior to the weekly high of 0.7029 (February 14) and the 2023 peak of 0.7157 (February 2). The daily RSI dipped below the 42 level.
Resistance levels: 0.6740 0.6821 0.6846 (4H chart)
Support levels: 0.6622 0.6599 0.6579 (4H chart)
GOLD
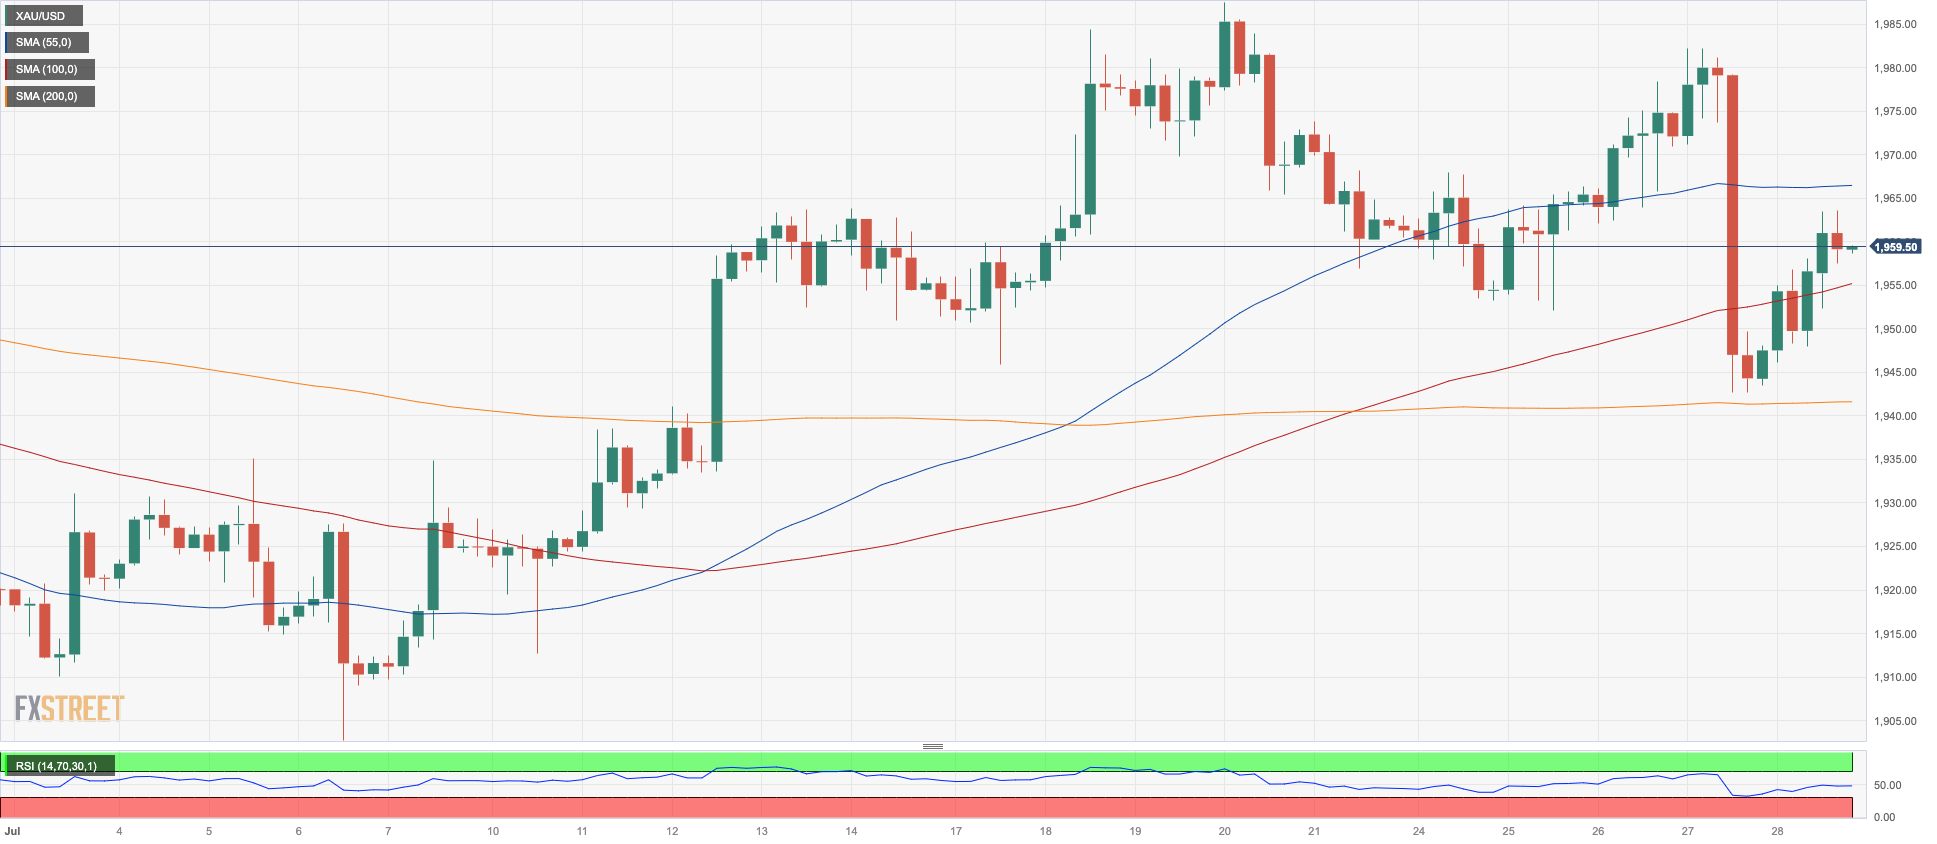
Gold recovered some poise and partially erased Thursday’s sharp pullback at the end of the week.
Indeed, the daily pullback in the greenback in tandem with easing US yields underpinned the precious metal and bolstered its firmer tone on Friday, all against a backdrop where the risk-on sentiment prevailed among investors in the wake of the FOMC and ECB interest rate decisions.
If the weekly low of $1942 (July 27) is breached, it may lead to a test of the round level of $1900 before reaching the June low of $1893 (June 29). Further downward movement would encounter a significant obstacle at the 200-day SMA at $1885, followed by the 2023 low of $1804 (February 28) and the crucial support region around $1800. On the contrary, if the bulls take control, they are likely to face their first challenge at the July high of $1987 (July 20). A breakthrough above this level could pave the way for a move towards the crucial level of $2000, and beyond that, it may expose the path to the 2023 top of $2067 (May 4), the 2022 high of $2070 (March 8), and ultimately the all-time peak of $2075 (August 7, 2020).
Resistance levels: $1987 $2022 $2048 (4H chart)
Support levels: $1942 $1912 $1893 (4H chart)
CRUDE WTI
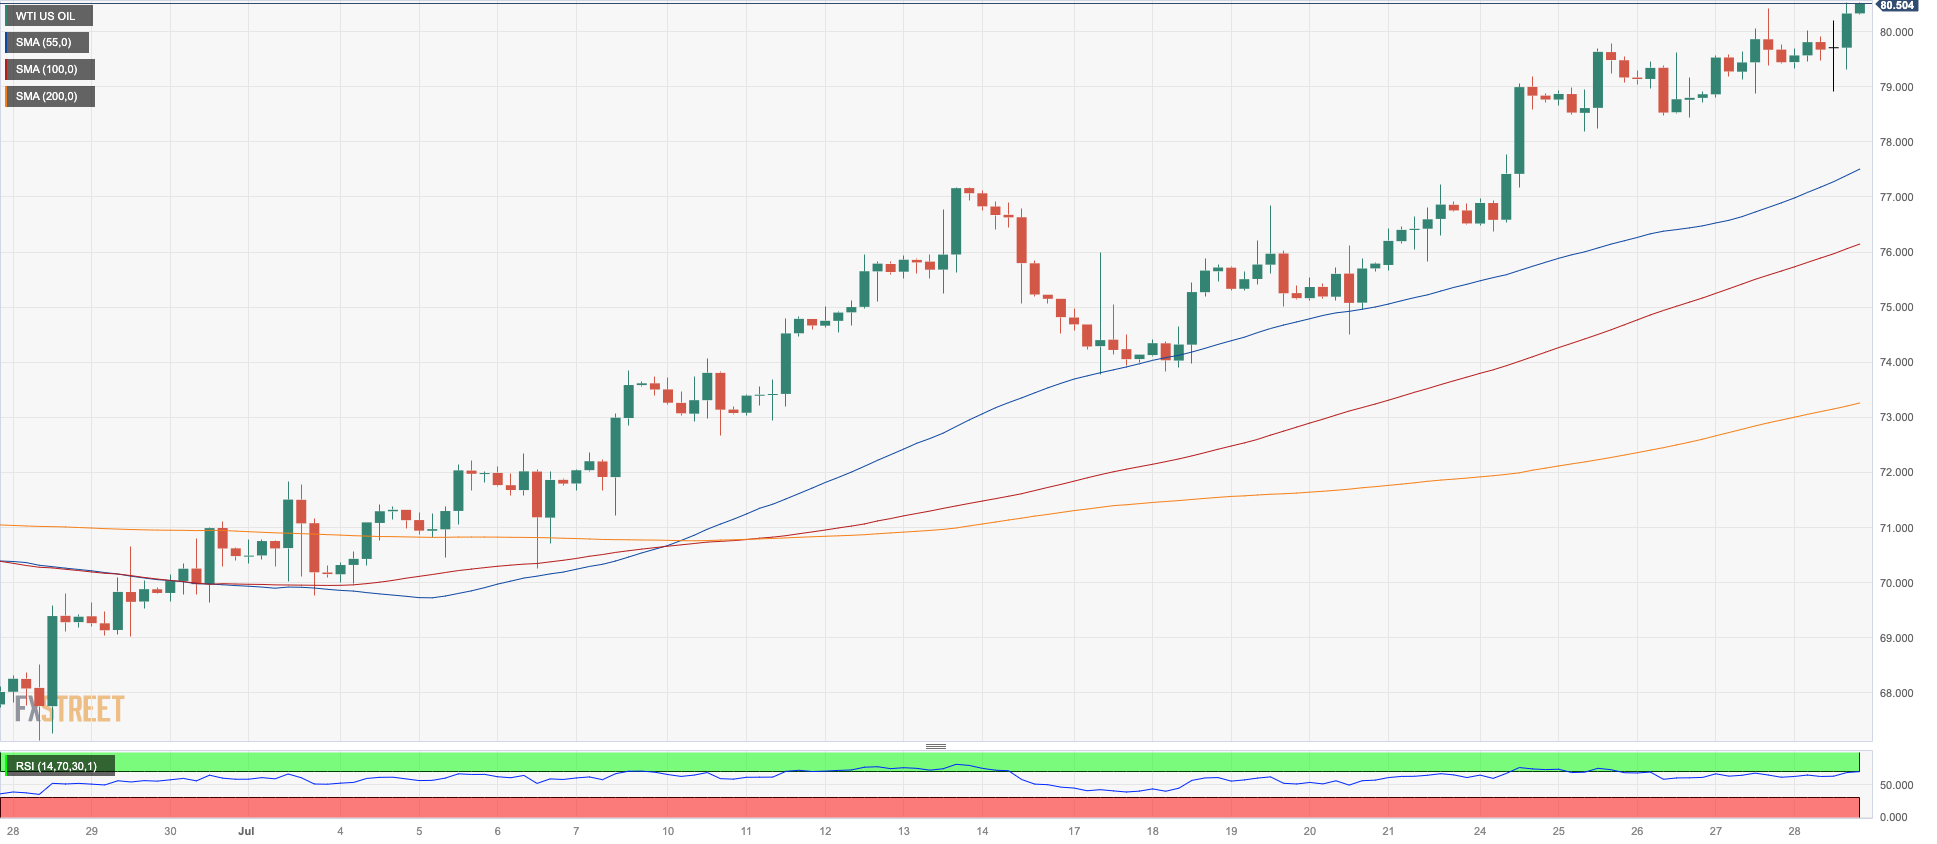
At the end of the week, WTI prices added to Thursday’s advance and finally managed to close above the key $80.00 mark per barrel while maintaining a positive trend for the fifth consecutive week.
The recent strength in crude oil prices can be attributed to several factors. Firstly, the oil market remains tight due to ongoing oil output cuts by OPEC+ countries. Additionally, there are rising hopes for a stronger economic recovery in China during the second half of 2023. Furthermore, the market sentiment is influenced by the belief that both the Fed and the ECB are nearing the end of their tightening monetary policies.
On the economic front, driller Baker Hughes reported that the total number of active oil rigs in the US shrank by 1 to reach 529 in the week leading up to July 28th.
If WTI prices rise above the July high of $80.66 (July 28), they could then target the 2023 peak of $83.49 and the 2022 high of $93.73. Just the opposite, support could initially come around the 200-day SMA at $76.63, followed by the weekly low of $73.89 and the 100-day and 55-day SMAs at $73.55 and $72.51, respectively. If WTI breaks below that area, the June low of $66.86 and the 2023 bottom at $63.61 could come into play. Below that, the December 2021 trough of $62.46 may provide support prior to the key round level of $60.
Resistance levels: $80.66 $83.08 $83.49 (4H chart)
Support levels: $78.25 $74.47 $73.06 (4H chart)
GER40
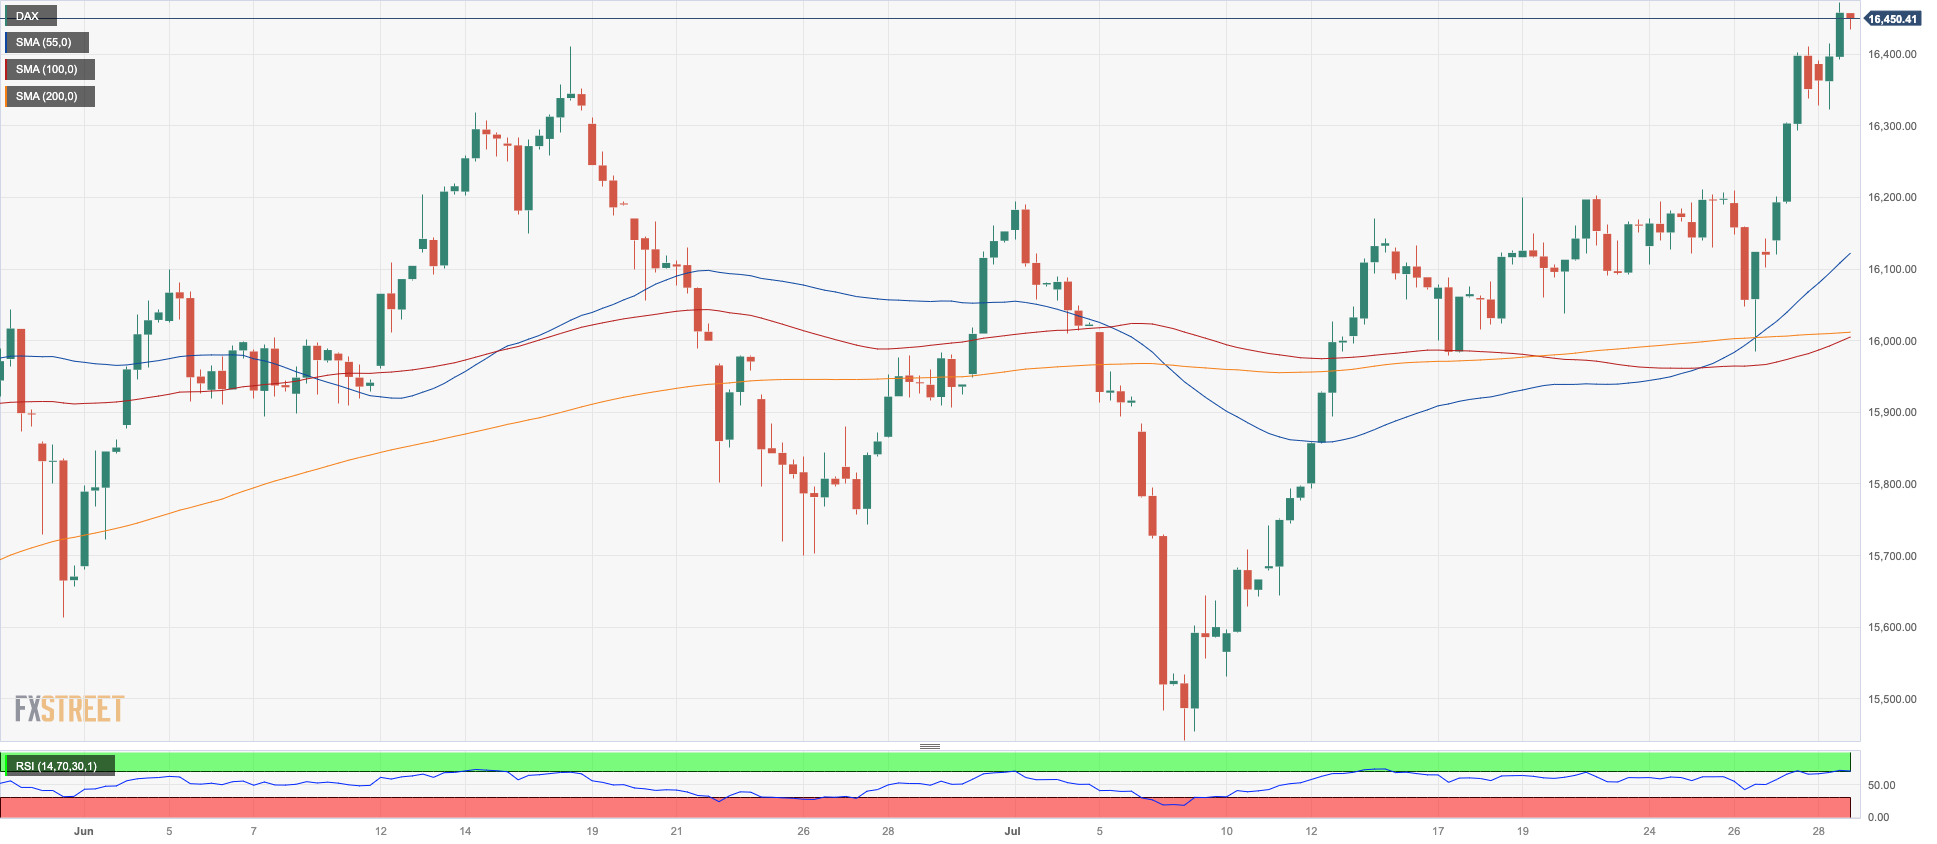
The European stock market experienced a mixed tone at the end of the trading week. However, the German benchmark DAX40 stood out by reaching a new all-time high at 16490.
This could be attributed to the possibility that the European Central Bank may have completed its hiking cycle, as suggested by comments made by rate setters on Thursday's ECB event and Friday's remarks. Additionally, there may be some disinflationary pressures in the German economy, which could have contributed to the upbeat mood among investors.
Furthermore, despite poor prints from the advanced GDP figures during the April-June period that showed a contraction of 0.2% over the last twelve months, the DAX40 proved to be resilient.
On the other hand, while the reference index experienced a daily uptick, the 10-year bund yields saw two consecutive daily advances before retreating to around 2.40%.
The record high of 16490 set on July 28 is the next resistance for the DAX40. The intermediate 55-day SMA at 16030 and the weekly low of 16000 (July 26) emerge as the next stops on the downside prior to the interim 100-day SMA at 15817. South from here comes the July low of 15456 (July 7) before the key 200-day SMA at 15159 and the March low of 14458 (March 20). The loss of the latter exposes a potential drop to the December 2022 low of 13791 (December 20). The daily RSI improved to the proximity of 66.
Best Performers: BASF, Dr Ing hc F Porsche Prf, Airbus Group
Worst Performers: RWE AG ST, Sartorius AG VZO, Siemens Healthineers
Resistance levels: 16490 16500? 17000? (4H chart)
Support levels: 16000 15456 14809 (4H chart)
NASDAQ
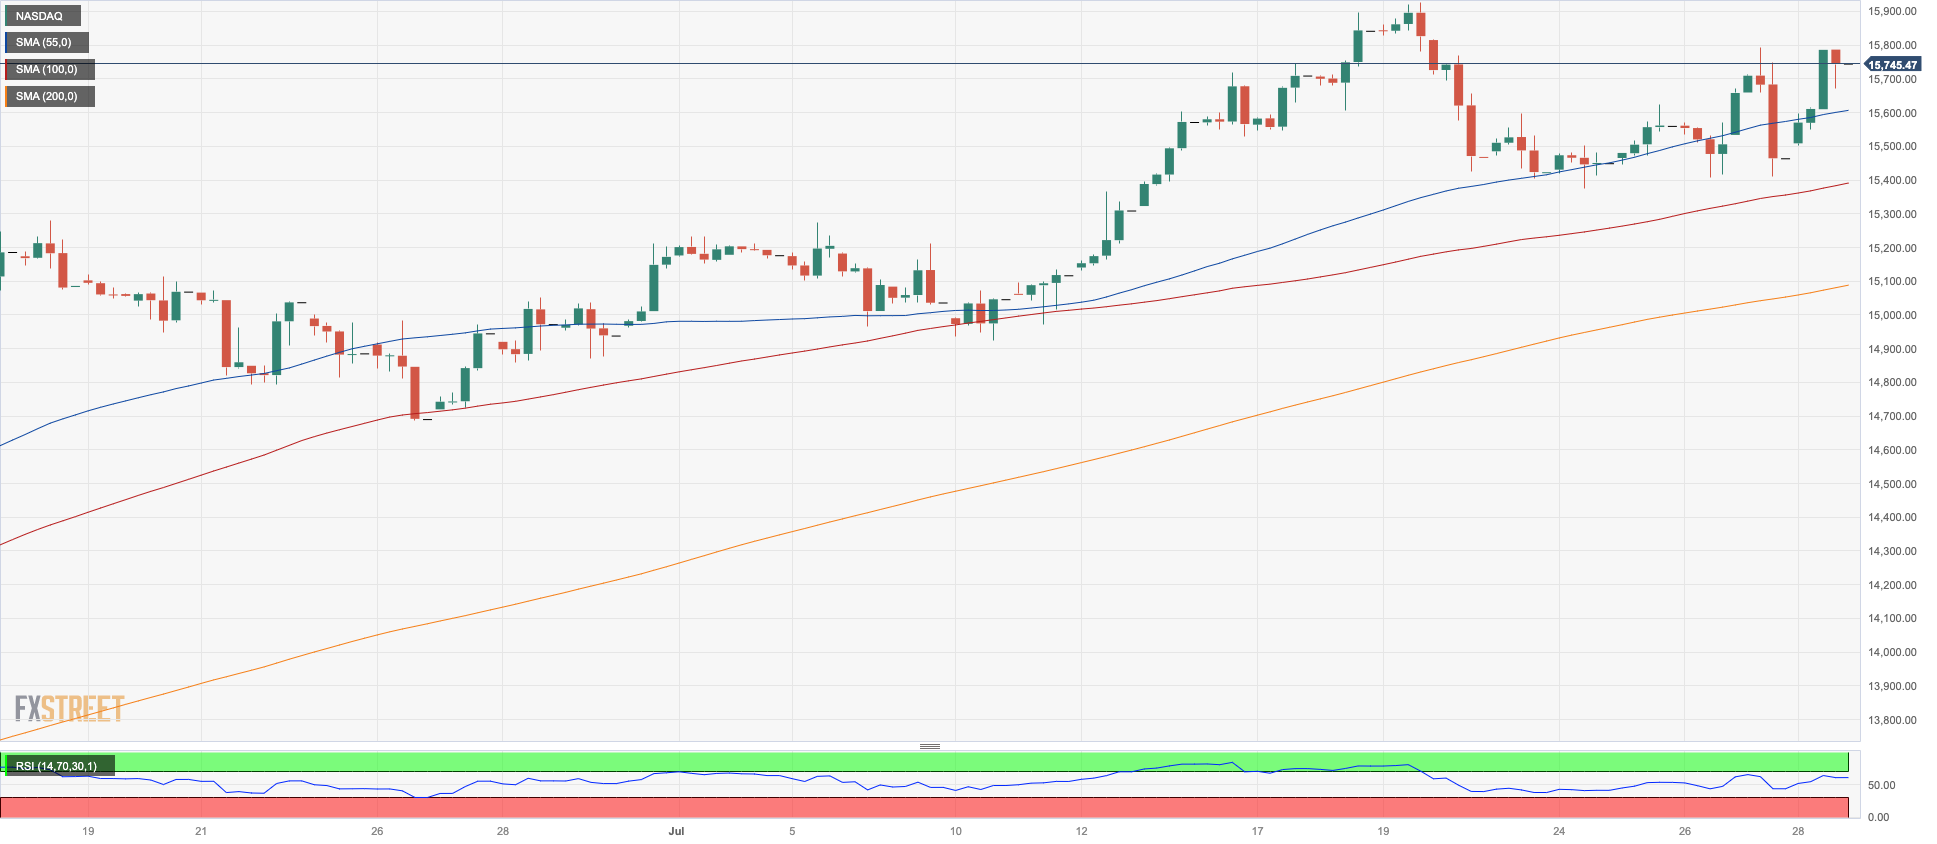
Tech stocks, as measured by the Nasdaq 100, experienced a significant rise and briefly reached the 15800 level after two consecutive days of declines on Friday.
The surge in the benchmark index was fueled by investors' renewed enthusiasm for the technology and artificial intelligence (AI) sectors.
Additionally, the decline in US yields supported the belief that the Fed’s normalization process may be approaching its conclusion, adding further momentum to the ongoing rally.
Several factors contributed to the Nasdaq's positive performance, with notable contributions coming from solid developments reported by major companies such as Apple, Meta Platforms (formerly known as Facebook), Alphabet (Google's parent company), and Microsoft.
The Nasdaq 100 faces an immediate uphill climb at its 2023 high of 15932 (July 19), which is closely followed by the round 16000 milestone. In contrast, first support is found at the weekly low of 15374 (July 24), followed by the July low of 14924 (July 10). Another weekly low is at 14687 (June 26) and 14283 (June 7). A break of this level might pave the way for a decline to the weekly low of 13520 (May 24) and the May low of 12938 (May 4) ahead of the April low of 12724 (April 25), which appears to be supported by the 200-day SMA (12738). A deeper dip might see the March low of 11695 (March 13) revisited. The daily RSI increased past 65.
Top Gainers: Lucid Group, JD.com Inc Adr, Intel
Top Losers: Enphase, Walgreen Boots, Cisco
Resistance levels: 15795 15932 16017 (4H chart)
Support levels: 15374 14924 14687 (4H chart)
DOW JONES
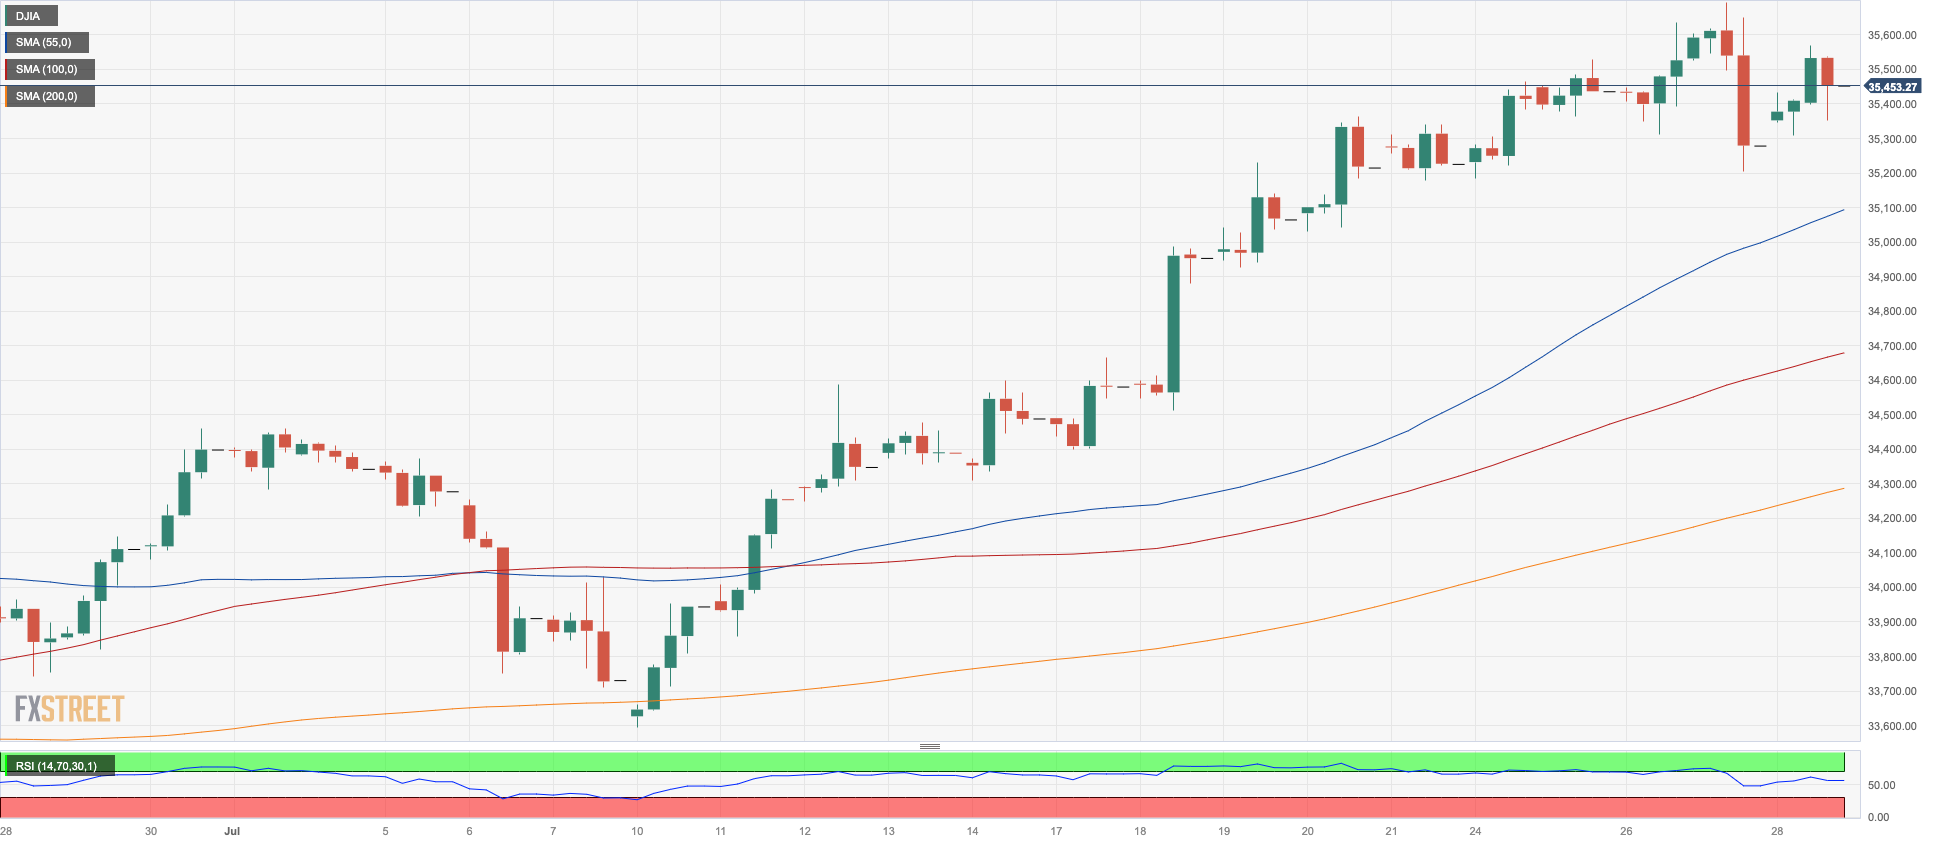
U.S. stocks, as measured by the Dow Jones index, clawed back some of Thursday's losses and ended the week on a positive note, closing around the 35500 level. This marked the third straight week of gains for the index.
Investor sentiment continued to improve on hopes that signs of easing US inflation will enable the Federal Reserve to pull back on its rate hike plans. The resilience of the American economy, indicating a soft landing may be achievable, also boosted the outlook.
All in all, the Dow Jones gained 0.50% to 35459, the S&P500 rose 0.99% to 4582, and the tech-focused Nasdaq Composite advanced 1.90% to 14316.
The Dow Jones is currently facing a significant hurdle at its 2023 high of 35645 (July 27). If the index is able to clear this hurdle, it may encounter the February 2022 peak of 35824 (February 9) ahead of its all-time high of 36952 (January 5, 2022). Instead, the index is expected to meet initial contention not before the intermediate 55-day SMA at 33996 prior to the weekly low of 33610 (June 26), which is reinforced by the transitory 100-day SMA at 33604. Additionally, the 200-day SMA at 33368, the May low of 32586 (May 25), and the 2023 low of 31429 (March 15) could provide support if the index were to decline further. The daily RSI eased below 70, indicating that the market is still somewhat overbought, but not as severely as before.
Top Performers: Intel, Procter&Gamble, Microsoft
Worst Performers: Walgreen Boots, Cisco, Travelers
Resistance levels: 35645 35824 36513 (4H chart)
Support levels: 35216 34418 33705 (4H chart)
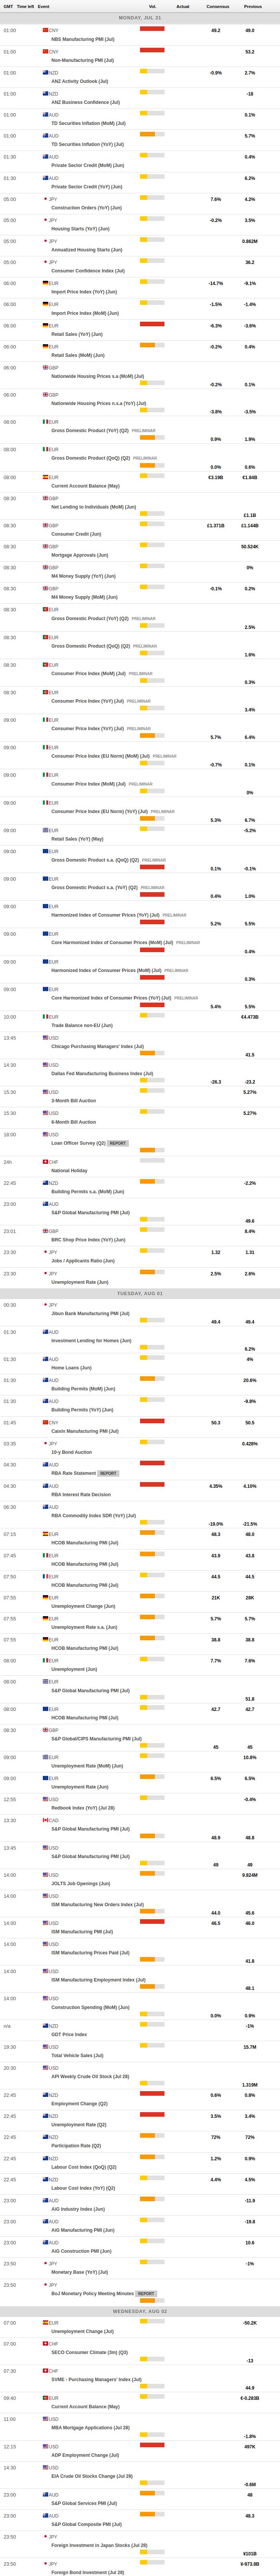
MACROECONOMIC EVENTS
All Information & Updates provided by:

All information relating to the financial markets available on this page has been prepared and issued by FXStreet (Forexstreet SL, Spain, Reg: B62498233) on the basis of publicly available information and all information believed to be reliable and does not conflict with Kuwaiti local laws, and all necessary care has been taken to before the company to ensure that the facts mentioned are correct from the source.
NCM Investment nor any of its directors or employees shall in any way be held responsible for the contents of this news, and the information contained on this page is intended only to provide clients with publicly available information and should not be construed as investment advice, report or analysis and/or constitute an offer or invitation to buy or sell financial instruments of any kind.
RISK WARNING: Forex and CFDs are highly risky leveraged products, as losses can exceed deposits. Please ensure you understand all the risks and take independent advice if necessary. NCM will segregate the clients based on the criteria of the regulator and its bylaws. NCM does not provide any advisory service; the material published does not constitute advice or a recommendation for a transaction in any financial instrument. NCM accepts no responsibility for any use of the content presented and any consequences of that use. Anyone acting on the information provided does so at their own risk.