Daily Market Updates
01 Aug 2023
USDJPY
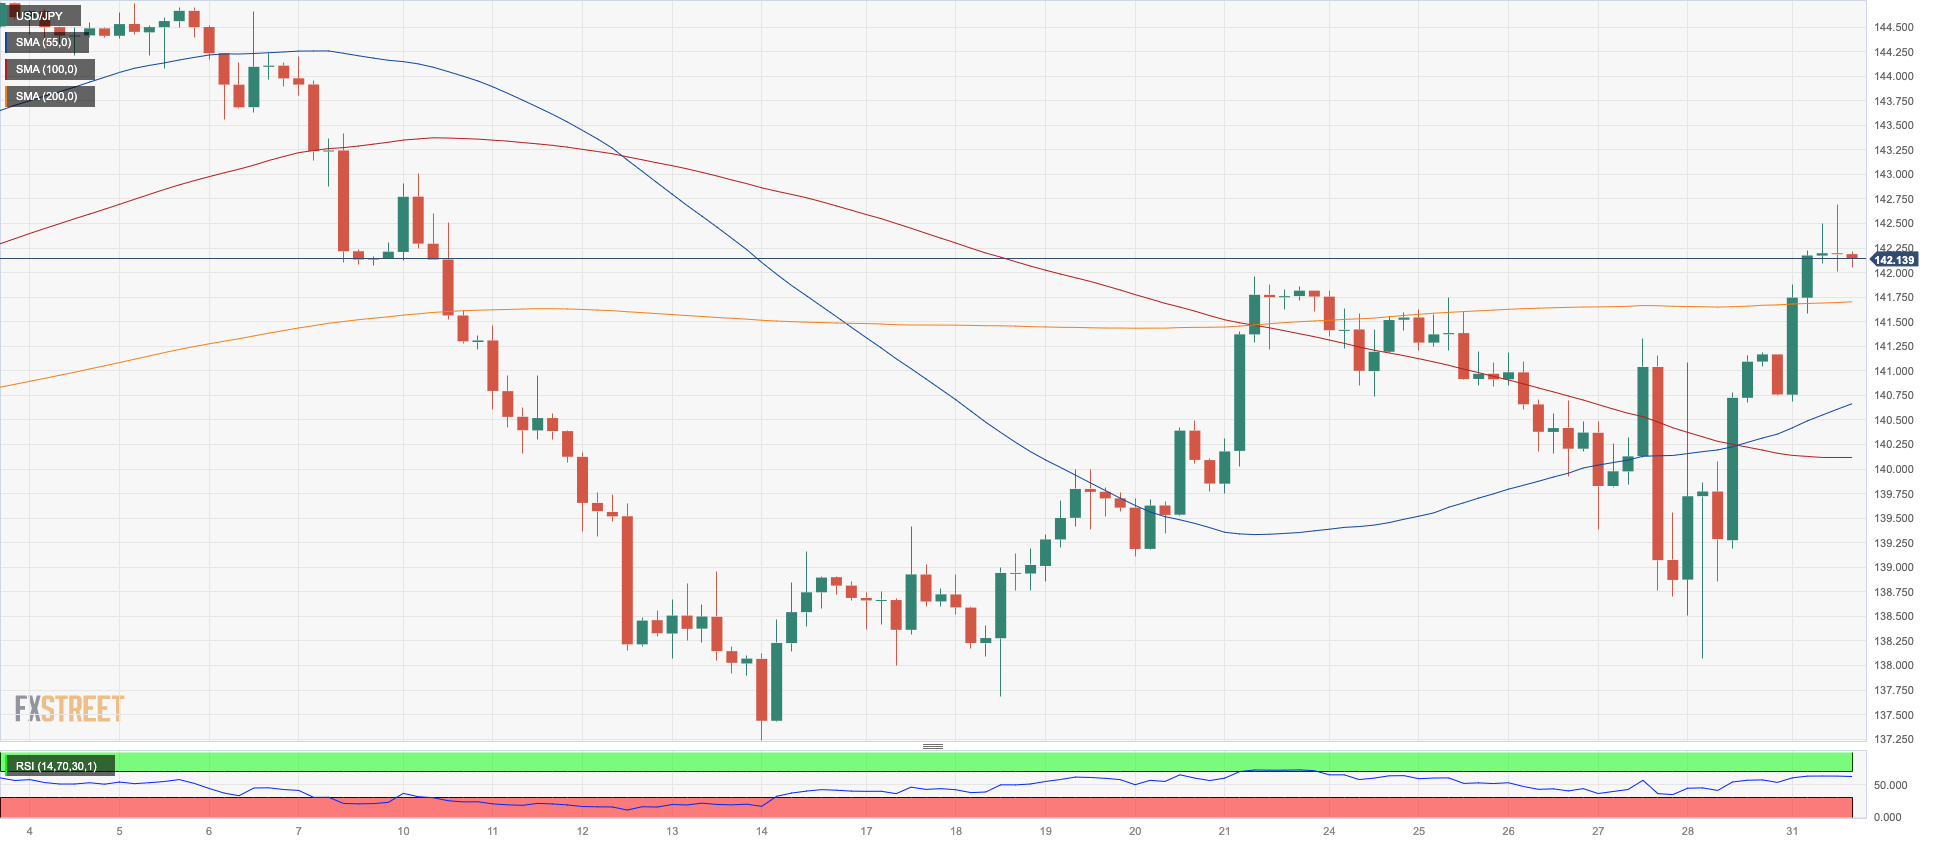
At the start of the week, USD/JPY surged to fresh 3-week highs, reaching around 142.70, which further added to the strong performance it displayed on Friday.
The Japanese yen continued to weaken as the impact of the recent announcements made by the BoJ regarding the Yield Curve Control (YCC) adjustments gradually diminished on Monday.
To elaborate on this, the BoJ made a significant decision to introduce more flexibility concerning its 10-year JGB target of 0% +/- 50 basis points. Essentially, this means that the previously rigid band is no longer fixed, and the central bank allowed 10-year JGBs to be traded at rates up to 1% for the time being. This move is seen as a step towards a potential exit from the YCC policy.
On this, the JGB 10-year yields rose to fresh tops past 0.60% on Monday.
The domestic economic calendar was quite packed with important indicators: the flash prints revealed that Industrial Production contracted by 0.4% in the year up to June, while Retail Sales experienced growth of 5.9% over the past twelve months. Furthermore, Consumer Confidence improved, rising to 37.1 in July, and Housing Starts declined by 4.8% in June compared to the same period last year.
Immediately on the upside of USD/JPY is the weekly high of 142.68 (July 31), followed by the 2023 top of 145.07 (June 30) and the 2022 high of 151.94 (October 21). On the downside, the weekly low of 138.05 (July 28) is just ahead of the July low of 137.23 (July 14) and the important 200-day SMA of 136.64. The breach of the latter exposes the weekly low of 133.01 (April 26) ahead of minor support of 132.01 (April 13) are ahead of the April low of 130.62 (April 5) and the important round mark of 130.00. The RSI on the daily chart crossed the 56 level.
Resistance levels: 142.68 143.00 144.66 (4H chart)
Support levels: 141.65 140.22 138.05 (4H chart)
GBPUSD
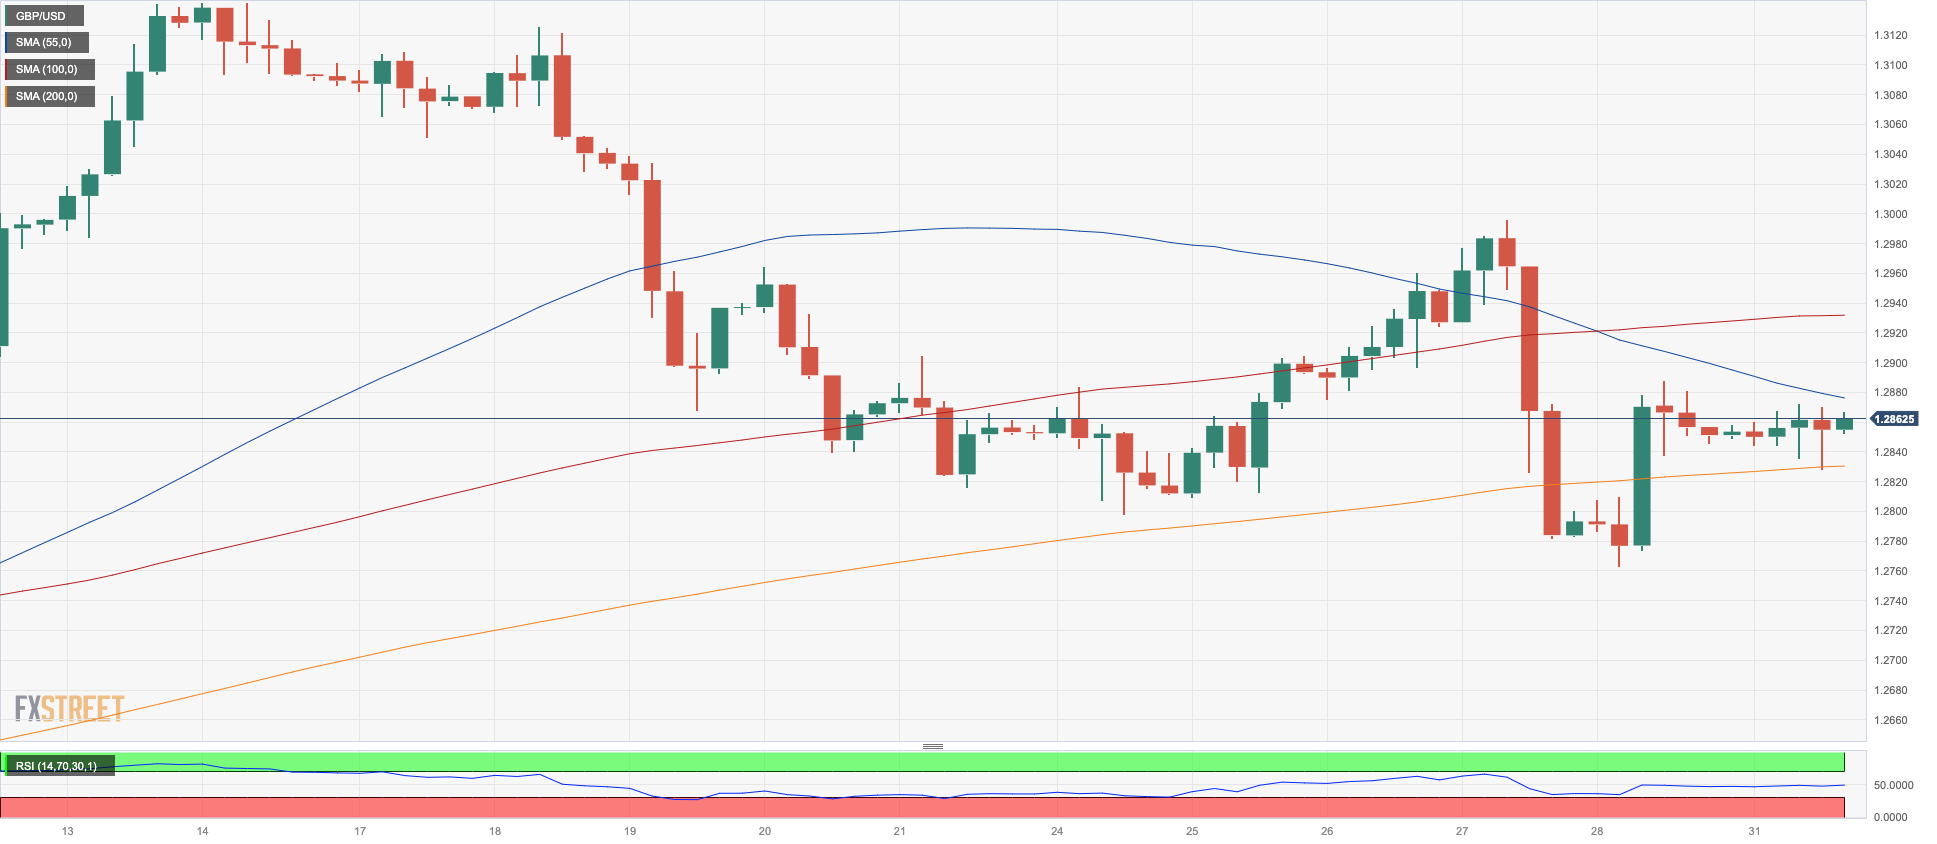
The vacillating price action around the greenback seems to have been enough to spark the second consecutive daily uptick in GBP/USD, which managed to retest the 1.2870/75 band at the beginning of the week.
Indeed, Cable navigated within alternating risk appetite trends in a context where the pre-NFP lull appears to have taken over markets’ sentiment earlier than usual.
Moving forward, other than dollar dynamics, the sterling is expected to remain under the microscope in light of the key BoE meeting on August 3, where the “Old Lady” is seen hiking rates by 50 bps.
In the UK, monthly Mortgage Approvals increased to 54.662K in June and Mortgage Lending rose to £0.136B in the same month.
The resumption of the downtrend could see GBP/USD revisit the weekly low of 1.2762 (July 28), followed by the short-term 55-day SMA at 1.2681, and the weekly low of 1.2590 (June 29). Down from here, the 2021-2023 trend line is located just below the 1.2500 yardstick, followed by the June low of 1.2368 (June 5), the May low of 1.2308 (May 25), and the crucial 200-day SMA at 1.2291. On the contrary, the weekly high of 1.2995 (July 27) stands in the way of the 2023 high of 1.3142 (July 14). Cable may then attempt to test the weekly peaks of 1.3146 (April 14, 2022) and 1.3298 (March 23, 2022). The daily RSI rose to the boundaries of 52.
Resistance levels: 1.2888 1.2995 1.3125 (4H chart)
Support levels: 1.2822 1.2762 1.2750 (4H chart)
AUDUSD
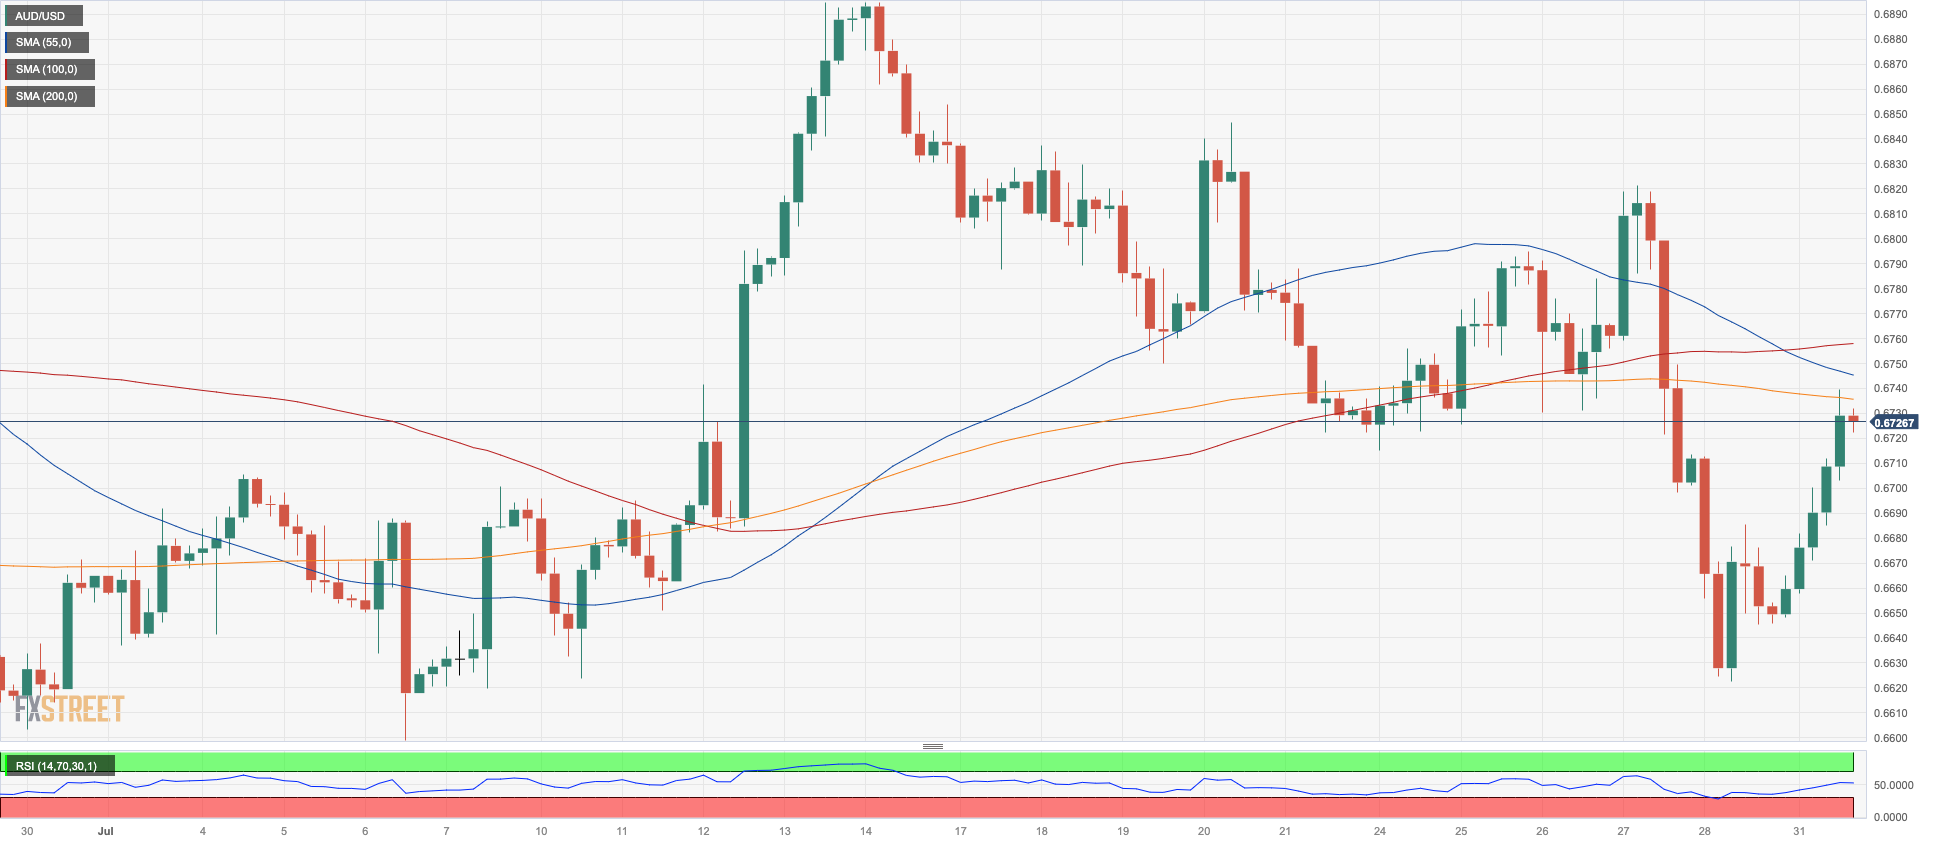
Renewed upside impulse lifted AUD/USD to fresh 2-day highs in the 0.6730/40 band on Monday, an area also coincident with the crucial 200-day SMA.
The inconclusive price action in the greenback in combination with mixed results from the Chinese docket published during early trade seem to have bolstered the daily upside in the pair, which at the same time reversed three consecutive daily pullbacks.
Data-wise in Oz, Housing Credit expanded at a monthly 0.2% in June in what was the sole release on Monday ahead of the key RBA interest rate decision on Tuesday.
Additional AUD/USD losses may find first support at the weekly low of 0.6622 (July 28), followed by another weekly low of 0.6595 (June 29), all before the 2023 low of 0.6458 (May 31). South from here, the November 2022 bottom of 0.6272 (November 3) will happen before the 2022 low of 0.6179 (October 13). Having said that, the July high of 0.6894 (July 13) appears to be the initial up-barrier, followed by the June peak of 0.6899 (June 16). Breaking through this sector would pave the way for a move to the psychological 0.7000 level before the weekly high of 0.7029 (February 14) and the 2023 top of 0.7157 (February 2). The daily RSI improved to the boundaries of the 50 threshold.
Resistance levels: 0.6739 0.6821 0.6846 (4H chart)
Support levels: 0.6622 0.6599 0.6579 (4H chart)
GOLD
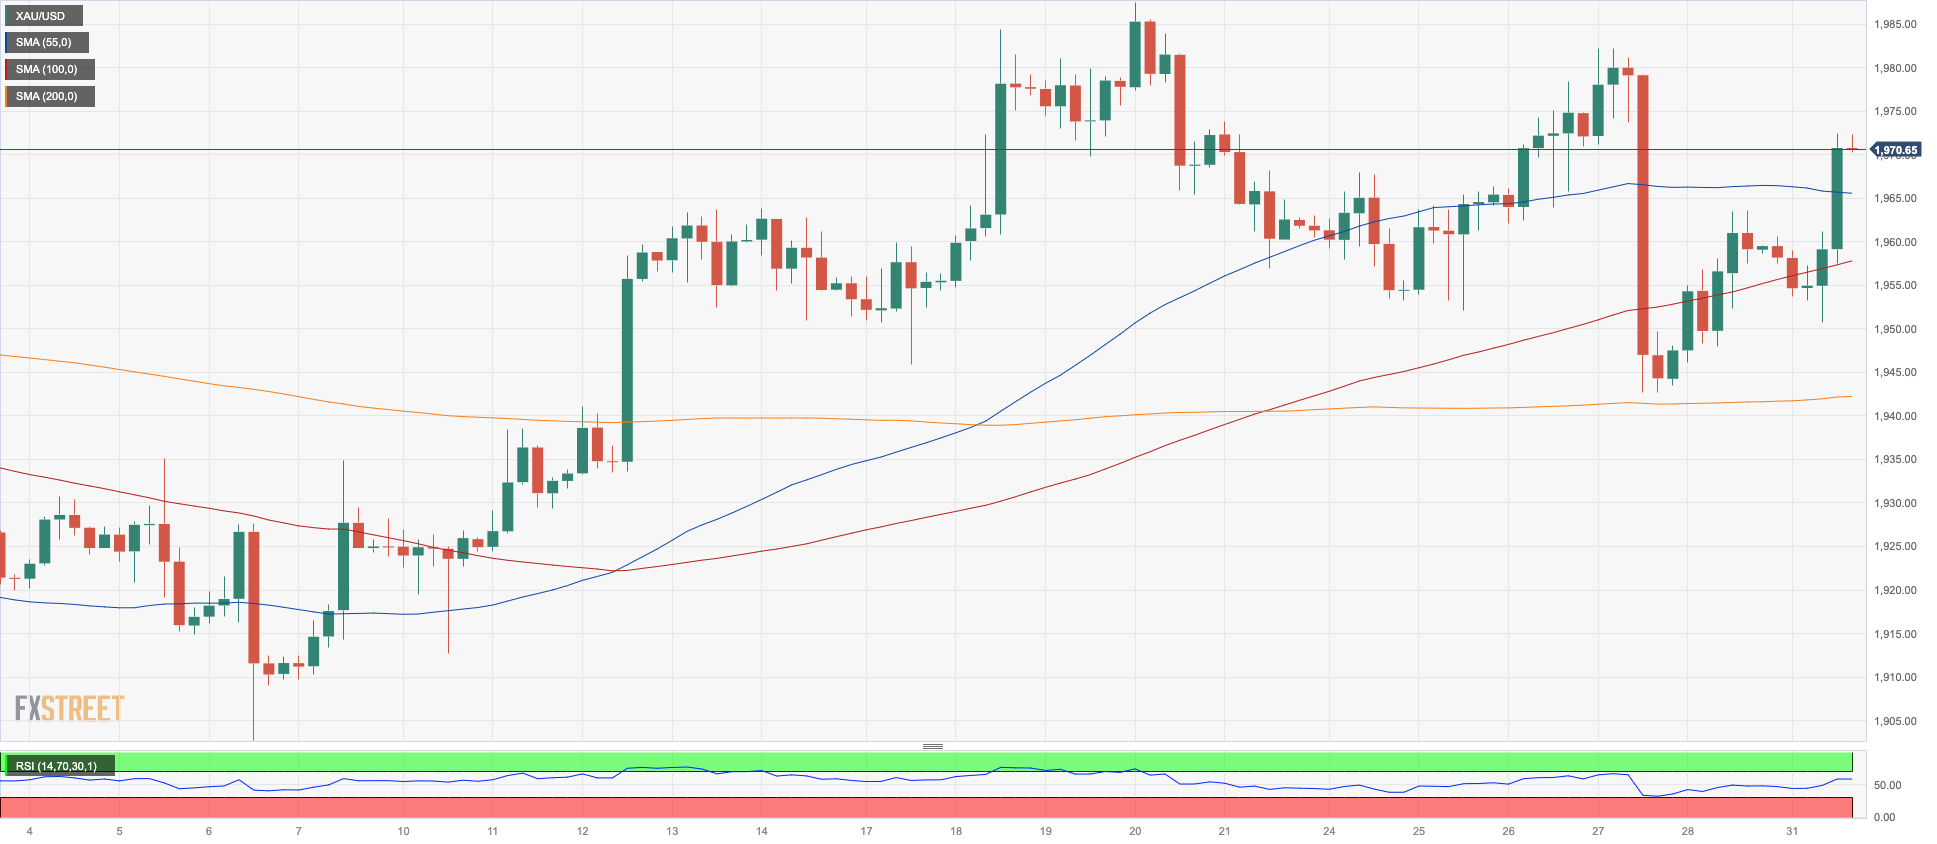
Gold prices increased for the second consecutive session on Monday, this time breaking through the $1970 mark per troy ounce, a level that is bolstered by the 100-day SMA ($1968).
The dollar’s indecisive start to the new week, along with falling US yields, helped the precious metal gain additional momentum and climb to a two-day high, opening the door to a potential move to the monthly highs above $1980 in the short-term horizon.
The view that the Federal Reserve may be nearing the end of its rate-hiking cycle also appears to have been supporting prices of gold in the last couple of sessions.
Extra gains could encourage gold prices to initially revisit the July high of $1987 (July 20). A break above this level might pave the way for a move towards the critical level of $2000, and beyond that, it could reveal the road to the 2023 high of $2067 (May 4) and the 2022 top of $2070 (March 1), all prior to the all-time peak of $2075 (August 7, 2020). Just the opposite, if the weekly low of $1942 (July 27) is broken, the price may test the round level of $1900 before dropping to the June low of $1893 (June 29). Further declines would be hampered by the 200-day SMA at $1887, followed by the 2023 low of $1804 (February 28) and the critical support level at $1800.
Resistance levels: $1972 $1987 $2022 (4H chart)
Support levels: $1942 $1912 $1893 (4H chart)
CRUDE WTI
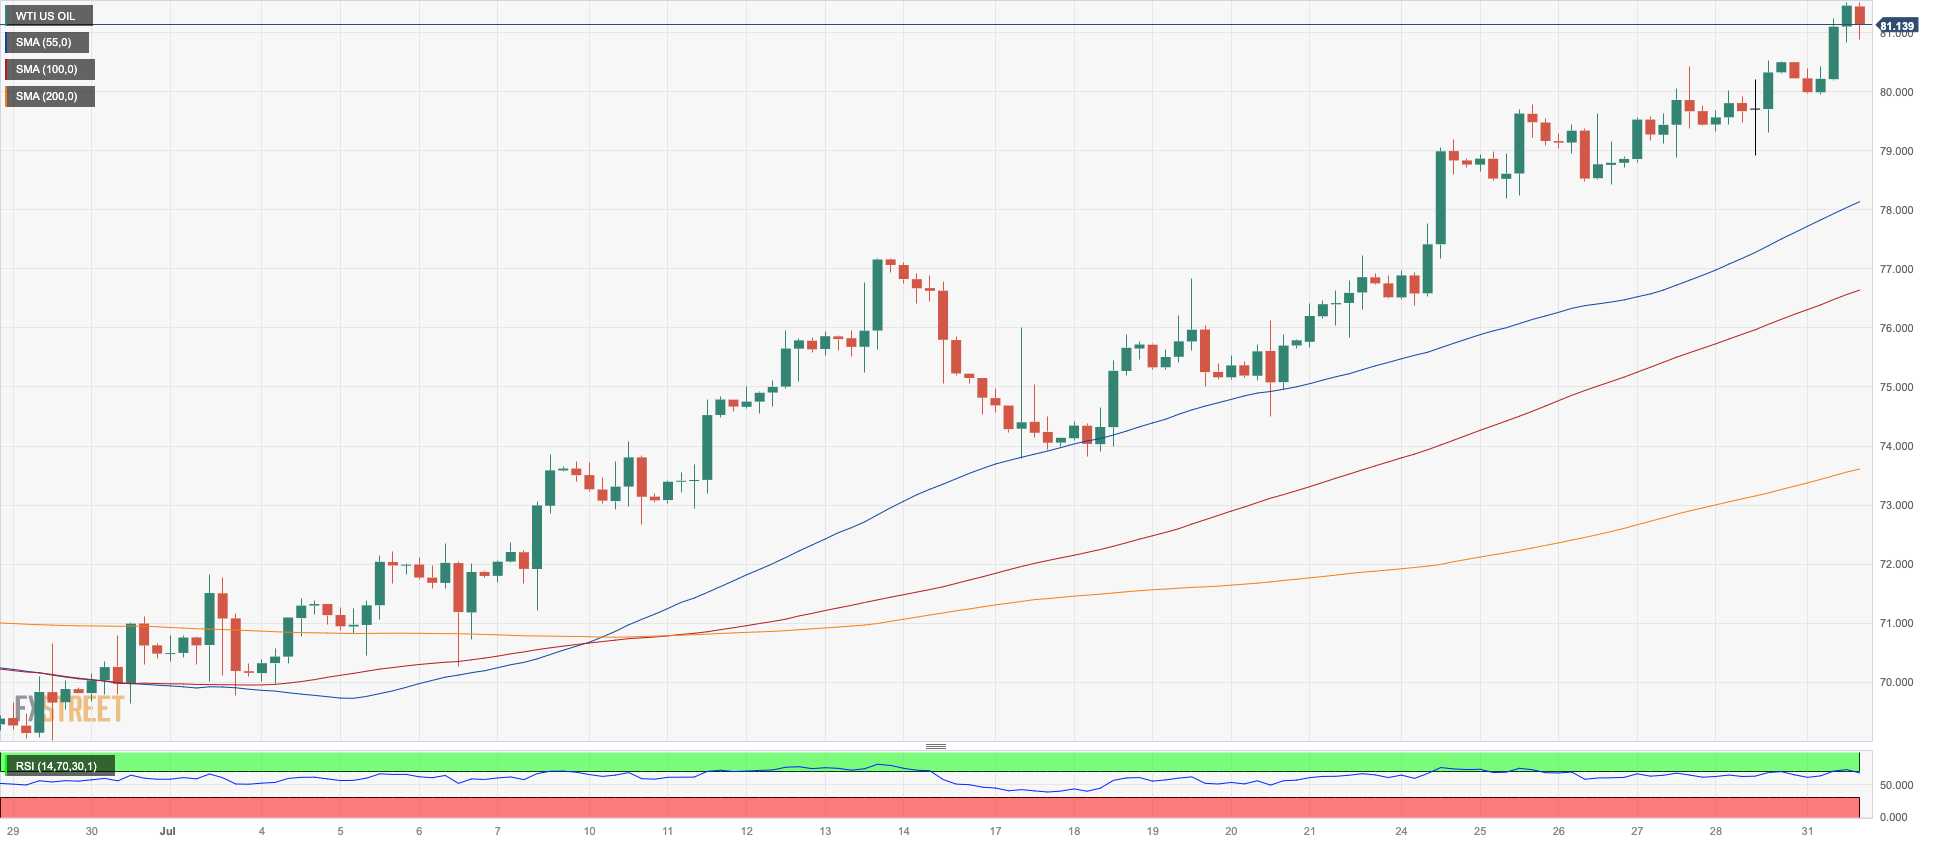
On Monday, the rally in WTI prices showed no signs of slowing down.
The price of the American benchmark for sweet light crude oil surpassed the crucial $81.00 per barrel threshold, reaching a new three-month high. The tight supply narrative and the long-awaited economic recovery in China were major factors contributing to this uptick.
Additionally, traders are anticipating that Saudi Arabia will extend its voluntary oil output cuts, and disruptions in Nigeria's supply and the Biden Administration's refilling of the SPR have also contributed to the story.
Looking ahead, the API and EIA will release their reports on US crude oil inventories for the week ending on July 28 on Tuesday and Wednesday respectively.
If WTI prices increase over the July high of $81.68 (July 31), they may aim for the $83.49 top in 2023 (April 12) and the November 2022 peak of $93.73 (November 7). Support, on the other hand, may first appear around the 200-day SMA at $76.62, followed by the weekly low of $73.89 and the 100-day and 55-day SMAs at $73.61 and $72.70, respectively. If WTI falls below that level, the June low of $66.86 (June 12) and the 2023 bottom of $63.61 (May 4) might become relevant. Below that, the December 2021 bottom of $62.46 (December 2) may provide support before the critical round level of $60 is reached.
Resistance levels: $81.68 $83.08 $83.49 (4H chart)
Support levels: $78.25 $74.47 $73.40 (4H chart)
GER40
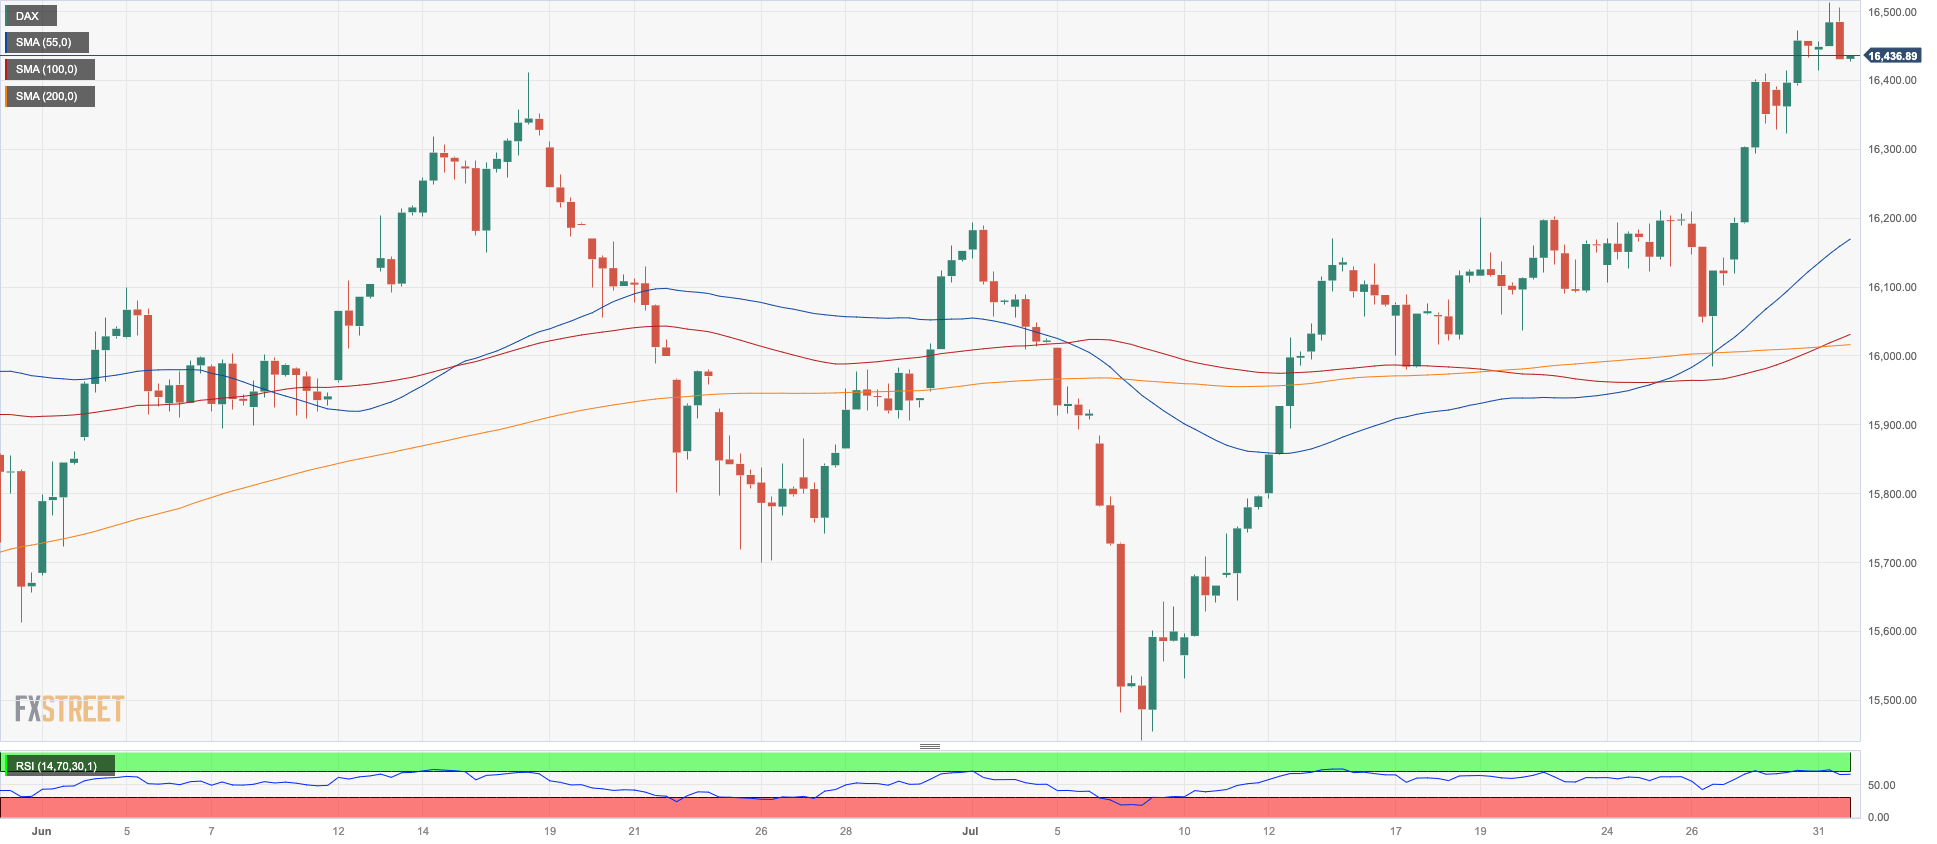
The German benchmark DAX40 ended the session slightly on the defensive although not before hitting a new all-time high past 16500 on Monday.
Indeed, lower inflation prints in the euro area for the month of July lifted spirits among investors and supported the idea that the ECB might end its tightening campaign sooner than expected.
However, firmer preliminary readings from the Q2 GDP in the broader euro area poured cold water over those expectations. It is worth recalling that while the region’s economy is seen expanding at a decent pace in the April-June period, economies like Germany and Italy are seen contracting.
The daily downtick in the index came in tandem with the second daily pullback in a row in the 10-year bund yields.
In the domestic calendar, Retail Sales contracted at an annualized 1.6% in June and 0.8% vs. the previous month.
The DAX40's next resistance level is the record high of 16528 established on July 31. On the opposite side, there is a weekly low at 16000 (July 26) which appears underpinned by the transitory 55-day SMA (16039). Down from here emerges the temporary 100-day SMA at 15825 ahead of the July low of 15456 (July 7) and the critical 200-day SMA at 15178. The breakdown of this region exposes a move to the March low of 14458 (March 20) prior to the December 2022 low of 13791 (December 20). The daily RSI deflated a tad to the subu-65 area.
Best Performers: Sartorius AG VZO, Rheinmetall AG, Infineon
Worst Performers: Siemens Energy AG, Munich Re Group, Hannover Rueck SE
Resistance levels: 16528 17000? (4H chart)
Support levels: 16000 15456 14809 (4H chart)
NASDAQ
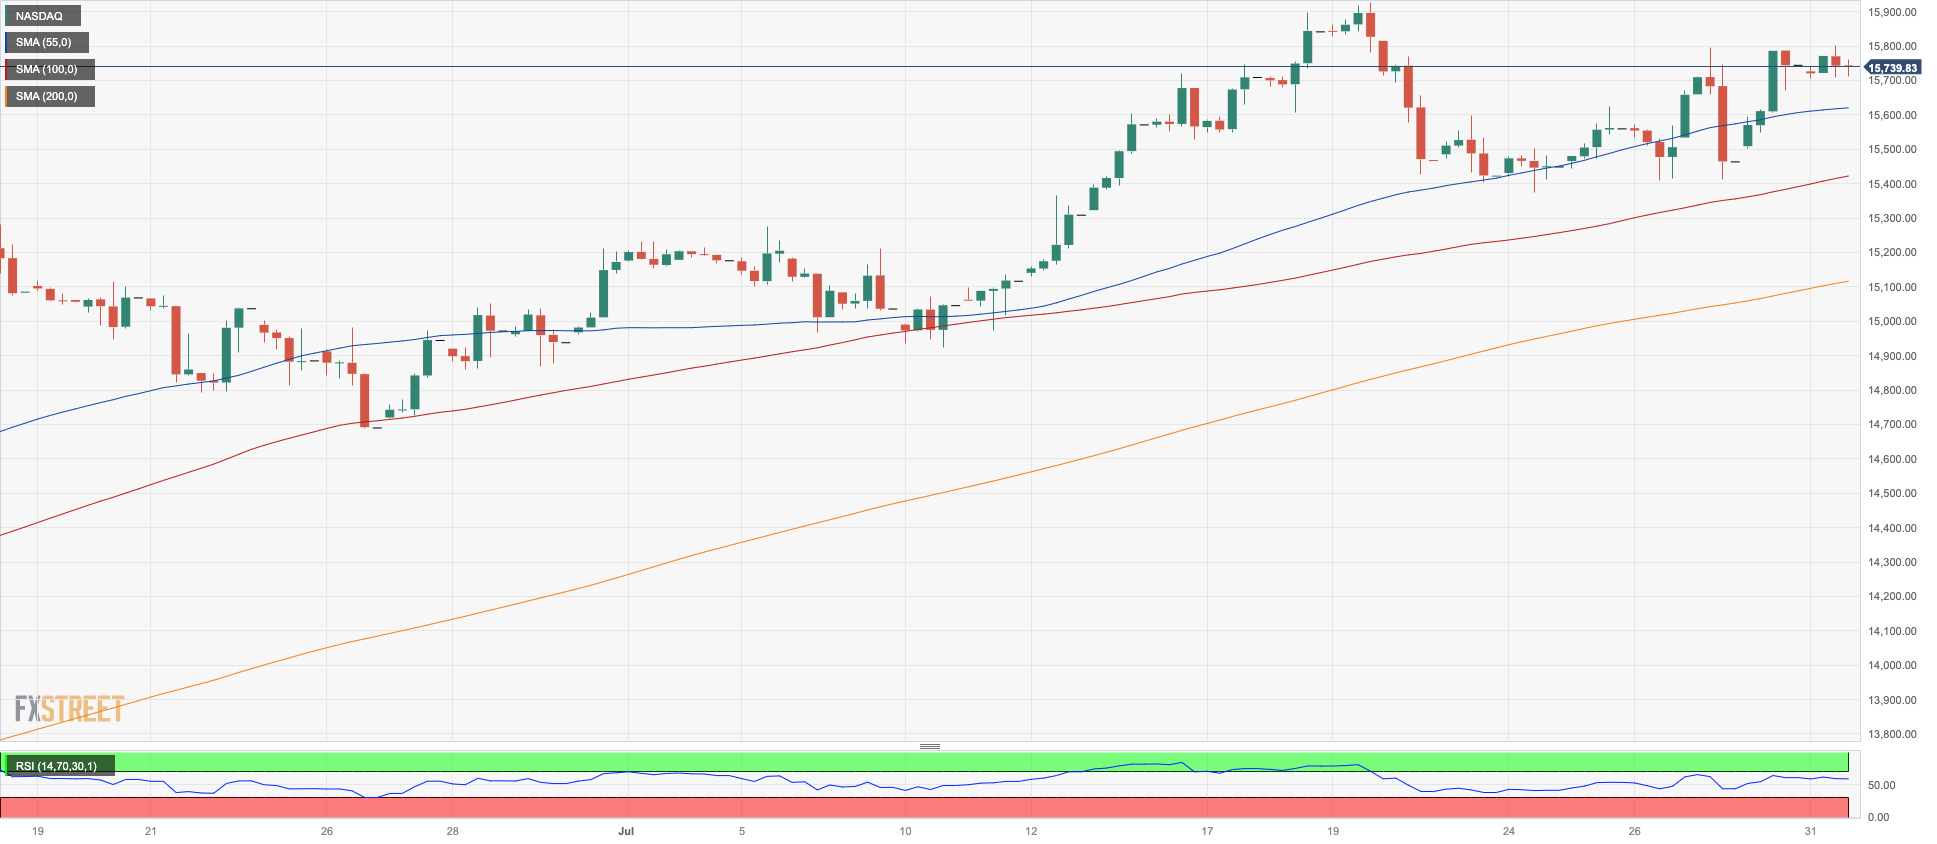
In line with the rest of its US peers, the tech reference index Nasdaq 100 traded within a tight range in a quite unemotional start of the new week.
Investors adopted a guarded approach as they await highly anticipated quarterly results from behemoths like Apple, Amazon, Alphabet and Meta Platforms, due out later this week.
The indifferent sentiment surrounding the dollar and fading US Treasury yields likewise contributed to the restrained tone in trading.
The Nasdaq 100 faces an immediate uphill climb from its 2023 peak of 15932 (July 19), which is quickly followed by the round 16000 milestone. In contrast, the weekly low of 15374 (July 24) emerges as the immediate contention ahead of the July low of 14924 (July 10). Further south aligns the weekly lows of 14687 (June 26) and 14283 (June 7). A breach of this region might open the door to a drop to the weekly low of 13520 (May 24) prior to the May low of 12938 (May 4) and before the April low of 12724 (April 25), which looks to be supported by the 200-day SMA (12762). A further drop might bring the March low of 11695 (March 13) back into play. The daily RSI broke below the 65 level.
Top Gainers: Atlassian Corp Plc, Crowdstrike Holdings, Adobe
Top Losers: DexCom, T-Mobile US, Intel
Resistance levels: 15795 15932 16017 (4H chart)
Support levels: 15374 14924 14687 (4H chart)
DOW JONES
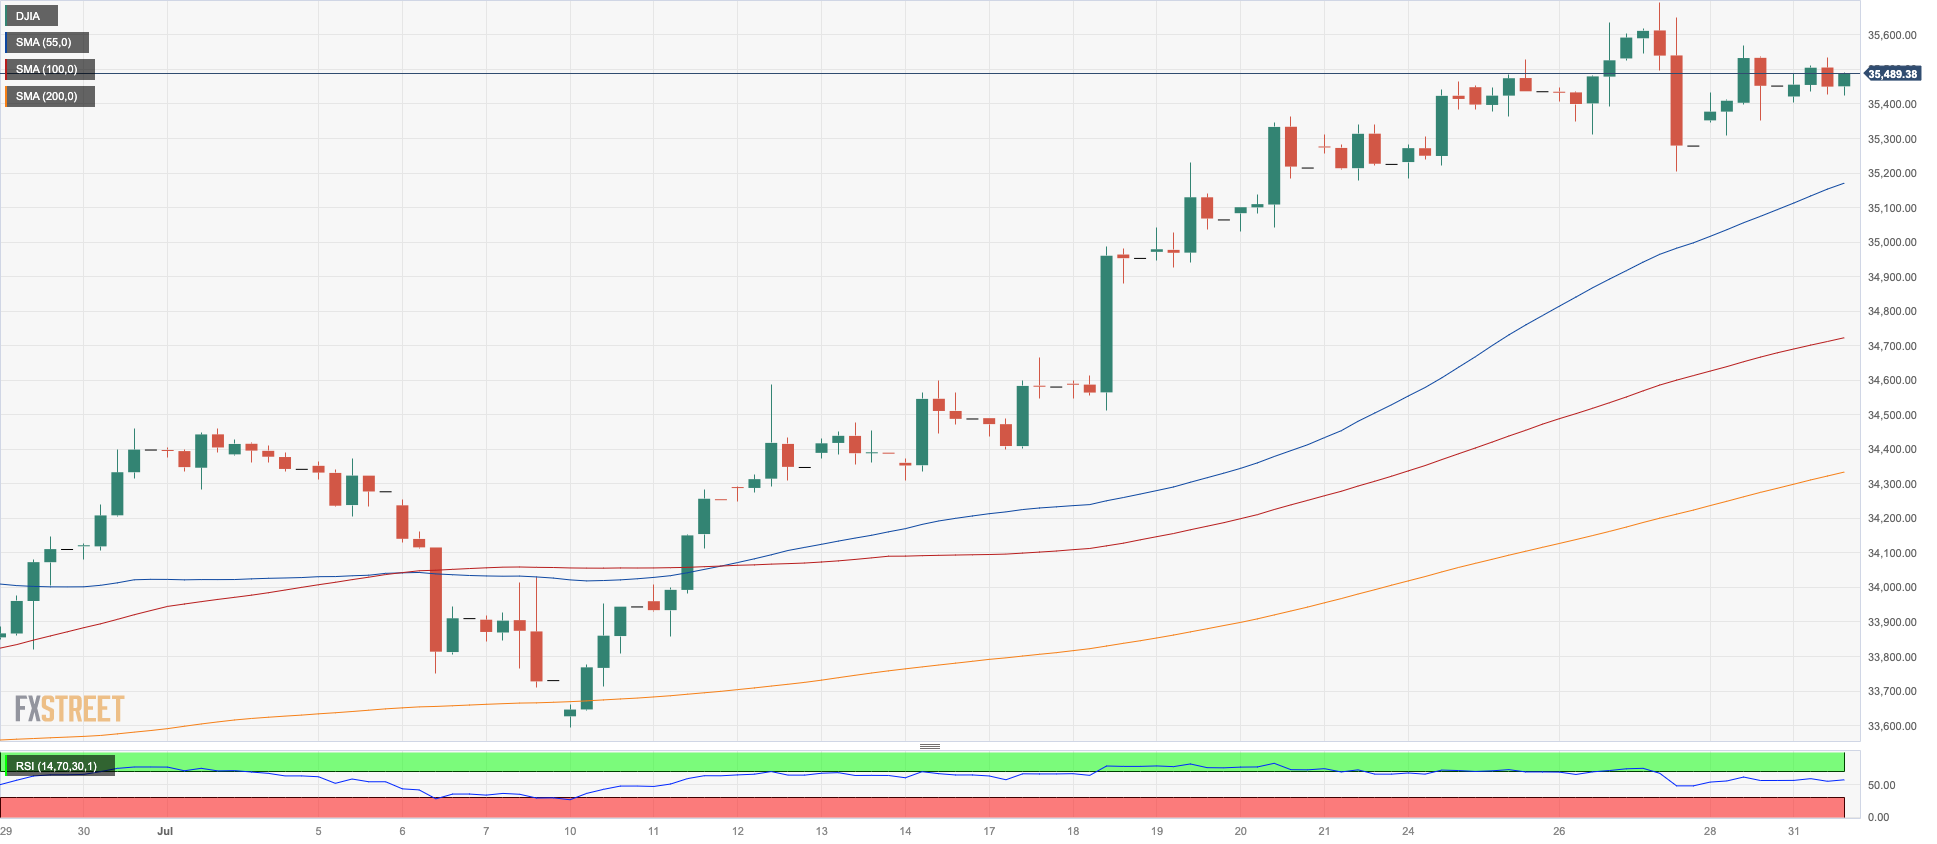
At the beginning of the week, the US equities represented by the Dow Jones index showed an indecisive start, fluctuating around the levels seen on Friday's closing.
It appears that investors are exercising caution as they await significant corporate earnings reports from the tech sector, along with critical data regarding the US labor market and ISM indicators, all scheduled for later in the week. This sense of prudence seems to have taken precedence among investors, influencing their current approach to the market.
Overall, the Dow Jones rose 0.03% to 35470, the S&P500 dropped 0.02% to 4581, and the tech-benchmark Nasdaq Composite gained 0.03% to 14321.
The Dow Jones is presently facing a strong barrier at its 2023 high of 35645 (July 27). If the index can overcome this barrier, it may reach the February 2022 top of 35824 (February 9) before reaching its all-time high of 36952 (January 5, 2022). Instead, the index is projected to hit first support level not until the intermediate 55-day SMA at 34032. Down from here comes the July low of 33705 (July 10), which is strengthened by the transitory 100-day SMA at 33631. If the index falls further, the 200-day SMA at 33400, the May low of 32586 (May 25), and the 2023 low of 31429 (March 15) might give support. The daily RSI remained somewhat flattish around 70.
Top Performers: Walt Disney, Chevron, Nike
Worst Performers: J&J, Intel, Amgen
Resistance levels: 35645 35824 36513 (4H chart)
Support levels: 35216 34526 33705 (4H chart)
MACROECONOMIC EVENTS


