
- Contact Us:
-

-

-

-


Daily Market Updates
02 Aug 2023
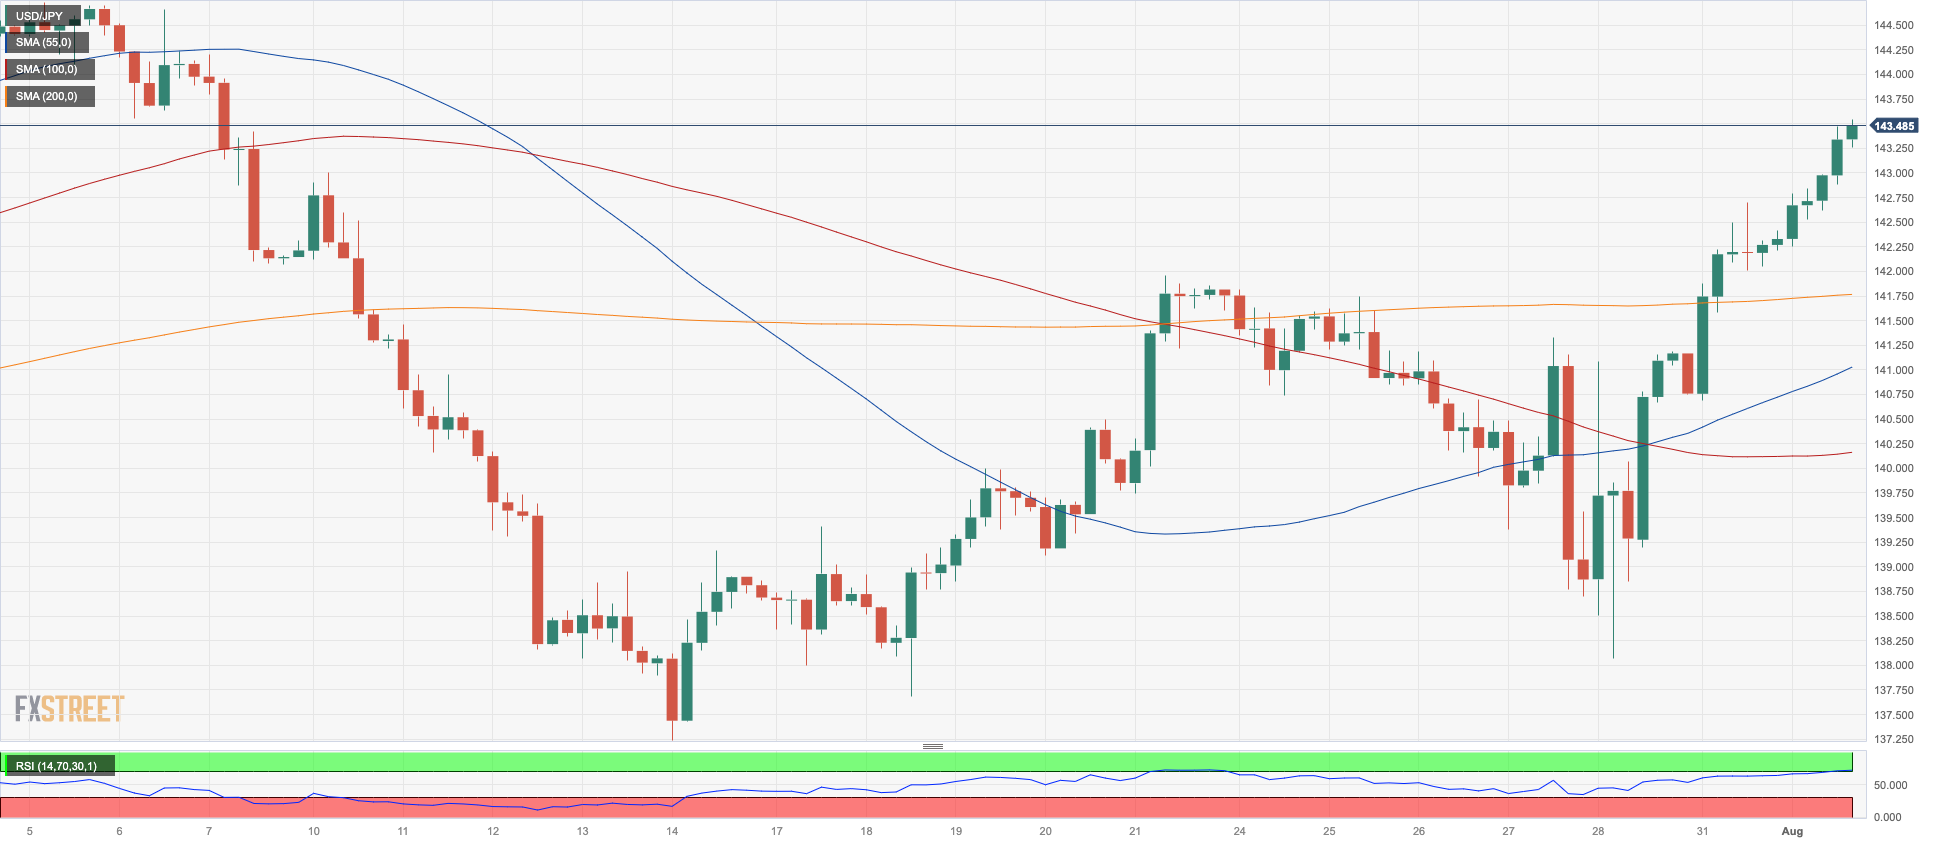
USDJPY
Up, up, up you go.
Further depreciation of the Japanese yen in combination with the unabated advance in the greenback lifted USD/JPY to new four-week highs well north of 143.00 the figure on Tuesday.
Indeed, US yields rose markedly across the curve, while JGB yields navigated within a consolidative mood around the 0.60% region, all against the backdrop of fresh tops in the USD Index (DXY) past the 102.00 hurdle.
In Japan, the unemployment rate dropped to 2.5% in June (from 2.6%), and the Jobs/Applications Ratio rose to 1.3 in the same period. Additionally, the final Jibun Bank Manufacturing PMI eased marginally to 49.6 last month (from 49.8).
Further upside in USD/JPY should not meet any resistance level of note until the weekly high of 143.18 (August 1), which appears before the 2023 top of 145.07 (June 30) and the 2022 peak of 151.94 (October 21). On the downside, the weekly low of 138.05 (July 28) is barely ahead of the July low of 137.23 (July 14), as well as the crucial 200-day SMA of 136.62. The violation of the latter exposes the weekly low of 133.01 (April 26), the weak support of 132.01 (April 13), and the crucial round mark of 130.00. On the daily chart, the RSI trespassed the 60 yardstick.
Resistance levels: 143.9492 144.66 145.07 (4H chart)
Support levels: 141.71 140.22 138.05 (4H chart)
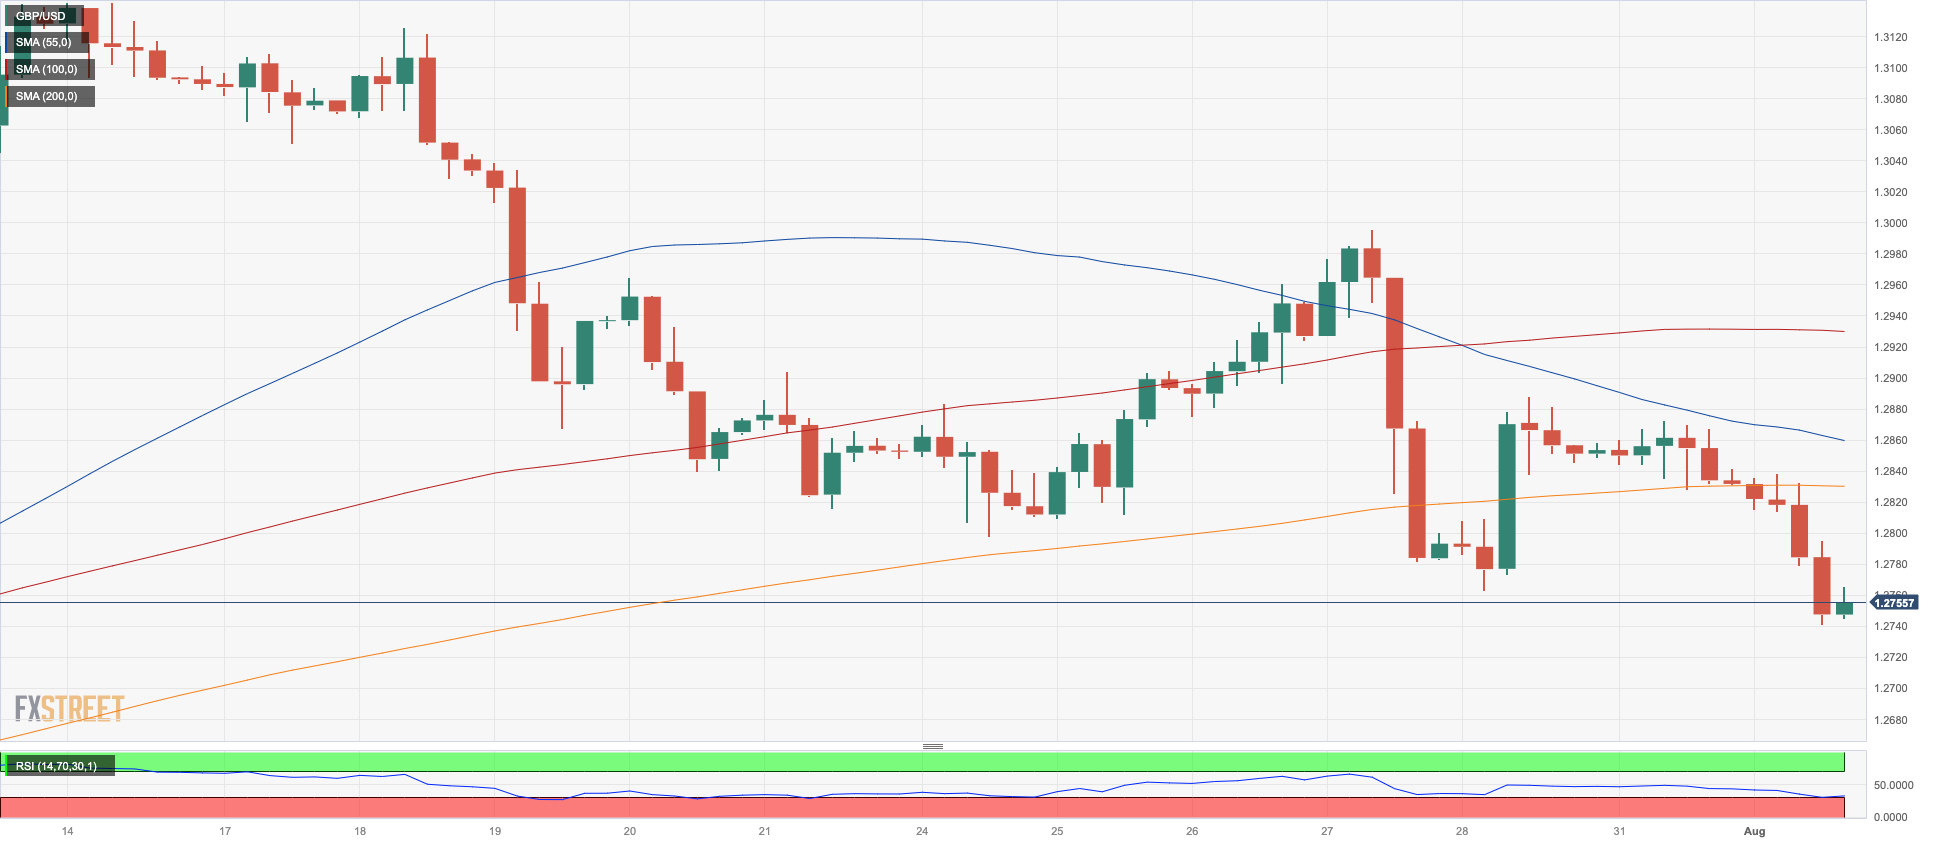
GBPUSD
On Tuesday, the continuous rise of the greenback has led to a lack of significant price movements in the risky financial markets.
Against that, the British pound has weakened against the dollar and dropped below the 1.2800 level, nearing its lowest point in several weeks. This drop occurred despite a slight increase in 10-year gilt yields before the BoE’s upcoming event on Thursday.
Furthermore, the quid may experience increased volatility due to the expectation that the BoE may raise its policy rate to 5.25% from 5.00%. Currently, there are predictions of a 25 basis point hike in September and November, with the likelihood of one final 25 bp increase in the first quarter of next year standing at around 50%.
Regarding data from across the Channel, the Nationwide index has shown a contraction of 0.2% MoM in July, while house prices have fallen by 3.8% over the last twelve months. Additionally, the S&P Global/CIPS Manufacturing PMI has decreased to 45.3 during the last month.
If the downtrend continues, GBP/USD might retest the weekly low of 1.2762 (July 28), prior to the short-term 55-day SMA at 1.2686, and the weekly low of 1.2590 (June 29). The 2021-2023 trend line is slightly below the 1.2500 yardstick, followed by the June low of 1.2368 (June 5) and the May low of 1.2308 (May 25), which appears propped up by the significant 200-day SMA (1.2298). On the contrary, the weekly high of 1.2995 (July 27) is preventing the 2023 high of 1.3142 (July 14) from being reached. Cable might then try to challenge the weekly highs of 1.3146 (April 14, 2022) and 1.3298 (March 23, 2022). The daily RSI deflated below the 47 area.
Resistance levels: 1.2888 1.2995 1.3125 (4H chart)
Support levels: 1.2791 1.2762 1.2750 (4H chart)
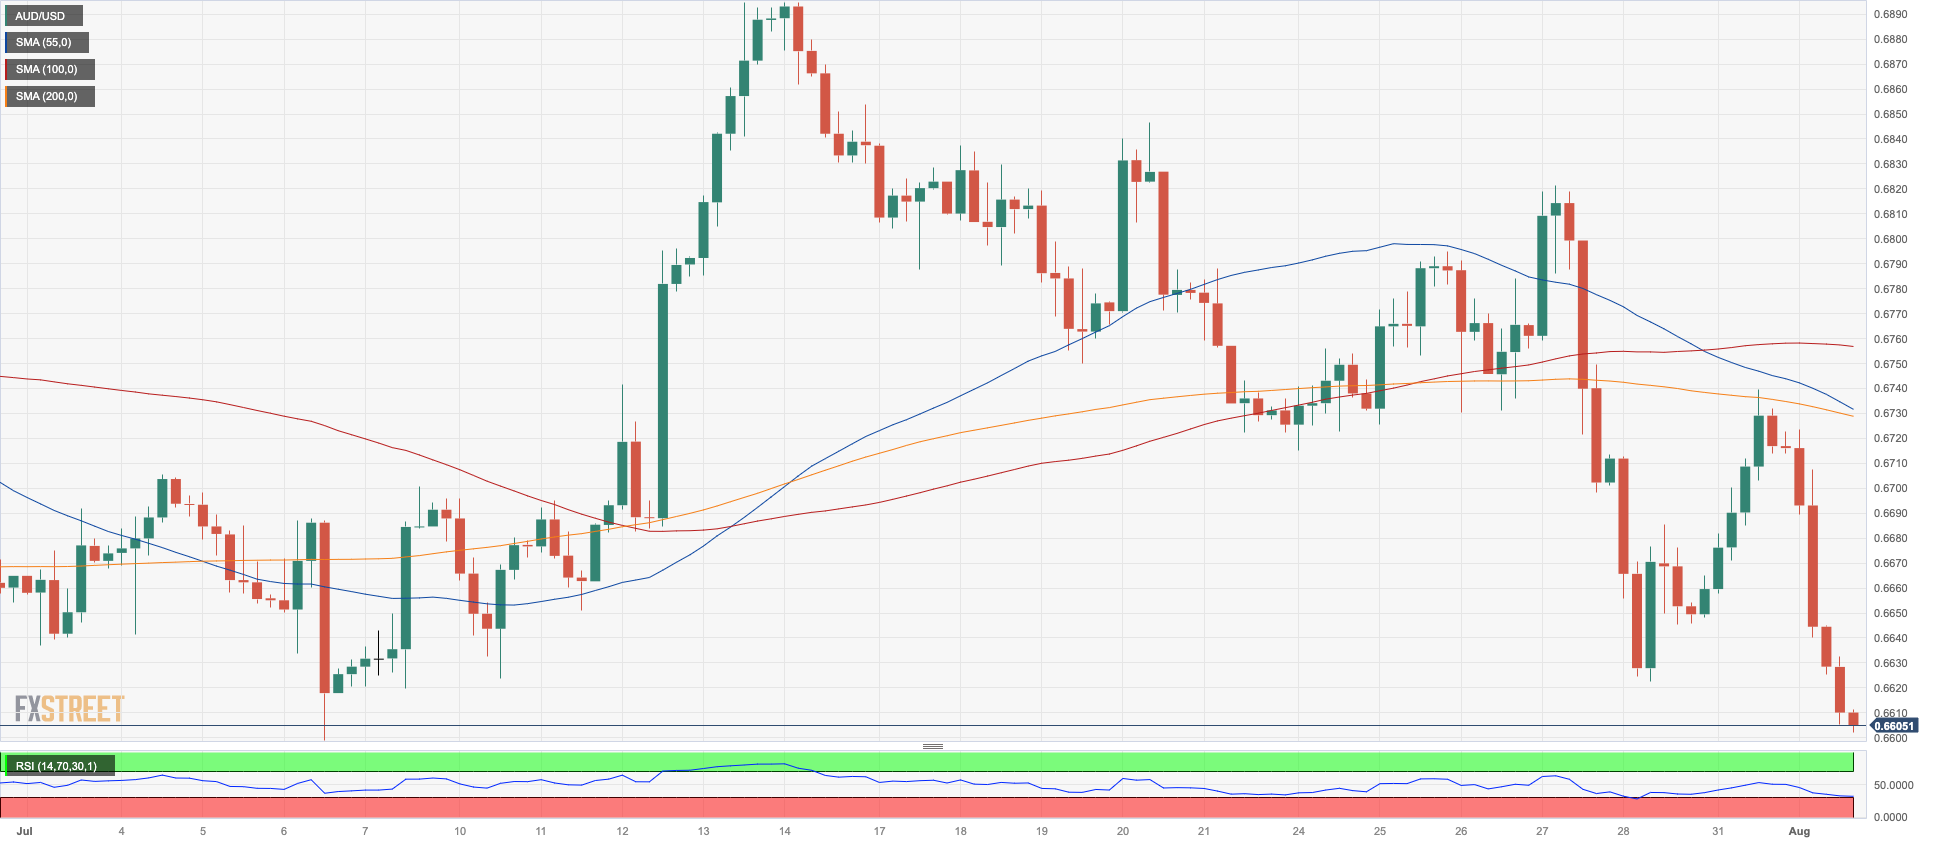
AUDUSD
AUD/USD resumed the downside in quite a noticeable fashion and retreated to four-week lows within the boundaries of 0.6600 the figure on Tuesday.
The continuation of the march north in the greenback coupled with the generalized bearish performance in the commodity complex and disheartening prints from the Chinese docket were all too much to cope with for the Aussie dollar.
In addition, the RBA left unchanged its OCR at 4.10% vs. expectations of a 25 bps rate hike. On this occasion, the central bank stated that there may be a need for further monetary policy tightening. The statement also mentioned that inflation is expected to return to the target range of 2–3% by late 2025 and added that the Australian economy is currently experiencing below-trend growth, and this is projected to continue for a while. The Board also expressed its expectation that inflation will reach 3.25% by the end of 2024. Additionally, the RBA commented that the pause in interest rates will allow for more time to assess the effects of previous rate hikes. Lastly, the bank noted that labour market conditions have shown slight improvement.
In the Australian docket, final results saw the Judo Bank Manufacturing PMI at 49.6 in July (from 48.2). In addition, flash Building Permits are expected to have contracted at a monthly 7.7% in June, while Home Loans shrank 2.8% MoM and Investment Lending for Homes rose 2.6%, all for the month of June.
Additional AUD/USD losses may find support initially at the weekly low of 0.6595 (June 29) before the 2023 low of 0.6458 (May 31). South of here, the November 2022 low of 0.6272 (November 3) will occur before the 2022 low of 0.6179 (October 13). Instead, immediate resistance is seen at the crucial 200-day SMA at 0.6730 ahead of the July high of 0.6894 (July 13) and the June top of 0.6899 (June 16). Breaking through this sector would open the door to a move to the psychological 0.7000 level before the weekly high of 0.7029 (February 14) and the 2023 peak of 0.7157 (February 2). The daily RSI weakened to the sub-42 area.
Resistance levels: 0.6739 0.6821 0.6846 (4H chart)
Support levels: 0.6605 0.6599 0.6579 (4H chart)
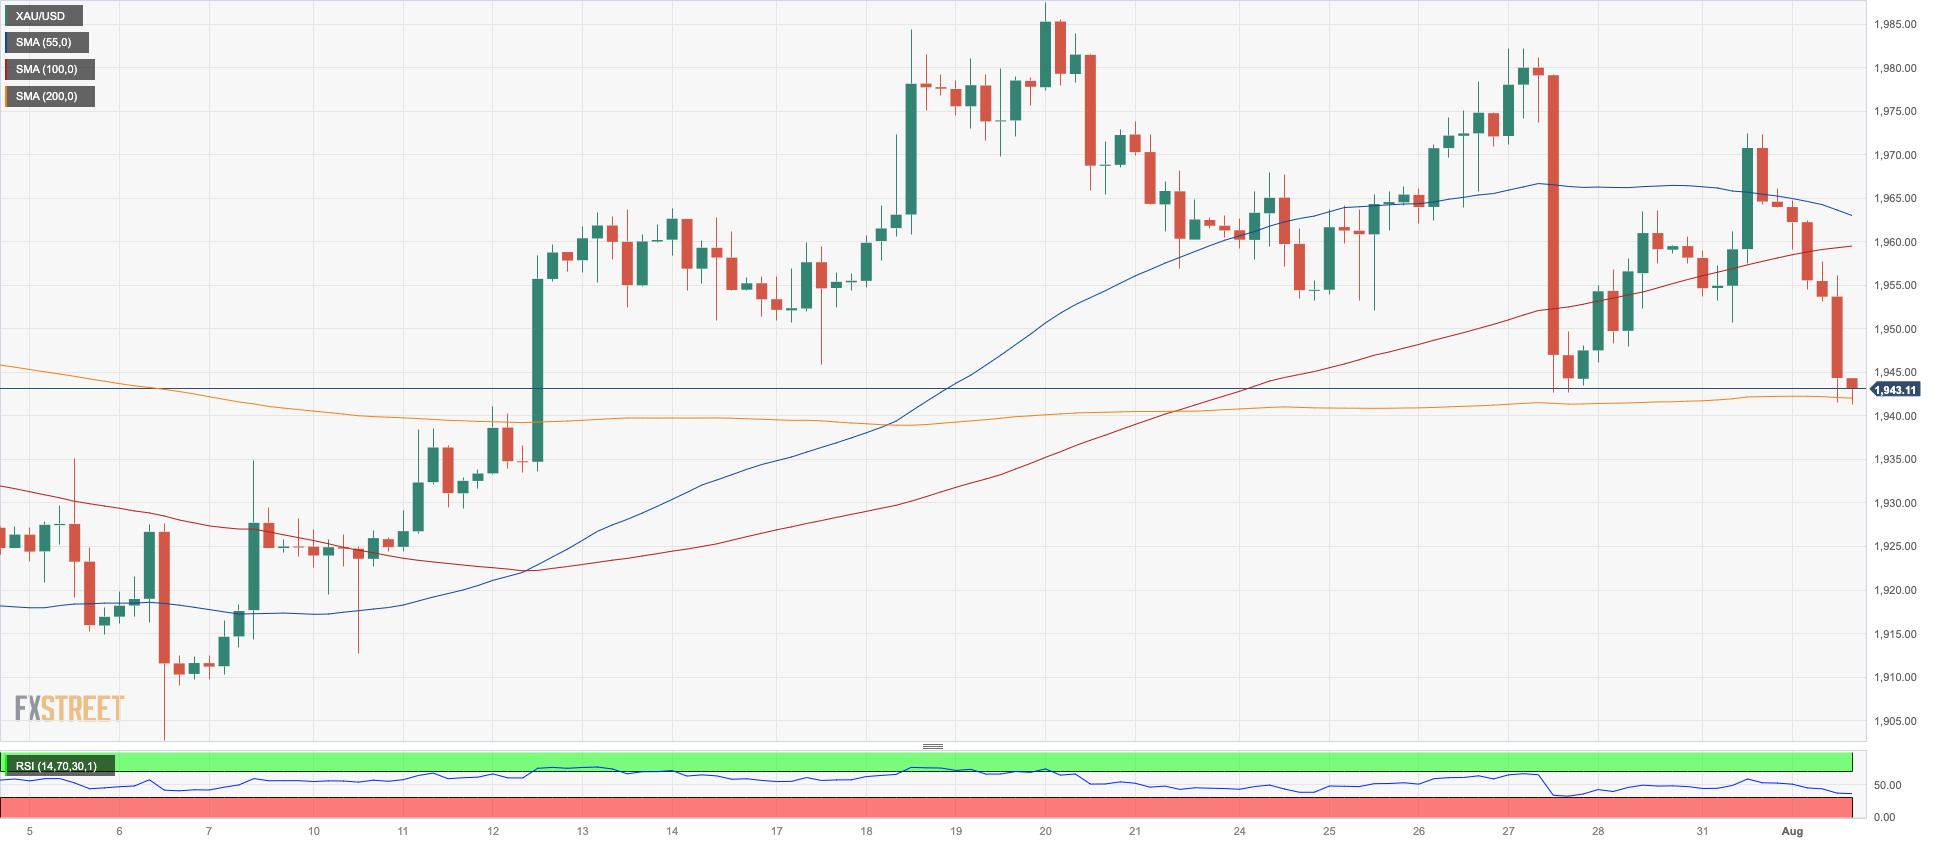
GOLD
The combination of a further increase in the value of the greenback and a significant rise in US bond yields across all maturity periods had a negative impact on the precious metal, leading to a corrective decline after two consecutive days of gains on Tuesday.
Notably, US bond yields recovered part of the previously lost ground and performed well in line with other global bond markets.
Adding to the decrease in gold prices, the latest report from the World Gold Council indicated that Q2 gold demand (excluding OTC) experienced a slight 2% year-on-year drop to 921 tonnes. This decline was primarily driven by a notable slowdown in net central bank purchases compared to the above-average buying in Q2 of the previous year.
Looking ahead, the next potential risk event for gold is the release of the US Nonfarm Payrolls data for July (on Friday). This and other key fundamental publications have become more important recently since the Federal Reserve has emphasized its data-dependent approach to making decisions on future interest rate adjustments.
Gold prices seem to have embarked on a consolidative phase so far. A drop below the weekly low of $1942 (July 27) may prompt the metal to test the round level of $1900 before falling to the June low of $1893 (June 29). Further falls would be hindered by the 200-day SMA at $1889, seconded by the 2023 low of $1804 (February 28) and the key support level of $1800. By contrast, extra gains might push gold prices back to the July high of $1987 (July 20). A break above this level might open the door to a move towards the crucial level of $2000, and beyond that, it could expose the path to the 2023 top of $2067 (May 4) and the 2022 peak of $2070 (March 1), all before the all-time high of $2075 (August 7, 2020). If
Resistance levels: $1972 $1987 $2022 (4H chart)
Support levels: $1942 $1912 $1893 (4H chart)
CRUDE WTI
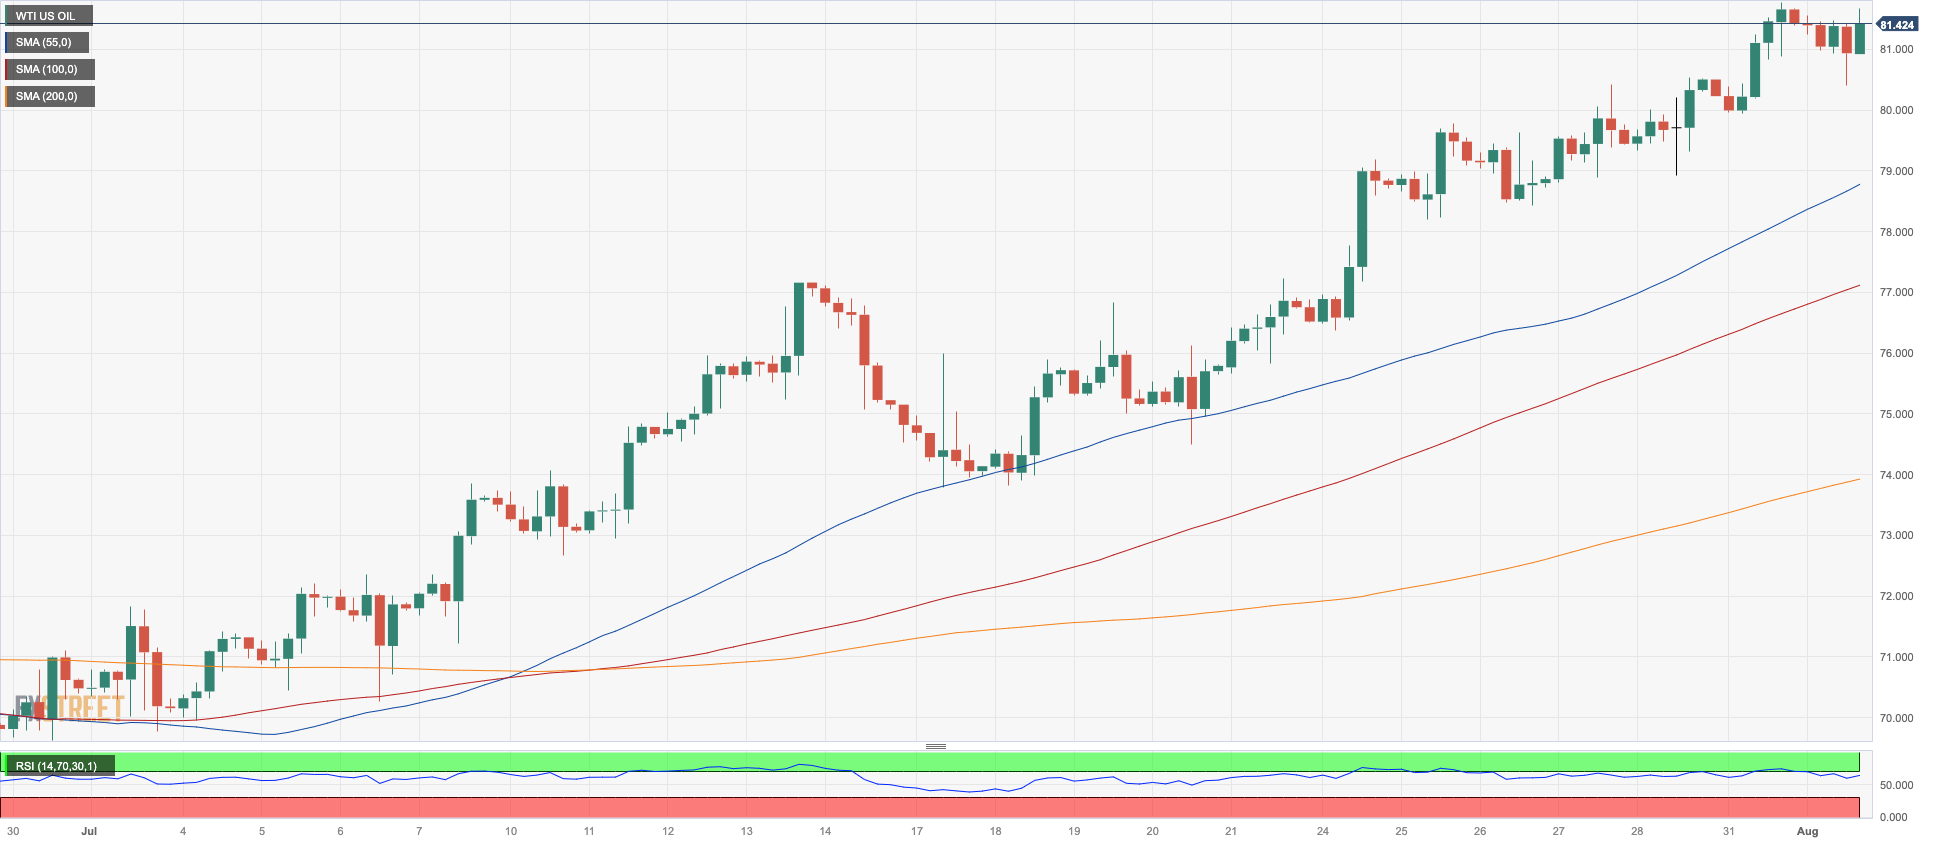
After climbing for three straight sessions, WTI prices pulled back slightly on Tuesday.
The commodity relinquished some of the recent gains after hitting peaks near $82 per barrel at the week's start. Furthermore, Tuesday's knee-jerk came as the surging greenback and profit-taking activity weighed on prices.
However, the tight supply situation in global oil markets and expectations of rising Chinese demand in the second half of the year appear to be limiting significant downside for now.
Later on, the American Petroleum Institute (API) will publish its report on US crude stockpiles for the week ending July 28.
If WTI prices rise over the July high of $81.96 (July 31), they may aim for the $83.49 peak in 2023 (April 12) and the $93.73 high in November 2022 (November 7). Support, on the other side, may initially develop around the 200-day SMA at $76.60, followed by the weekly low of $73.89 and the 100-day and 55-day SMAs, respectively, at $73.67 and $72.91. If WTI goes below the latter, the June low of $66.86 (June 12) and the 2023 low of $63.61 (May 4) may become significant. Below there, the December 2021 bottom of $62.46 (December 2) may give support before reaching the key round level of $60.
Resistance levels: $81.96 $83.08 $83.49 (4H chart)
Support levels: $79.04 $78.25 $74.47 (4H chart)
GER40
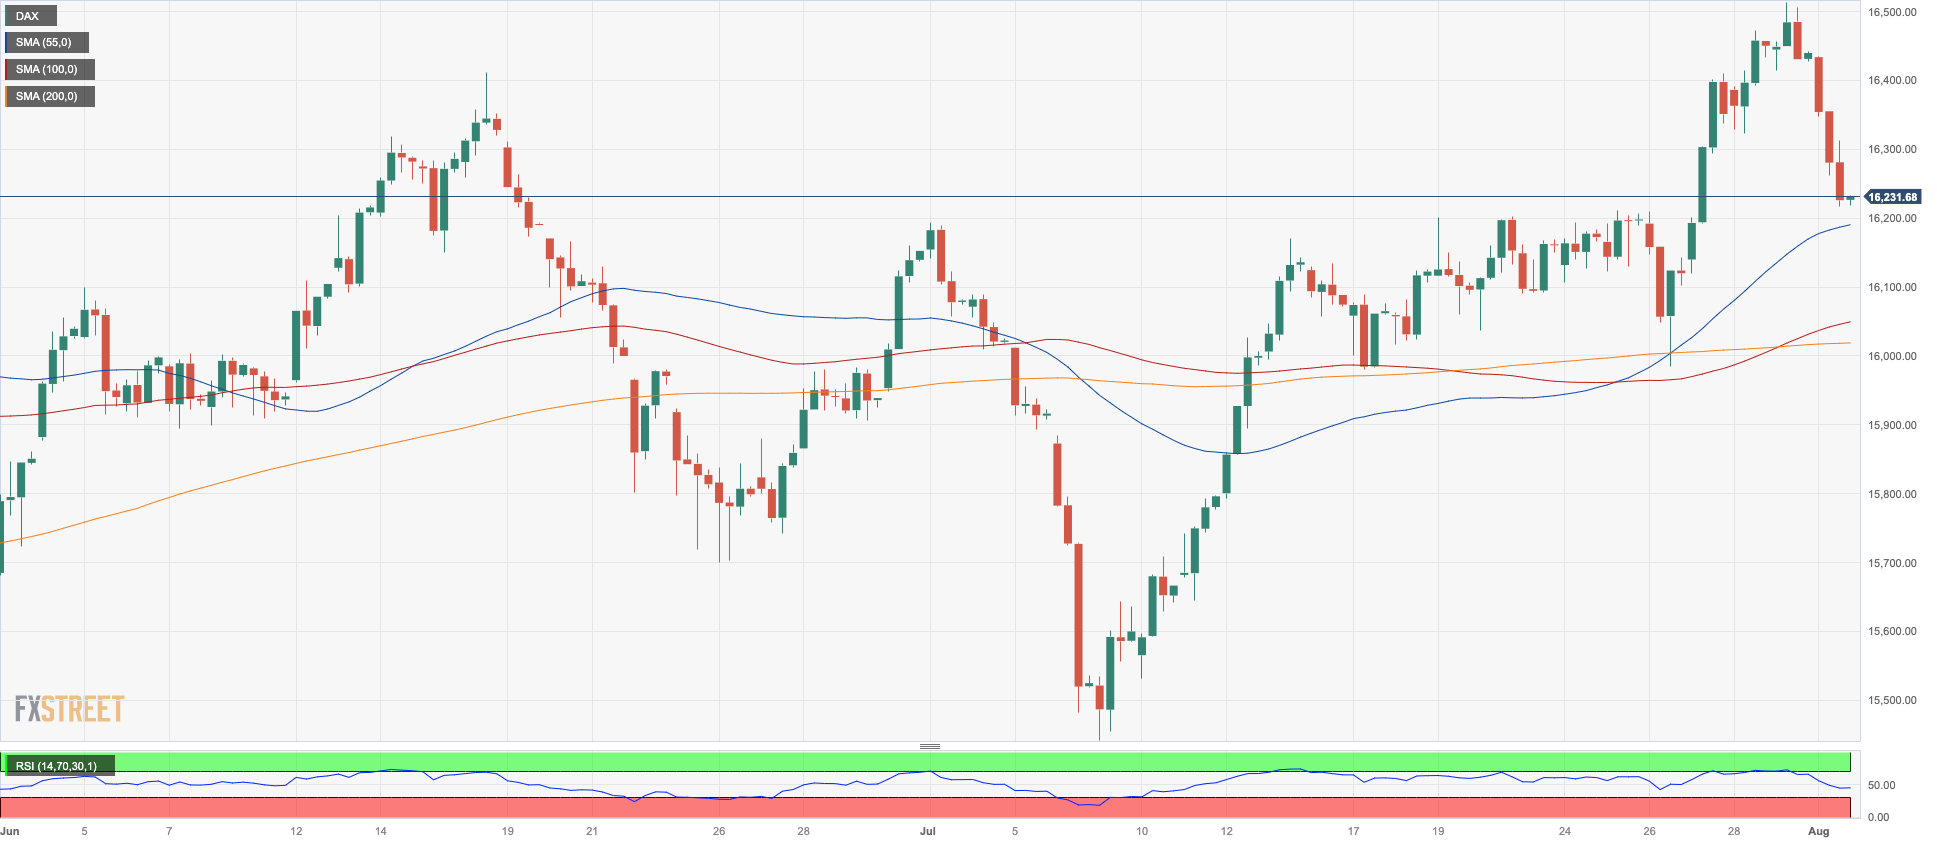
Germany’s benchmark DAX40 came under a strong selling pressure just a day after it clinched a new all-time high above the 16500 level.
In fact, the DAX40 was no exception in the generalized negative start of the new month on Tuesday. Indeed, shares traded well on the defensive in response to poor prints from the manufacturing gauges in the euro area, which reignited concerns that a recession might be in the offing in the old continent.
The marked pullback in the index came in contrast to the rebound in the 10-year bund yields to two-day highs near 2.55%.
Immediately to the upside for DAX40 appears the record high of 16528 (July 31). On the other hand, the weekly low at 16000 (July 26) remains propped up by the transitory 55-day SMA (16045) and comes ahead of the provisional 100-day SMA at 1583. Down from here emerges the July low of 15456 (July 7) seconded by the key 200-day SMA at 15195. The breach of this region exposes a move to the March low of 14458 (March 20) before the December 2022 low of 13791 (December 20). The daily RSI sank to the sub-55 area.
Best Performers: Rheinmetall AG, MTU Aero, Heidelbergcement
Worst Performers: BMW ST, Deutsche Post, Zalando SE
Resistance levels: 16528 17000? (4H chart)
Support levels: 16240 16000 15456 (4H chart)
NASDAQ
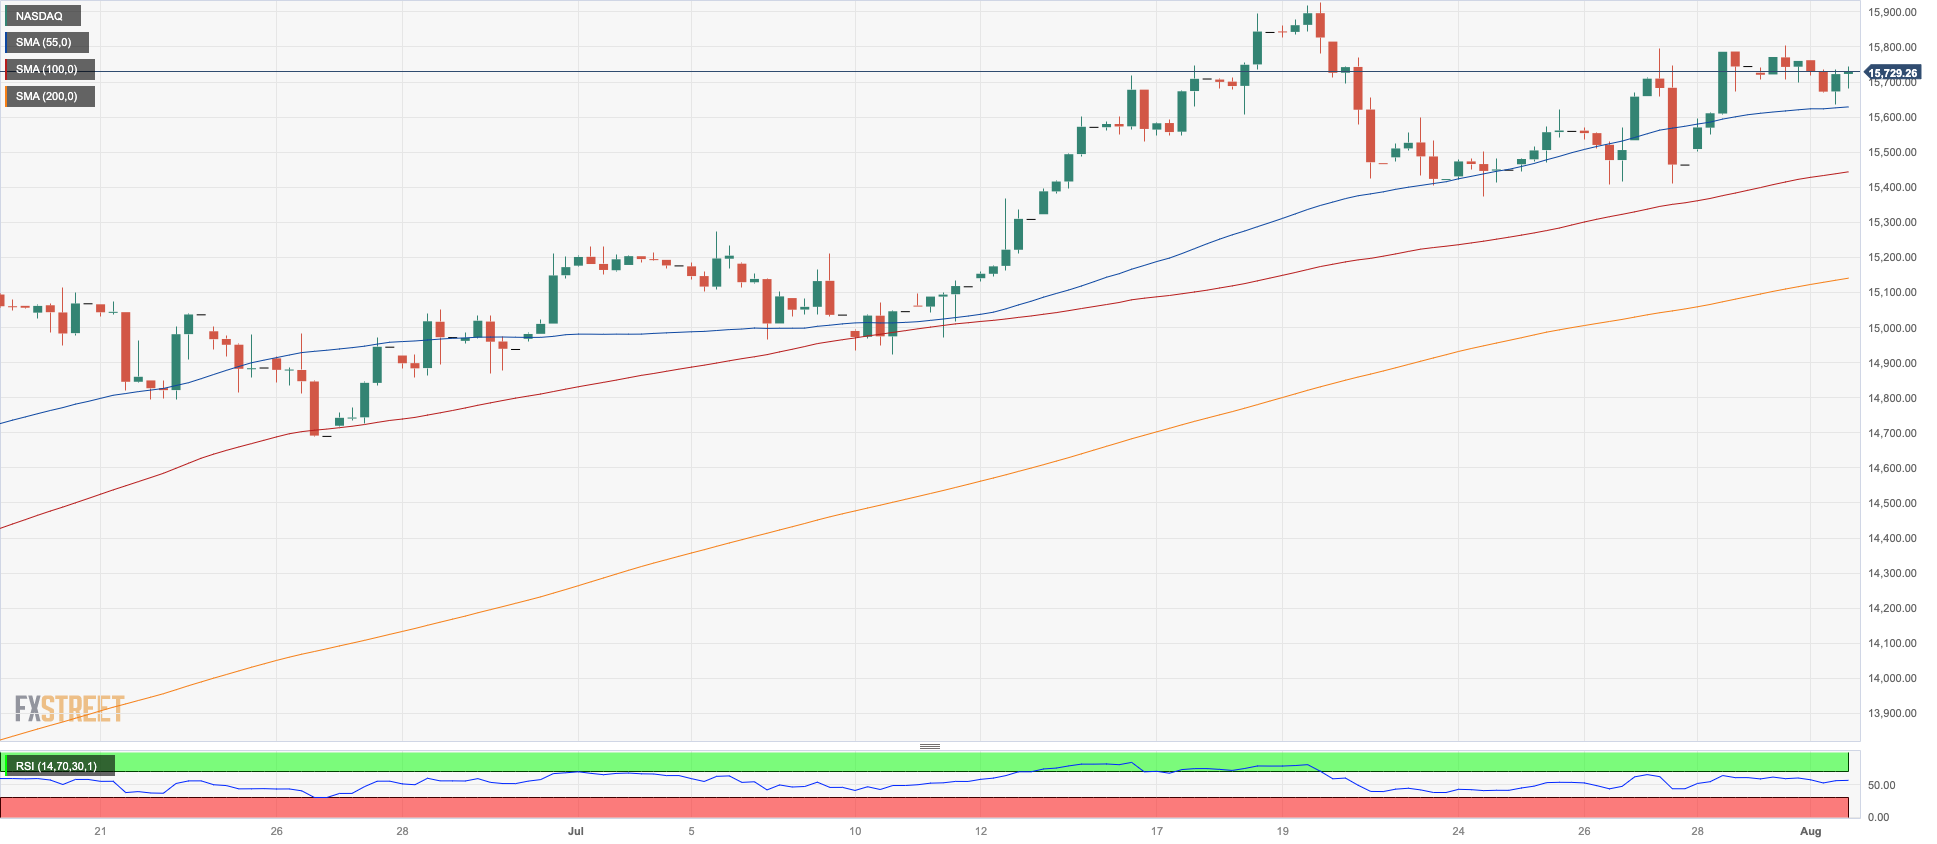
Tech equities, as measured by the Nasdaq 100 index, posted modest losses on Tuesday, erasing Monday’s modest gains and exposing some potential tough resistance zone around the 15700 level.
The sharp rise in the dollar, coupled with the unexpected rebound in US yields, especially at belly and the long end of the curve, weighed on prices and dampened investor sentiment along with some disappointing news from earnings reports.
From its 2023 top of 15932 (July 19), the Nasdaq 100 faces an immediate upward journey, which is swiftly followed by the round 16000 milestone. In contrast, the weekly low of 15374 (July 24) takes precedence over the July low of 14924 (July 10). Further south, the weekly lows of 14687 (June 26) and 14283 (June 7) are aligned. A breach of this area might lead to a decline to the weekly low of 13520 (May 24), which is previous to the May low of 12938 (May 4) and the April low of 12724 (April 25), which appears to be supported by the proximity of the key 200-day SMA. A further loss might reintroduce the March low of 11695 (March 13) into play.
Top Gainers: AMD, Crowdstrike Holdings, Charter Communications
Top Losers: Lucid Group, IDEXX Labs, JD.com Inc Adr
Resistance levels: 15795 15932 16017 (4H chart)
Support levels: 15374 14924 14687 (4H chart)
DOW JONES
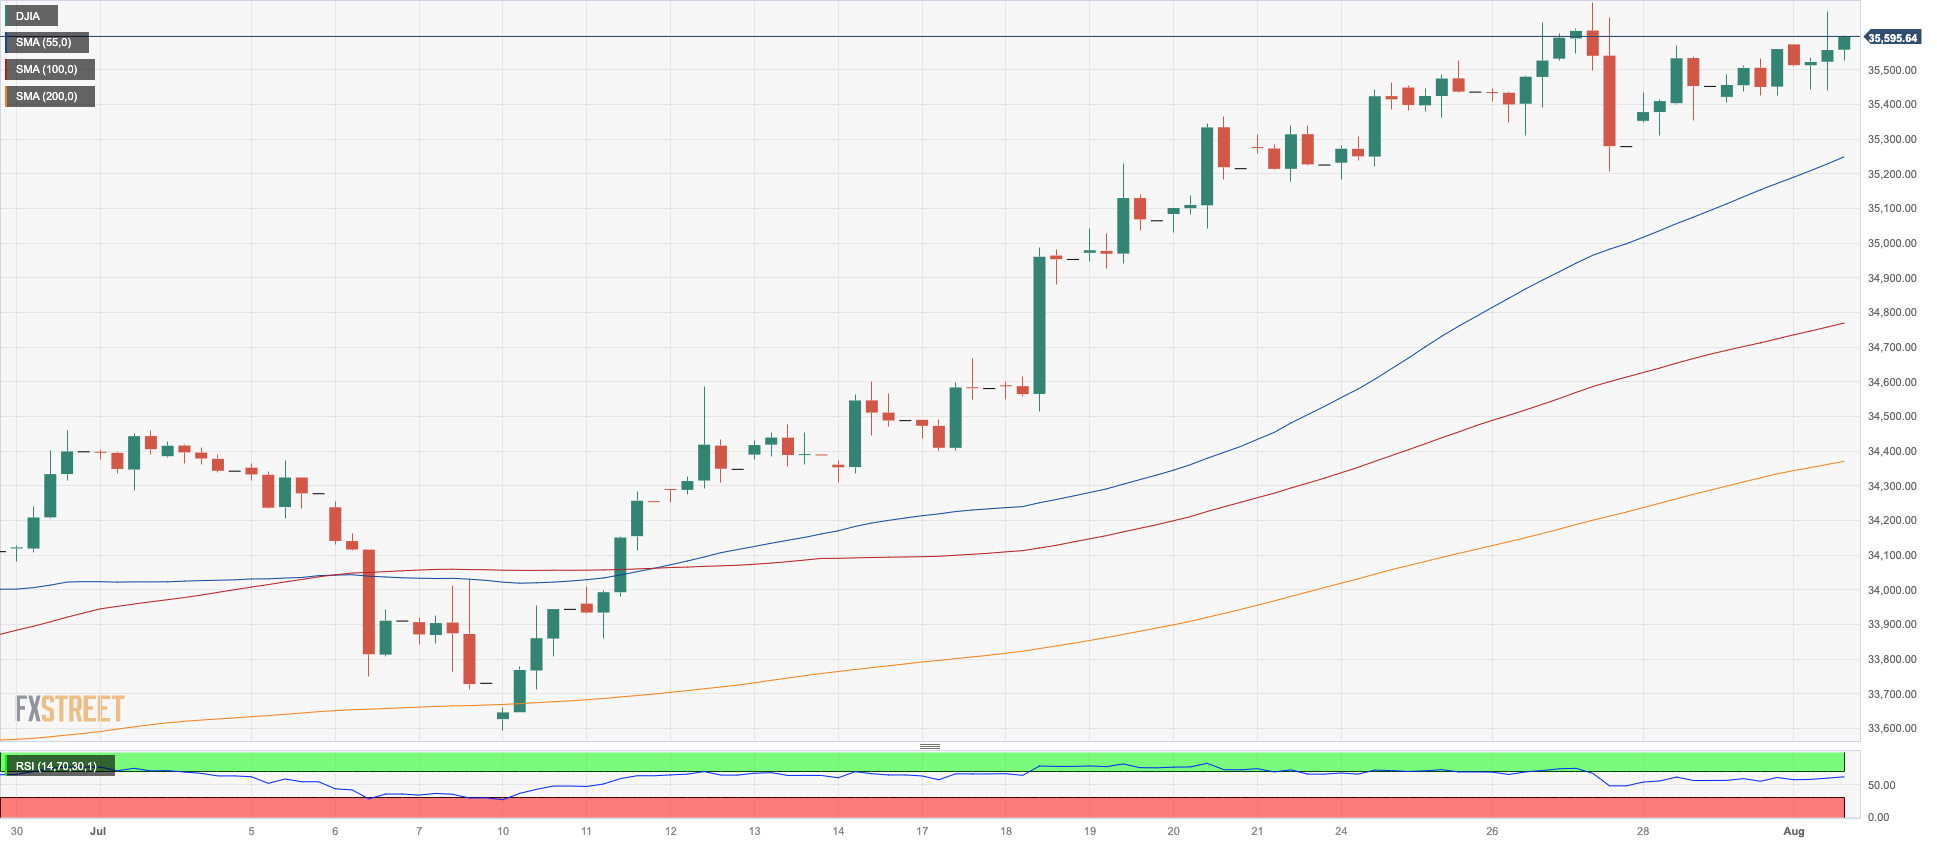
US stocks, as measured by the Dow Jones, reached a new high for 2023, coming just above of the 35700 mark on Tuesday.
The surge, however, occurred amidst a somewhat inconclusive price action in the index. This uncertainty was influenced by investors' assessment of some disappointing corporate earnings reports and a discouraging figure from the key ISM Manufacturing PMI, which expanded less than the initial estimates suggested.
All in all, the Dow Jones advanced 0.05% to 35576, the S&P500 deflated 0.28% to 4576, and the tech-heavy Nasdaq Composite dropped 0.38% to 14291.
The Dow Jones is currently encountering a significant resistance near its 2023 high of 35679 (August 1). If the index can break through this barrier, it may hit the February 2022 peak of 35824 (February 9) before reaching its all-time high of 36952 (January 5, 2022). Just the opposite, the index is not expected to reach the first support level until it reaches the intermediate 55-day SMA at 34074. From here, the July low of 33705 (July 10) emerges as the next contention level prior to the transitory 100-day SMA at 33659. A deeper drop could see the 200-day SMA at 33432 revisited ahead of the May low of 32586 (May 25), and the 2023 low of 31429 (March 15). The daily RSI remained in the overbought territory north of 71.
Top Performers: Caterpillar, Cisco, Microsoft
Worst Performers: Verizon, Chevron, Amgen
Resistance levels: 35679 35824 36513 (4H chart)
Support levels: 35216 34612 33705 (4H chart)
MACROECONOMIC EVENTS

All Information & Updates provided by:

All information relating to the financial markets available on this page has been prepared and issued by FXStreet (Forexstreet SL, Spain, Reg: B62498233) on the basis of publicly available information and all information believed to be reliable and does not conflict with Kuwaiti local laws, and all necessary care has been taken to before the company to ensure that the facts mentioned are correct from the source.
NCM Investment nor any of its directors or employees shall in any way be held responsible for the contents of this news, and the information contained on this page is intended only to provide clients with publicly available information and should not be construed as investment advice, report or analysis and/or constitute an offer or invitation to buy or sell financial instruments of any kind.
RISK WARNING: Forex and CFDs are highly risky leveraged products, as losses can exceed deposits. Please ensure you understand all the risks and take independent advice if necessary. NCM will segregate the clients based on the criteria of the regulator and its bylaws. NCM does not provide any advisory service; the material published does not constitute advice or a recommendation for a transaction in any financial instrument. NCM accepts no responsibility for any use of the content presented and any consequences of that use. Anyone acting on the information provided does so at their own risk.