
- Contact Us:
-

-

-

-


Daily Market Updates
03 Aug 2023
USDJPY
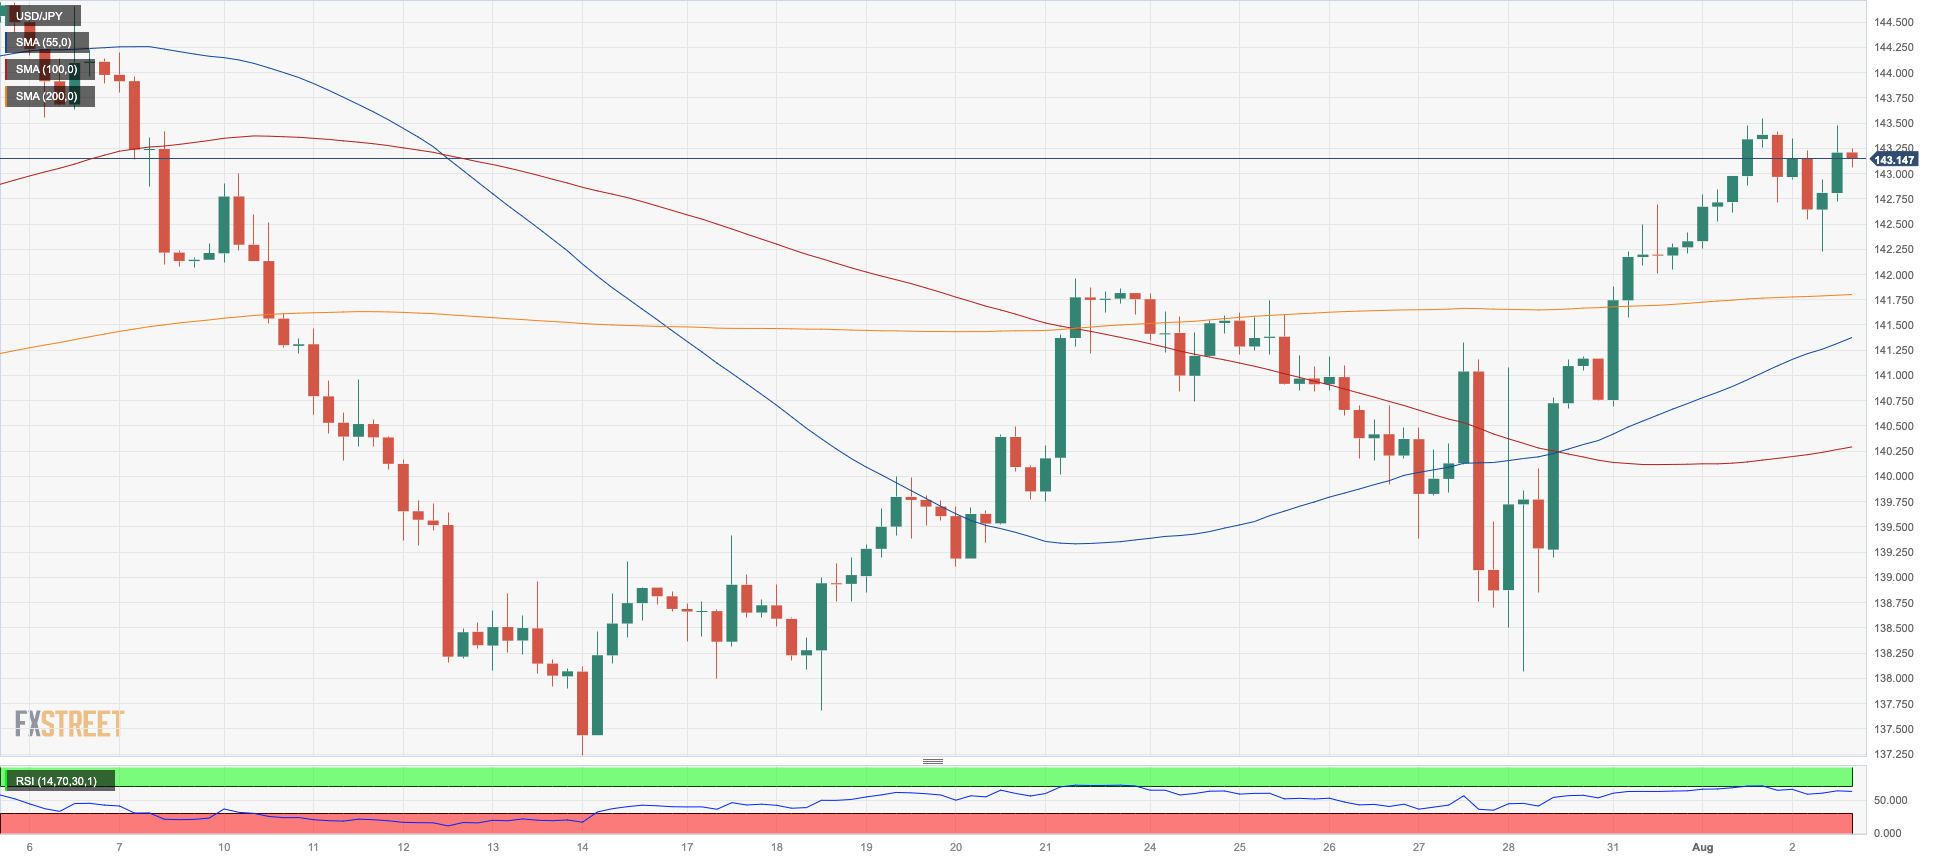
USD/JPY came under renewed downside pressure and revisited the 142.20 area on Wednesday, where it managed to meet decent support and stage quite a noticeable rebound afterwards.
Indeed, the strong rebound in US yields and the relentless move higher in the greenback also helped the pair to trim those early losses.
In the Japanese bond market, the JGB 10-year yields climbed to the boundaries of the 0.64% level, boosted by the comments from BoJ’s Uchida.
On the latter, Uchida mentioned that if economic and price conditions remain stable, there is no anticipation of a significant surge in interest rates. He further added that the BoJ will persist in regulating both short and long-term interest rates, although the specific approach may be subject to adjustments. Uchida stated that the BoJ will intervene pre-emptively before the 10-year yield reaches 1%, contingent on the pace of market developments.
From the domestic docket, and according to the BoJ Minutes, it was reported that members had a shared view that there was no immediate need to make any operational adjustments to yield curve control (YCC). A few members expressed concern that a premature policy shift could potentially result in the BoJ losing the opportunity to achieve its price target. Additionally, many members believed that it was appropriate to continue with monetary easing in order to support the changes observed in corporate wage and price-setting behaviour.
Further upside in USD/JPY is not likely to meet significant resistance until the weekly/monthly high of 143.54 (August 1), ahead of the 2023 top of 145.07 (June 30) and the 2022 high of 151.94 (October 21). On the downside, the weekly low of 138.05 (July 28) is just ahead of the July low of 137.23 (July 14) and the crucial 200-day SMA of 136.60. A drop below the latter exposes the weekly low of 133.01 (April 26), seconded by a weak support of 132.01 (April 13) and the round mark of 130.00. On the daily chart, the RSI dropped slightly below 60.
Resistance levels: 143.54 144.65 145.07 (4H chart)
Support levels: 142.22 141.78 140.36 (4H chart)
GBPUSD
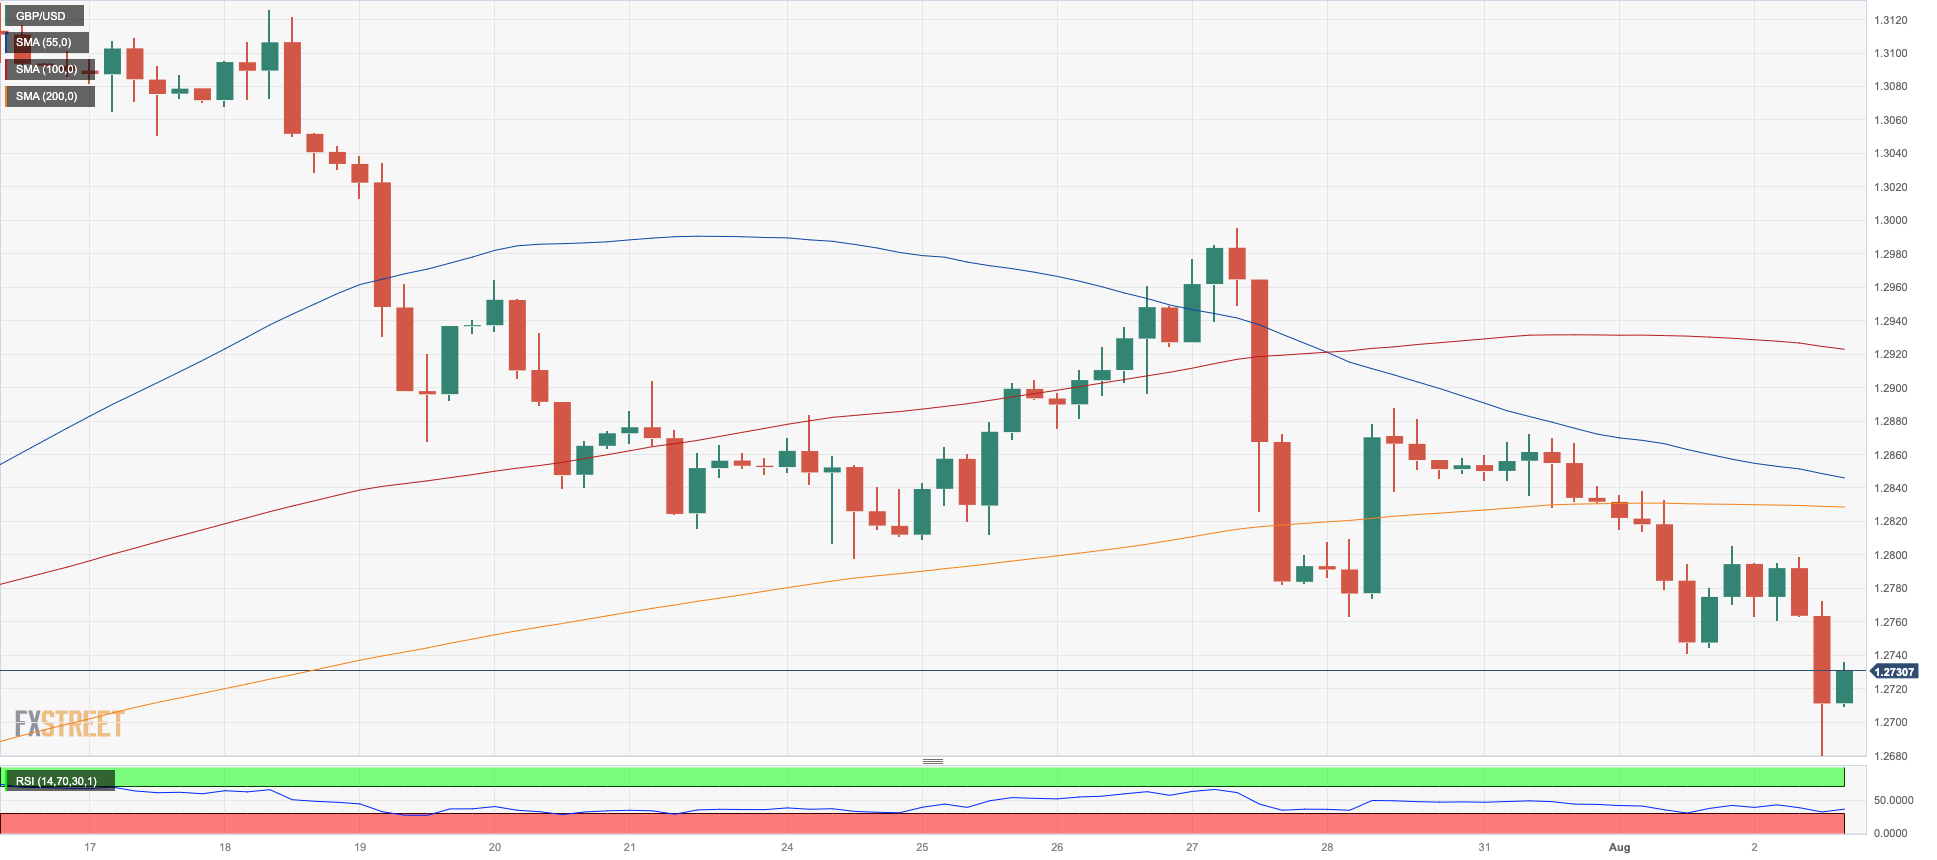
The greenback continued to gain ground, keeping risk assets on the back foot and triggering fresh losses for GBP/USD, which dipped to sub-1.2700 levels for the first time since early July on Wednesday.
Indeed, the British pound remained under pressure in the face of the dollar's relentless uptrend. Meanwhile, caution ahead of the BoE policy meeting on Thursday also contributed towards subduing the quid’s price action in the midweek session.
Market expectations are largely tilted towards a 25 bps interest rate hike by the BoE at its meeting on Thursday, while predictions point to 25 bps increases in September and November, with around a 50% probability of one final 25 bps rise in the first quarter of next year.
The UK economic calendar was empty on Wednesday.
If the downtrend continues, GBP/USD may retest the weekly/monthly low of 1.2741 (August 1), which is just above the provisional 55-day SMA at 1.2691 and followed by the weekly low of 1.2590 (June 29). The 2021-2023 trend line is around the 1.2490 region ahead of the June low of 1.2368 (June 5) and the May low of 1.2308 (May 25), which looks to be supported by the key 200-day SMA (1.2304). On the contrary, the weekly high of 1.2995 (July 27) is preventing the 2023 high of 1.3142 (July 14) from being achieved. Cable might then attempt to break the weekly highs of 1.3146 (April 14, 2022) followed by 1.3298 (March 23, 2022). The daily RSI retreated to the area below 44.
Resistance levels: 1.2827 1.2888 1.2995 (4H chart)
Support levels: 1.2679 1.2591 1.2368 (4H chart)
AUDUSD
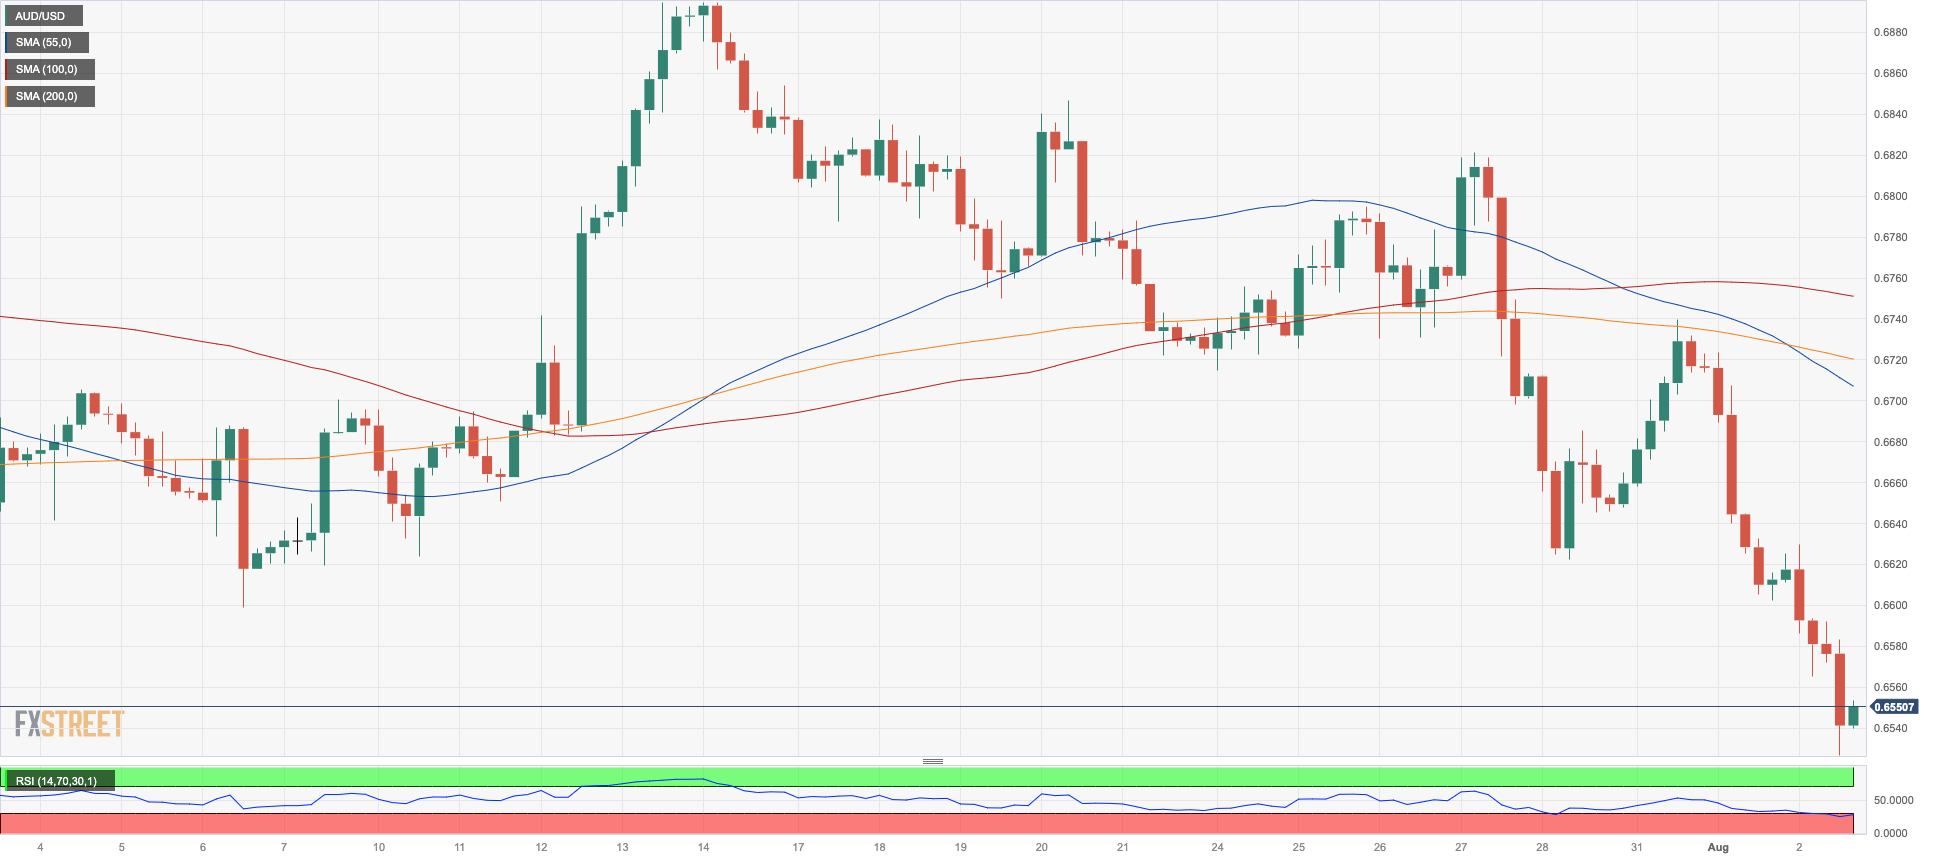
AUD/USD maintained its downward trend and fell for the second consecutive day, reaching new two-month lows near 0.6560 on Wednesday. This decline came as investors continued to react to the RBA’s decision to keep interest rates unchanged on Tuesday, while the dollar’s strength also put pressure on the Australian currency.
The strong upward trend in the greenback had a ripple effect on other currencies, causing high-beta currencies and risk-associated assets to experience a decline. As a result, the Aussie dollar weakened to levels not seen since early June.
In terms of economic data from Australia, the Ai Group Industry Index and the Ai Group Manufacturing Index both showed declines in July, with the former falling to -14.7 and the latter dropping to -25.6.
Additional AUD/USD weakness is now expected to meet the next support at the 2023 low of 0.6458 (May 31). Below this level emerges the November 2022 low of 0.6272 (November 3) prior to the 2022 low of 0.6179 (October 13). Instead, immediate resistance is indicated at the pivotal 200-day SMA of 0.6730 before the July high of 0.6894 (July 13), which appears closely followed by the June top of 0.6899 (June 16). Breaking through this sector would allow for a move to the crucial 0.7000 level ahead of the weekly high of 0.7029 (February 14) and the 2023 top of 0.7157 (February 2). The daily RSI deflated below the 37 yardstick.
Resistance levels: 0.6739 0.6821 0.6846 (4H chart)
Support levels: 0.6526 0.6458 0.6386 (4H chart)
GOLD
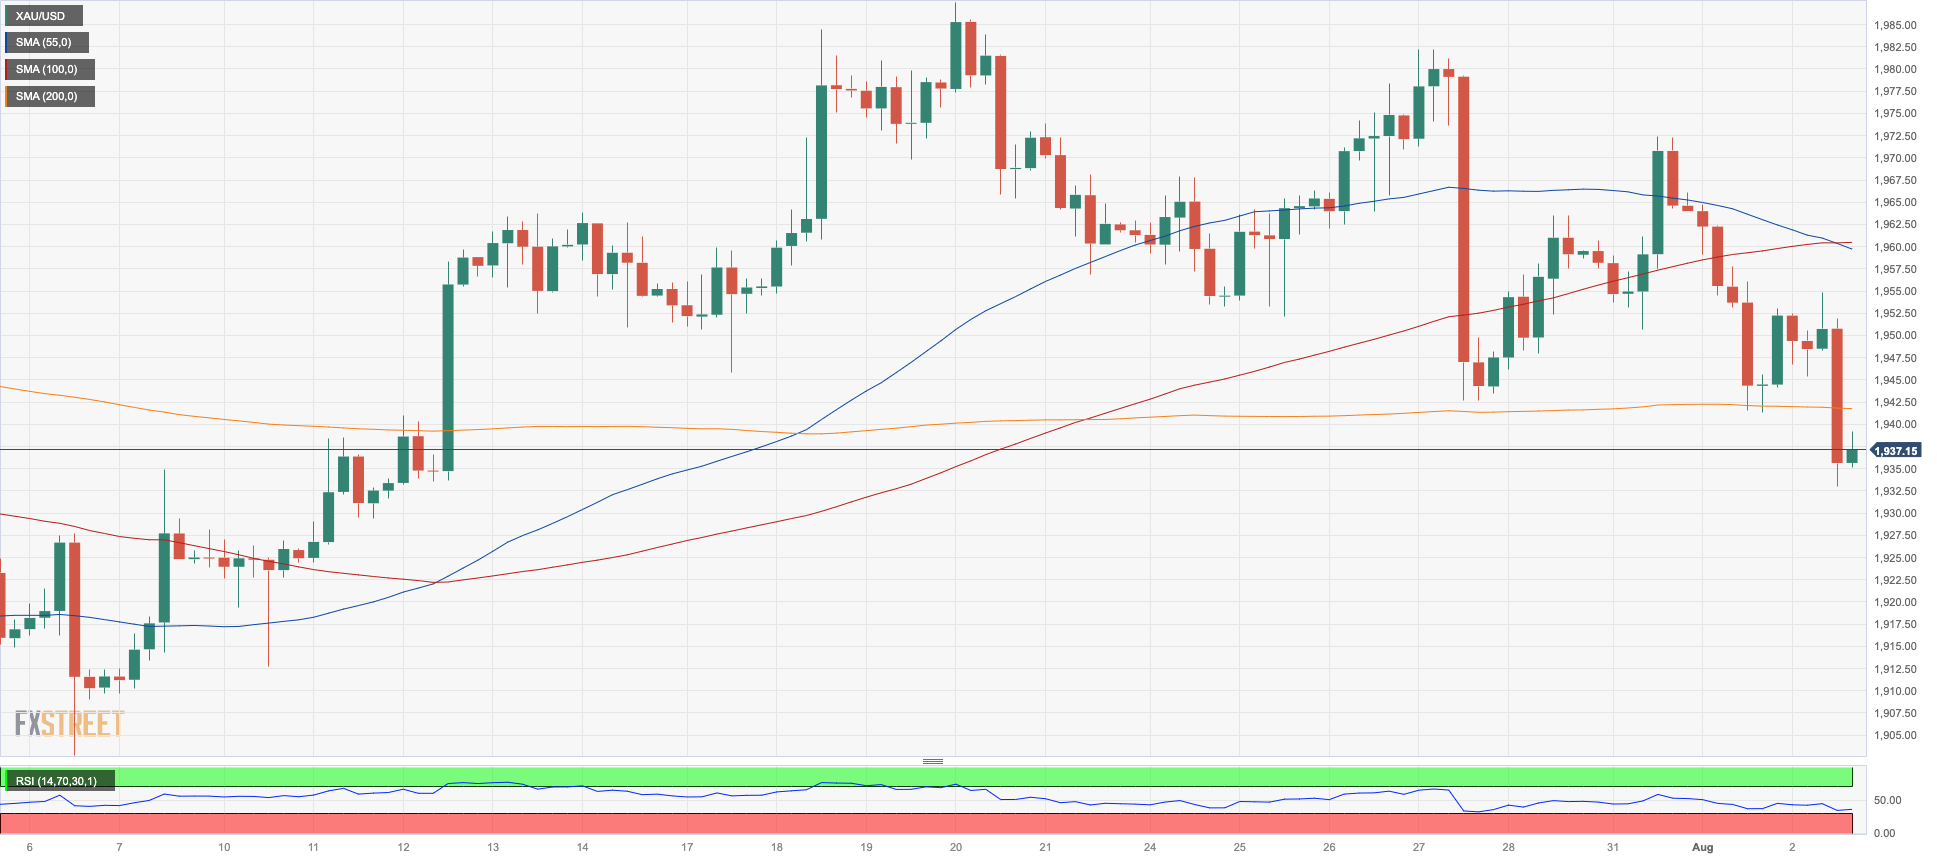
The pronounced rebound in the greenback in combination with the equally robust performance of US yields put the precious metal under heightened pressure on Wednesday.
Indeed, the USD Index (DXY) extended its march north to new four-week highs near 102.80, while US yields in the belly and the long end of the curve climbed to levels last seen in November 2022 around 4.10% and 4.20%, respectively.
That said, bullion broke below the lower end of the recent range around $1940 per troy ounce, and in doing so, it could have opened the door to a deeper pullback on the short-term horizon.
Further downside now needs to clear the weekly low of $1933 (August 2), which precedes the round level of $1900 and the June low of $1893 (June 29). Further declines would be hampered by the 200-day SMA at $1890, followed by the 2023 low of $1804 (February 28) and the critical support level of $1800. The resumption of the bullish trend, on the other hand, might bring gold prices back to the July high of $1987 (July 20). A break above this level might pave the way for a move towards the critical level of $2000, and above that, it could reveal the road to the 2023 peak of $2067 (May 4) followed by the 2022 peak of $2070 (March 8) and the all-time top at $2075 (August 7 2020).
Resistance levels: $1972 $1987 $2022 (4H chart)
Support levels: $1933 $1912 $1893 (4H chart)
CRUDE WTI
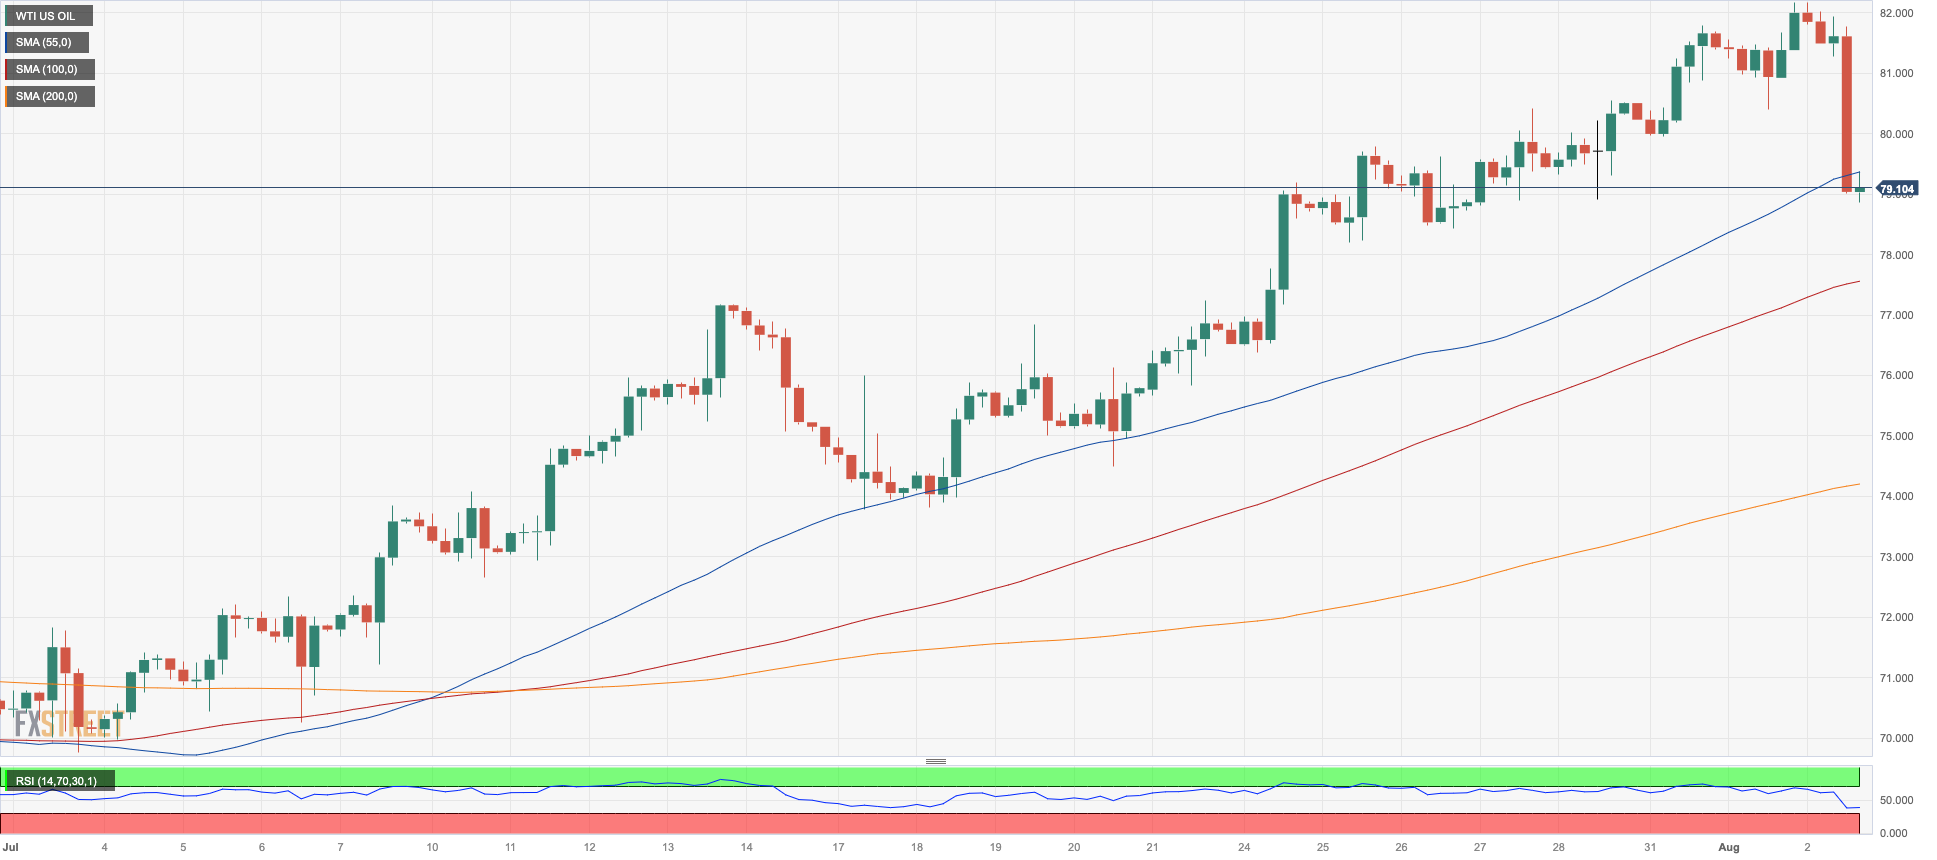
Following the earlier uptick to a new four-month top near $82.40, prices of the barrel of WTI sparked a sharp correction lower to the vicinity of the $79.00 region on Wednesday.
In fact, the acute drop in crude oil prices seems to have come in tandem with investors’ rising concerns following the downgrade of the US sovereign rating by credit agency Fitch.
Those fears prevented the commodity from benefiting from the record drop in US crude oil inventories, as reported by the EIA on Wednesday. On this, the DoE reported that US crude oil inventories shrank by a staggering 17.049M barrels in the week to July 28, while supplies at Cushing went down by 1.259M barrels, Weekly Distillate Stocks dropped by 0.796M barrels, and gasoline stockpiles unexpectedly increased by 1.480M barrels.
If WTI prices soar over the July high of $82.39 (August 2), they might target the 2023 top of $83.49 (April 12) ahead of the November 2022 peak of $93.73 (November 7). Support, on the other hand, might form around the 200-day SMA at $76.57, seconded by the weekly low of $73.89 and the 100-day and 55-day SMAs at $73.72 and $73.04, respectively. If WTI falls below this level, the June low of $66.86 (June 12) and the 2023 low of $63.61 (May 4) may become important. Below there, the December 2021 bottom of $62.46 (December 2) may provide support before the critical round level of $60 is reached.
Resistance levels: $82.39 $83.08 $83.49 (4H chart)
Support levels: $79.10 $77.53 $74.47 (4H chart)
GER40
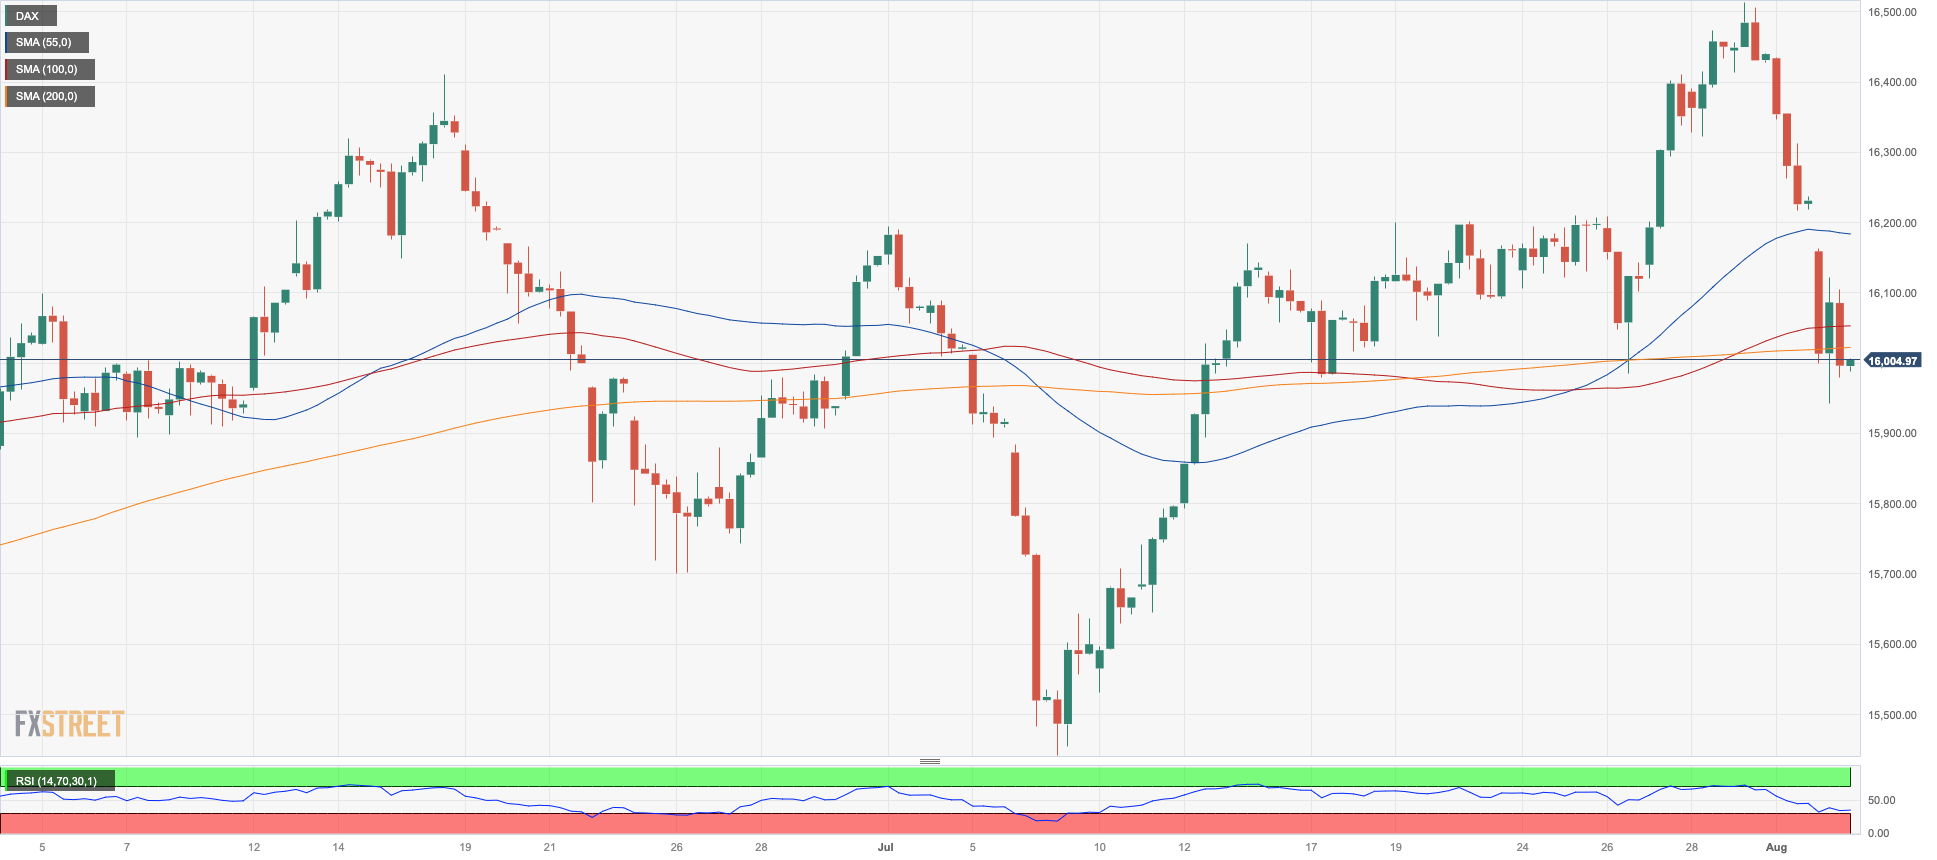
Stocks tracked by Germany’s reference DAX40 intensified their weekly corrective move and dropped to new three-week lows in the 15900 region on Wednesday, just to bounce later and close above the 16000 yardstick.
The downtick in the German benchmark fell in line with the generalized sour mood in markets on the old continent and was almost exclusively driven by investors’ exodus from riskier assets in response to Fitch’s downgrade of the US credit rating.
The move lower in stocks followed the daily retracement in 10-year bund yields, which revisited the 2.50% region.
The record high of 16528 (July 31) emerges immediately to the upside for the DAX40. By contrast, the weekly low at 15955 (August 2) turns up as immediate contention prior to the transitory 100-day SMA at 15837. Down from here, the July low of 15456 (July 7) appears, followed by the crucial 200-day SMA at 15211. If this zone is breached, a move to the March low of 14458 (March 20) is possible before the December 2022 low of 13791 (December 20). The daily RSI weakened further to the 46 zone.
Best Performers: Siemens Energy AG, Dr Ing hc F Porsche Pfd, Rheinmetall AG
Worst Performers: Siemens Healthineers, Symrise AG, Zalando SE
Resistance levels: 16528 17000? (4H chart)
Support levels: 15955 15456 14809 (4H chart)
NASDAQ
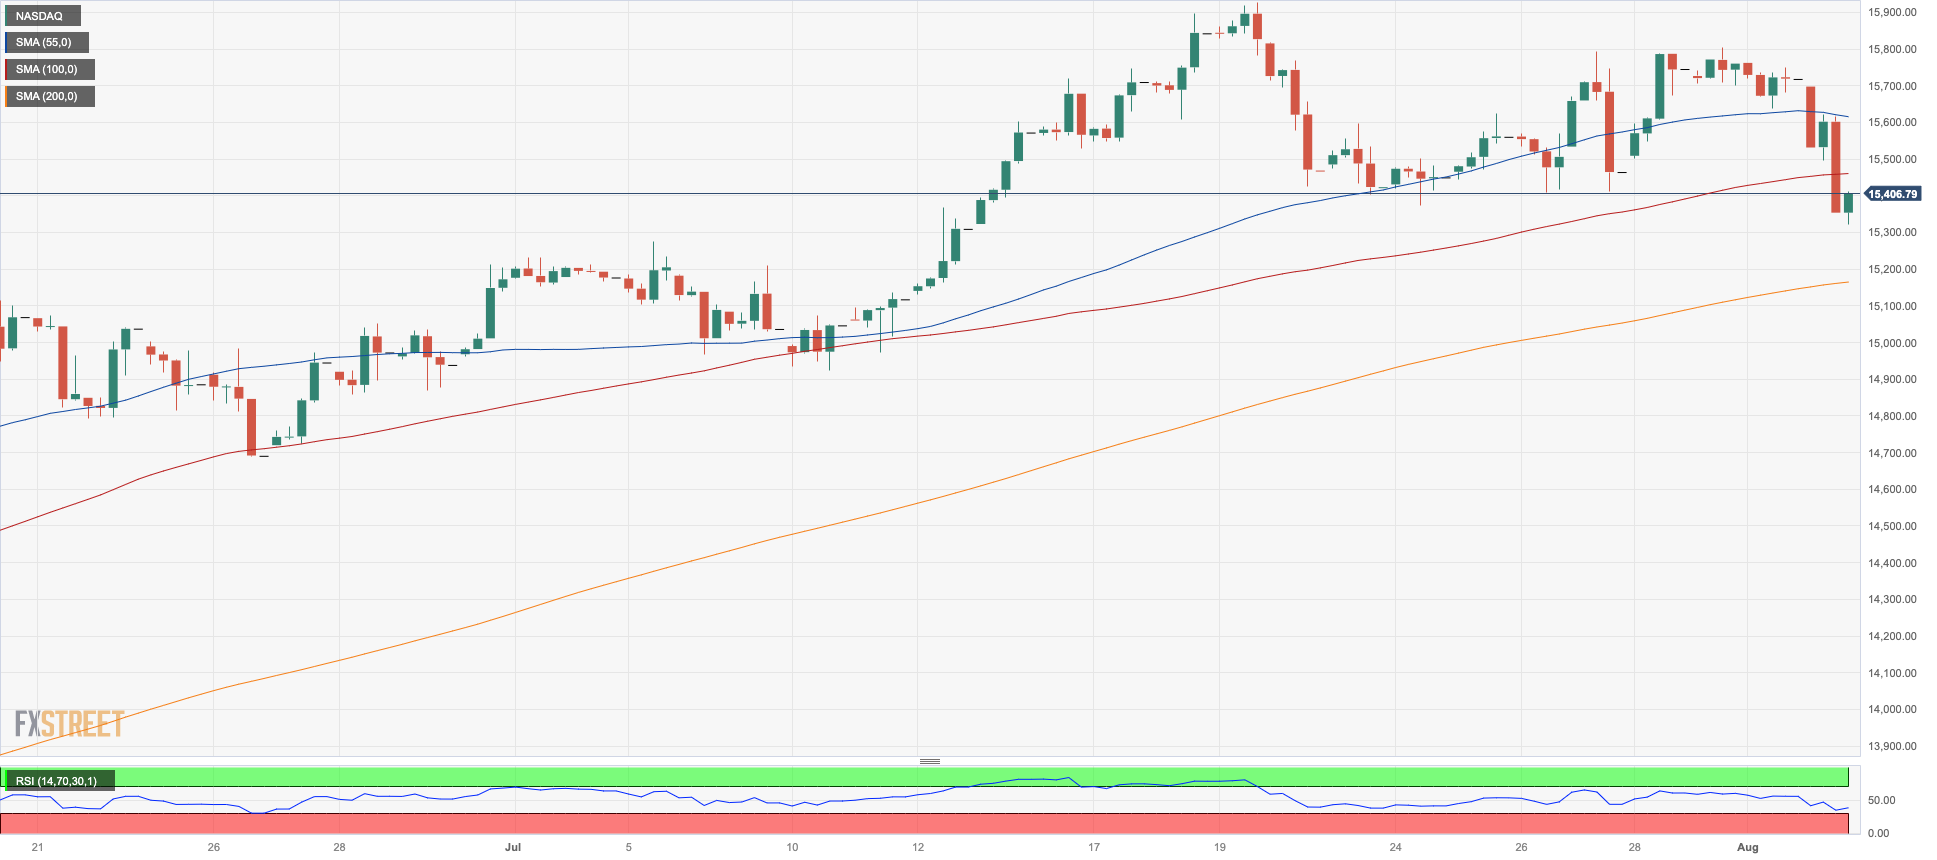
The tech-heavy reference index Nasdaq 100 followed its American peers and retreated to the area of three-week lows near 15300 on Wednesday.
The continuation of the rally in the greenback in combination with the strong upside bias in US yields and the downgrade by Fitch of the US credit rating all weighed on the US tech sector and sparked the marked correction in the index.
The Nasdaq 100 confronts an immediate upward trajectory from its 2023 high of 15932 (July 19), which is quickly followed by the round 16000 milestone. In comparison, there is an initial support at the weekly low of 15321 (August 2) ahead of the July low of 14924 (July 10), while the weekly lows of 14687 (June 26) and 14283 (June 7) are oriented farther south. A breach of the latter might result in a drop to another weekly low of 13520 (May 24), which is prior to the May low of 12938 (May 4) and the April low of 12724 (April 25) and looks to be supported by the proximity of the crucial 200-day SMA (12809). The everyday RSI collapsed to the 52 region.
Top Gainers: Vertex, Walgreen Boots, Charter Communications
Top Losers: Zscaler, Electronic Arts, PDD Holdings DRC
Resistance levels: 15795 15932 16017 (4H chart)
Support levels: 15321 14924 14687 (4H chart)
DOW JONES
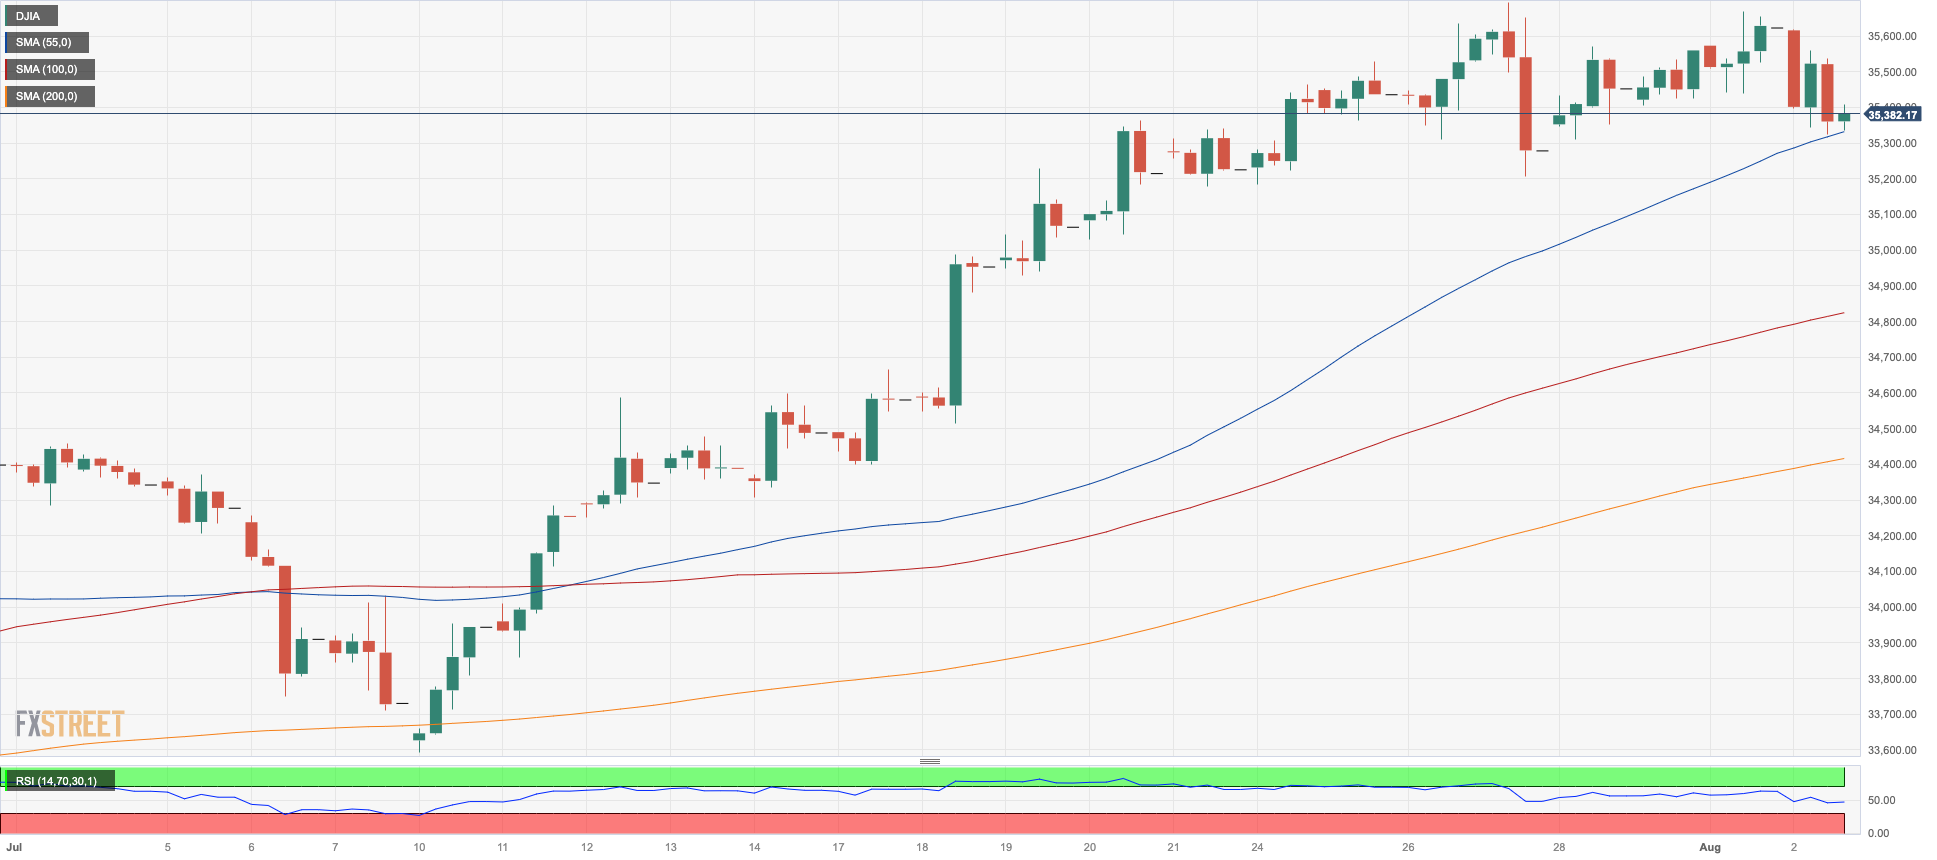
Market sentiment took a sharp turn for the worse on Wednesday following credit agency Fitch's decision to downgrade the US sovereign rating.
This downgrade had a significant impact on equities, particularly those represented by the Dow Jones index. After three consecutive days of gains, which had led to fresh year-to-date peaks near 35,700 earlier in the month, the index suddenly shifted gears and traded defensively, plummeting to weekly lows around the 35,300 region.
As the market braced for further uncertainty, investors remained cautious and kept a close eye on corporate earnings reports. The approaching release of the US Nonfarm Payrolls report on Friday added to the sense of prudence among investors, making them more vigilant and discerning in their decision-making.
Overall, the Dow Jones retreated 0.73% to 35369, the S&P500 dropped 1.21% to 4520, and the tech-focused Nasdaq Composite eased 2.09% to 13986.
Immediately to the upside for the Dow Jones now emerges the 2023 high of 35679 (August 1). If the index can break past this barrier, it may reach the February 2022 top of 35824 (February 9) before hitting its all-time high of 36952 (January 5, 2022). On the contrary, the index will not hit the first support level until it reaches the intermediate 55-day SMA at 34113. Further south comes the July low of 33705 (July 10), which appears propped up by the transitory 100-day SMA at 33691. Down from here aligns the 200-day SMA at 33459 ahead of the May low of 32586 (May 25) and the 2023 bottom of 31429 (March 15). The daily RSI dropped to the vicinity of 63.
Top Performers: Walgreen Boots, Merck&Co, J&J
Worst Performers: Intel, Microsoft, Boeing
Resistance levels: 35679 35824 36513 (4H chart)
Support levels: 35216 34418 33705 (4H chart)
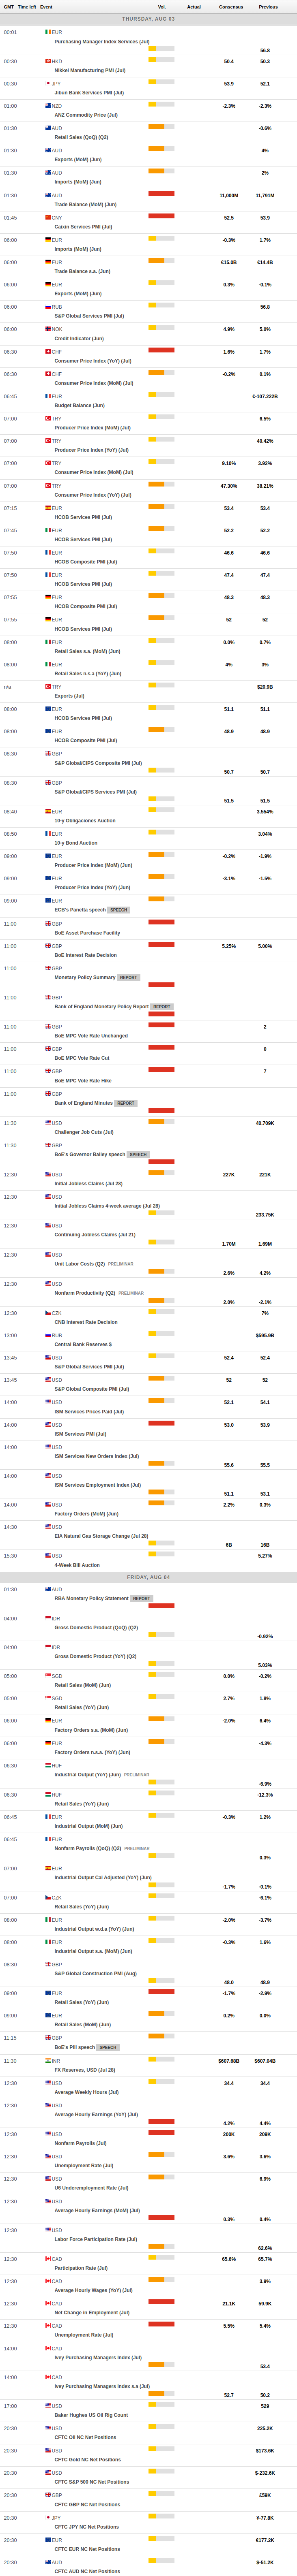
MACROECONOMIC EVENTS
All Information & Updates provided by:

All information relating to the financial markets available on this page has been prepared and issued by FXStreet (Forexstreet SL, Spain, Reg: B62498233) on the basis of publicly available information and all information believed to be reliable and does not conflict with Kuwaiti local laws, and all necessary care has been taken to before the company to ensure that the facts mentioned are correct from the source.
NCM Investment nor any of its directors or employees shall in any way be held responsible for the contents of this news, and the information contained on this page is intended only to provide clients with publicly available information and should not be construed as investment advice, report or analysis and/or constitute an offer or invitation to buy or sell financial instruments of any kind.
RISK WARNING: Forex and CFDs are highly risky leveraged products, as losses can exceed deposits. Please ensure you understand all the risks and take independent advice if necessary. NCM will segregate the clients based on the criteria of the regulator and its bylaws. NCM does not provide any advisory service; the material published does not constitute advice or a recommendation for a transaction in any financial instrument. NCM accepts no responsibility for any use of the content presented and any consequences of that use. Anyone acting on the information provided does so at their own risk.