
- Contact Us:
-

-

-

-


Daily Market Updates
04 Aug 2023
USDJPY
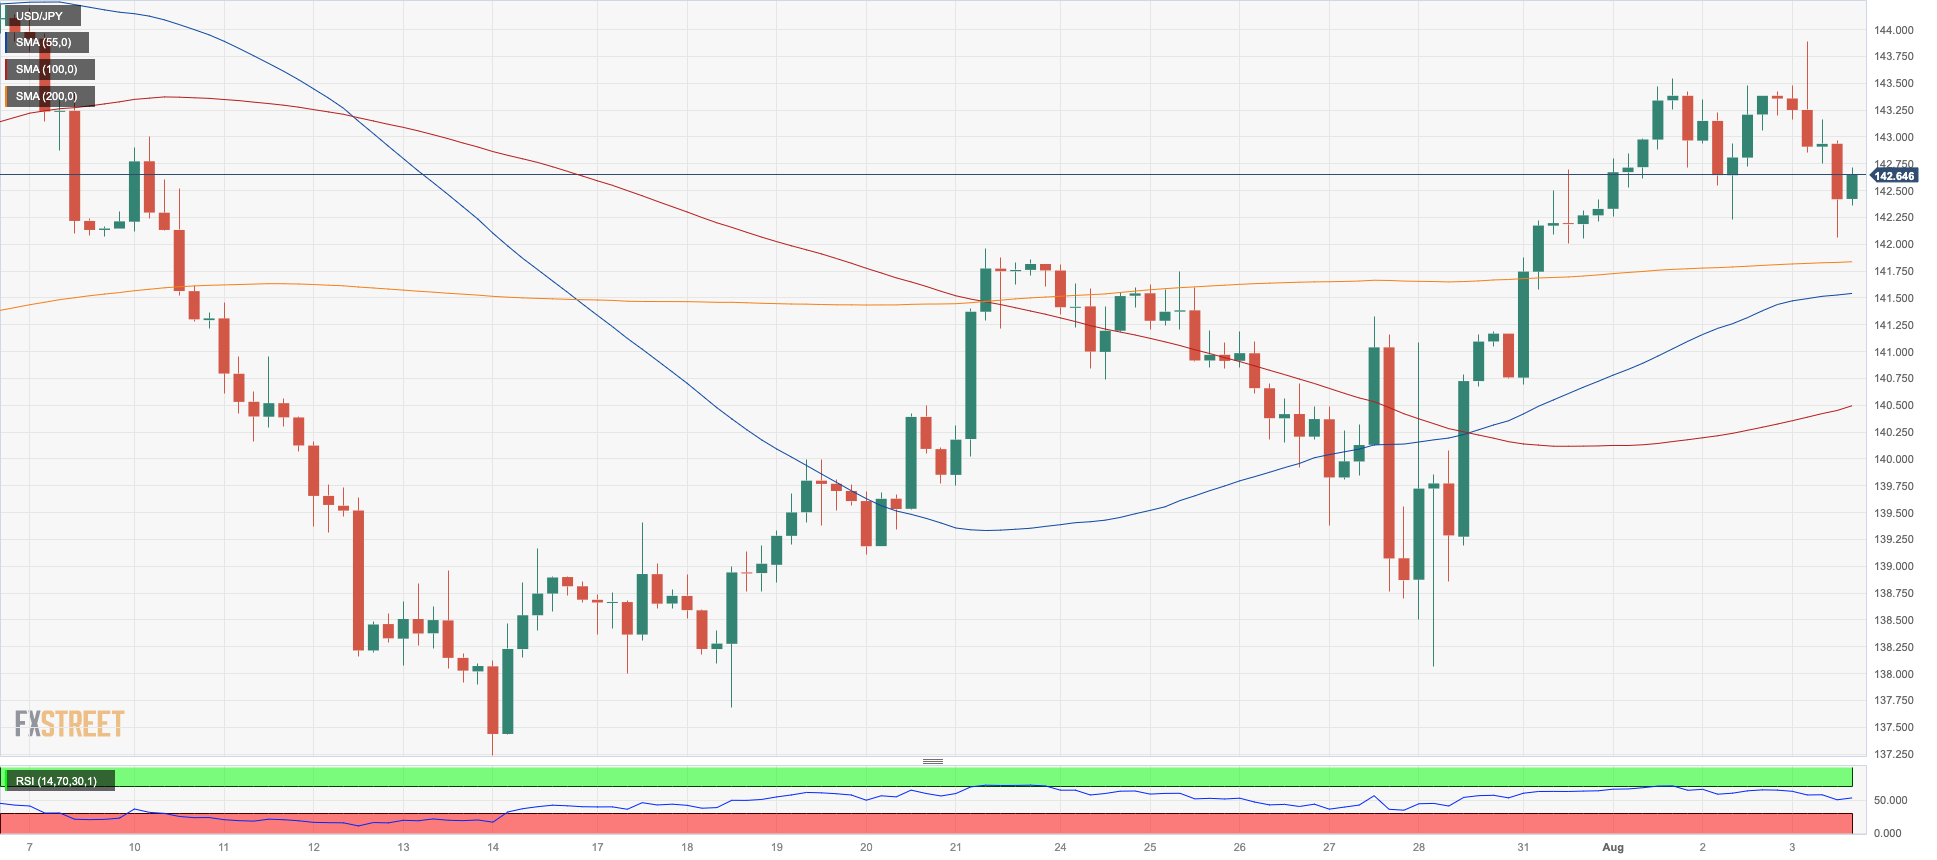
USD/JPY rose to new four-week peaks near the 144.00 hurdle on Thursday, just to see all those gains evaporate and retest the 142.00 area towards the end of the session, where some decent contention seems to have emerged.
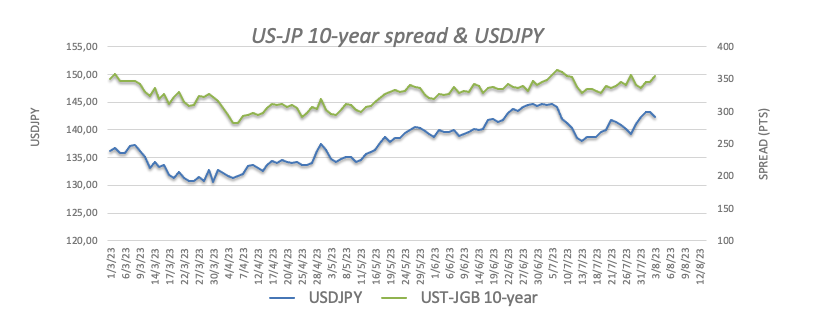
This decline occurred after an indecisive price action on Wednesday, and despite the USD Index (DXY) reaching new highs near 103.00 earlier in the day, the dollar lost momentum again. At the same time, US yields continued their strong rebound, especially in the 10-year/30-year segment.
However, the most noteworthy event of the day concerning the Japanese currency was an unexpected bond-buying operation by the BoJ. That said, the central bank purchased approximately ¥400B of JGBs within various maturities when the benchmark JGB 10-year yield was at multi-year highs around 0.65%.
Regarding the domestic calendar, Foreign Bond Investment increased by ¥208.9B during the week ending on July 29th.
Despite the daily knee-jerk, the risks for USD/JPY still appear skewed to the upside in the near term. That said, initial resistance comes at the weekly/monthly high of 143.88 (August 3) prior to the 2023 top of 145.07 (June 30) and the 2022 high of 151.94 (October 21). On the downside, the weekly low of 138.05 (July 28) is slightly above the July low of 137.23 (July 14) and the important 200-day SMA of 136.59. A break below this level reveals the weekly low of 133.01 (April 26), followed by a weak support of 132.01 (April 13) and the round mark of 130.00. On the daily chart, the RSI dropped below the 57 mark.
Resistance levels: 143.88 144.65 145.07 (4H chart)
Support levels: 142.08 141.84 140.36 (4H chart)
GBPUSD
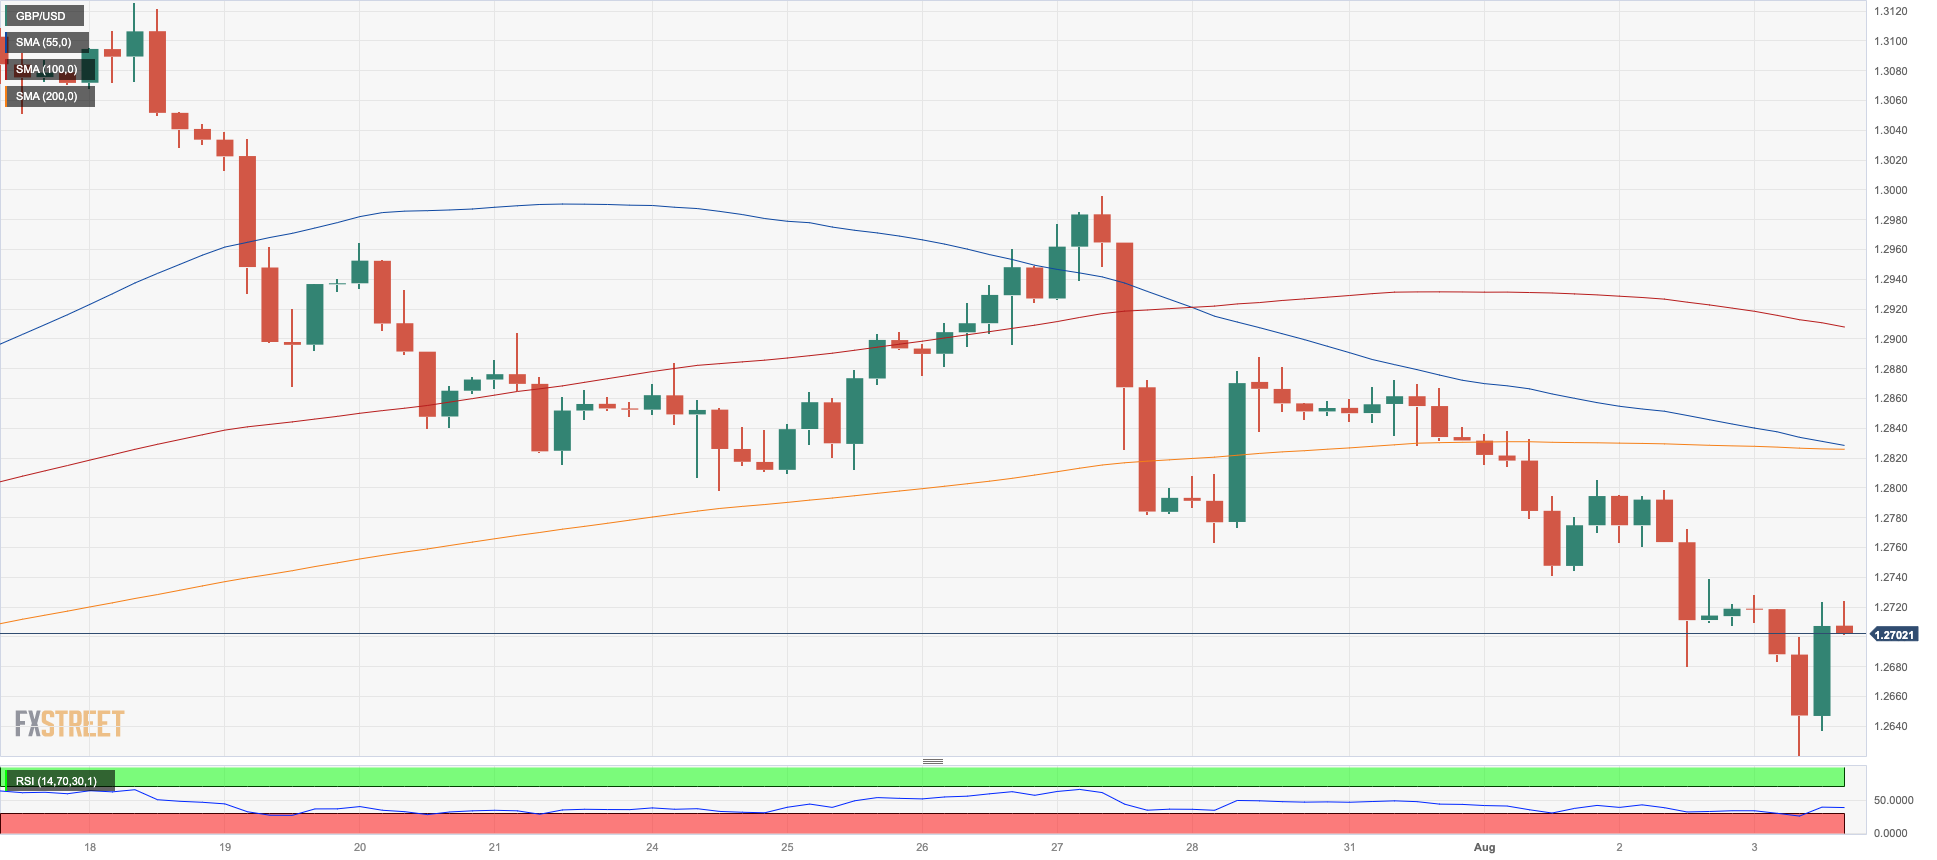
After hitting a low at around 1.2620, GBP/USD experienced a significant rebound and surpassed the 1.2700 level on Thursday.
In fact, investor sentiment improved post-BoE meeting, leading to increased buying interest around the British pound.
During the BoE meeting, the central bank raised its policy rate by 25 bps, as expected. Notably, MPC members Haskel and Mann voted for a 50 bps rate hike, while member Dhingra voted to keep rates unchanged, expressing concerns about potential overtightening risks.
The BoE also revised down its economic growth forecast for 2024 and 2025, while projecting higher inflation in the same period, with the key rate expected to peak just above 6%.
Governor Bailey, in the press conference, expressed confidence that inflation would likely subside. However, he acknowledged that wage growth had been stronger than initially estimated. Bailey also emphasized that there were multiple options to bring inflation back to the bank's target, indicating that further tightening of monetary policy is still on the table. Nevertheless, the BoE's tightening cycle is nearing its end.
Following the BoE meeting, the UK 10-year gilt yields reached multi-session highs, reaching around 4.50%.
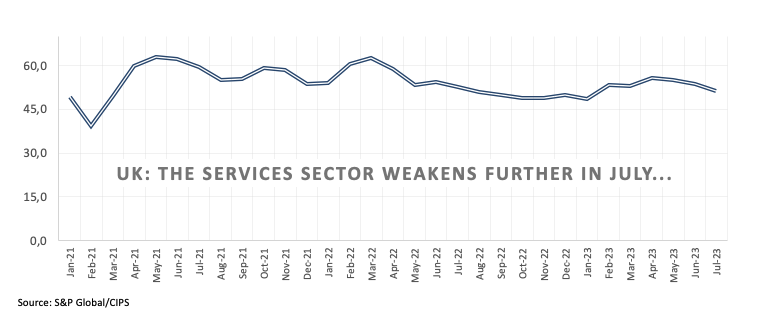
In the UK, the final S&P Global/CIPS Services PMI for July came in at 51.5, matching the earlier advanced readings.
If the downtrend continues, GBP/USD may retest the weekly/monthly low of 1.2620 (August 3), which is slightly above the weekly low of 1.2590 (June 29). Down from here aligns the provisional 100-day SMA of 1.2578. The 2021-2023 trend line is around 1.2490, prior to the June low of 1.2368 (June 5) and the May low of 1.2308 (May 25), both of which appear to be supported by the crucial 200-day SMA (1.2309). On the contrary, the weekly high of 1.2995 (July 27) is impeding the achievement of the 2023 high of 1.3142 (July 14). Cable might then try to break the weekly highs of 1.3146 (April 14, 2022) and 1.3298 (March 23, 2022). The daily RSI appeared flat around 42.
Resistance levels: 1.2823 1.2888 1.2995 (4H chart)
Support levels: 1.2620 1.2591 1.2368 (4H chart)
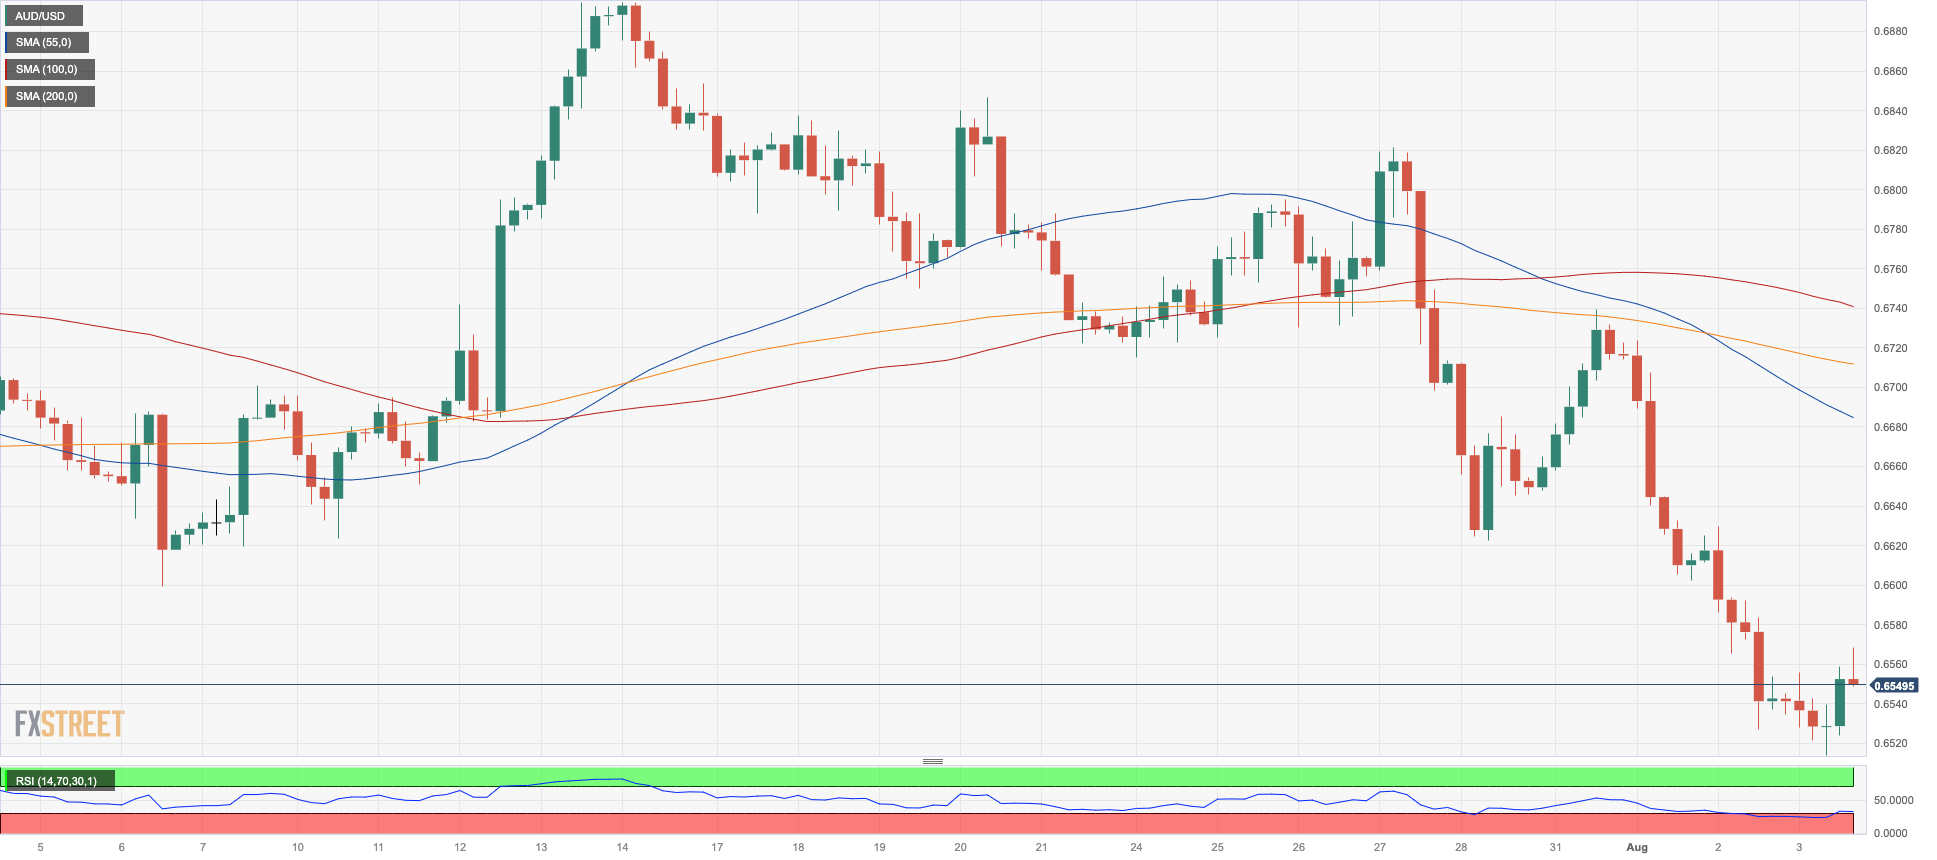
AUDUSD
The Australian dollar finally received some much-needed relief from the greenback, which declined late in the day. This led to the first day of gains in AUD/USD after two consecutive declines.
The better tone in the commodity complex also contributed to the recovery in the Aussie dollar, despite the mixed results from the Chinese docket published during early trade.
In Australia, the final Judo Bank Services PMI eased to 47.9 in July, while the trade surplus improved to A$11.321B during June. Exports contracted 2% MoM, while imports were down 4% from a month before.
Additional AUD/USD depreciation is now expected to breach the weekly monthly low of 0.6514 (August 3) prior to the 2023 low of 0.6458 (May 31). Below this level, the November 2022 bottom of 0.6272 (November 3) appears, followed by the 2022 low of 0.6179 (October 13). Instead, immediate up-barrier is anticipated at the crucial 200-day SMA of 0.6731 ahead of the July high of 0.6894 (July 13), which appears to be closely followed by the June peak of 0.6899 (June 16). Breaking through this sector will enable a move to the critical 0.7000 level, ahead of the weekly high of 0.7029 (February 14) and the 2023 top of 0.7157 (February 2). The daily RSI bounced past the 37 level.
Resistance levels: 0.6629 0.6739 0.6821 (4H chart)
Support levels: 0.6514 0.6458 0.6386 (4H chart)
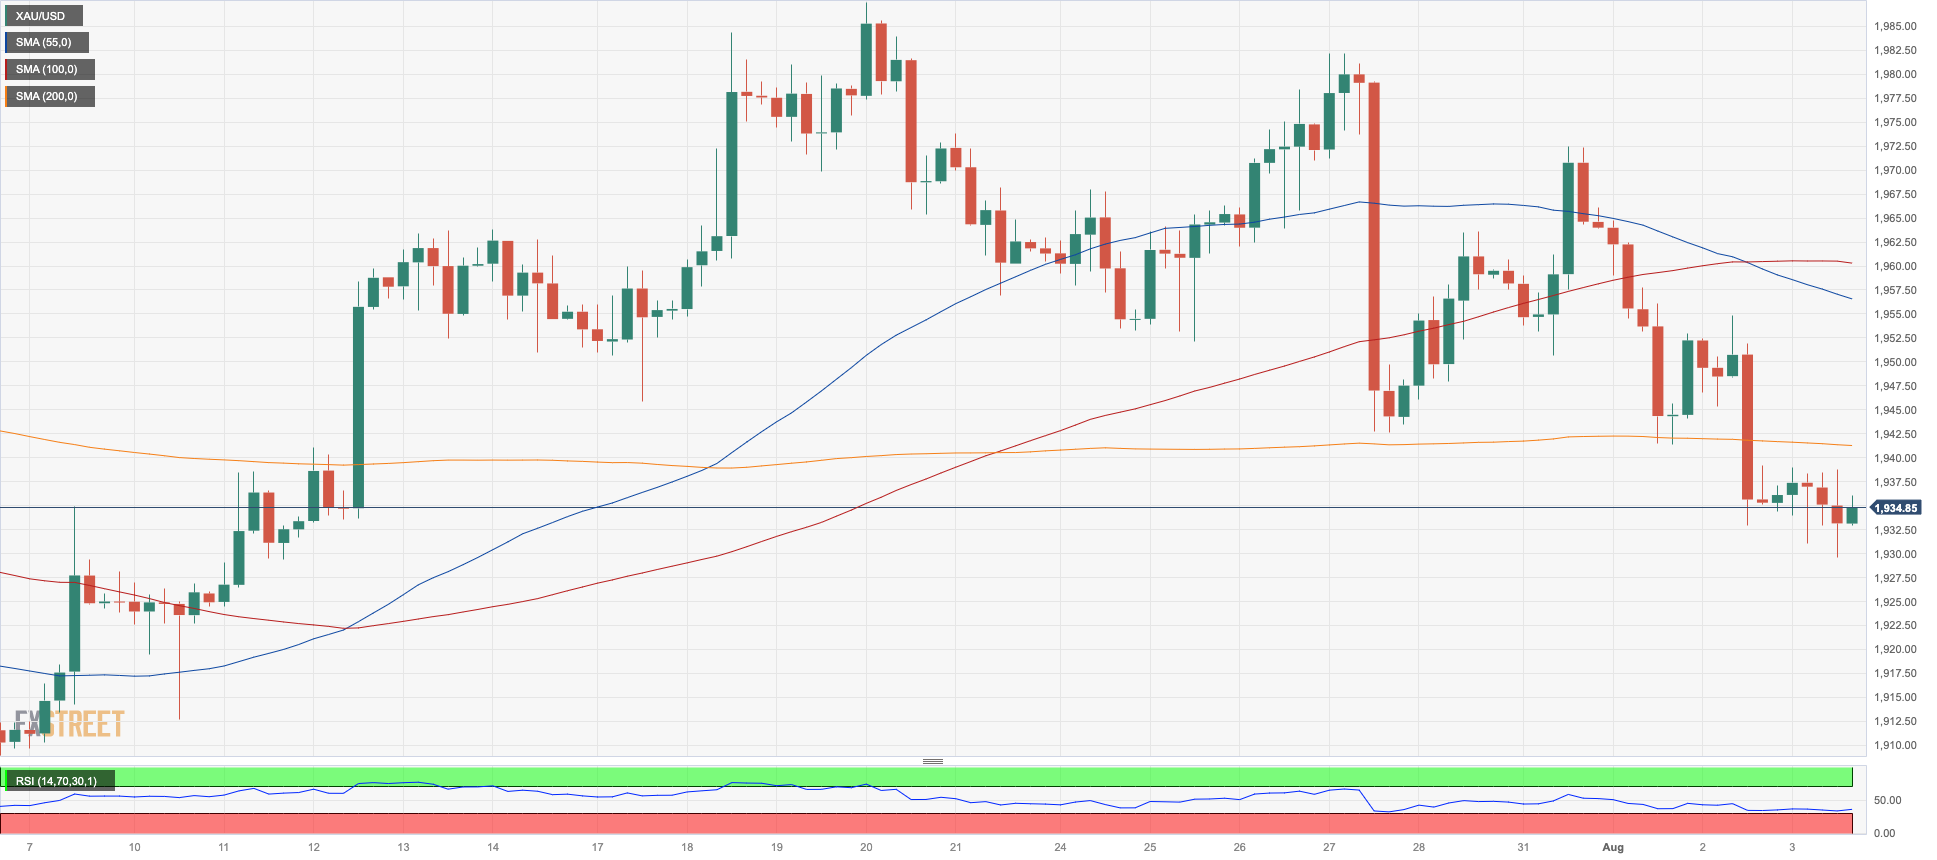
GOLD
It was quite an apathetic session for the precious metal, as it navigated within a narrow range around the $1930 zone per troy ounce on Thursday.
The daily price action in bullion came amidst the persistent climb in US yields, mainly in the belly and the long end of the curve, while the late drop in the greenback appears to have triggered a smile in the risk universe and the rest of the USD-denominated assets.
The next risk event for the commodity is expected on Friday with the release of the US Nonfarm Payrolls, always amidst the reinforced data-dependent stance from the Federal Reserve (as per the latest event).
Further decline in gold prices should not be ruled out for the time being, with the immediate contention at the weekly/monthly low of $1929 (August 3), which comes before the round level of $1900 and the June low of $1893 (June 29), which looks underpinned by the 200-day SMA at $1892. South from here emerges the 2023 low of $1804 (February 28) and the key support level of $1800. A continuation of the positive trend, on the other hand, might return gold prices to the July high of $1987 (July 20). A break above this level may open the door to a rise towards the crucial level of $2000, and above that, it may disclose the path to the 2023 peak of $2067 (May 4), followed by the 2022 top of $2070 (March8) and the all-time high of $2075 (August 7).
Resistance levels: $1954 $1972 $1987 (4H chart)
Support levels: $1929 $1912 $1893 (4H chart)
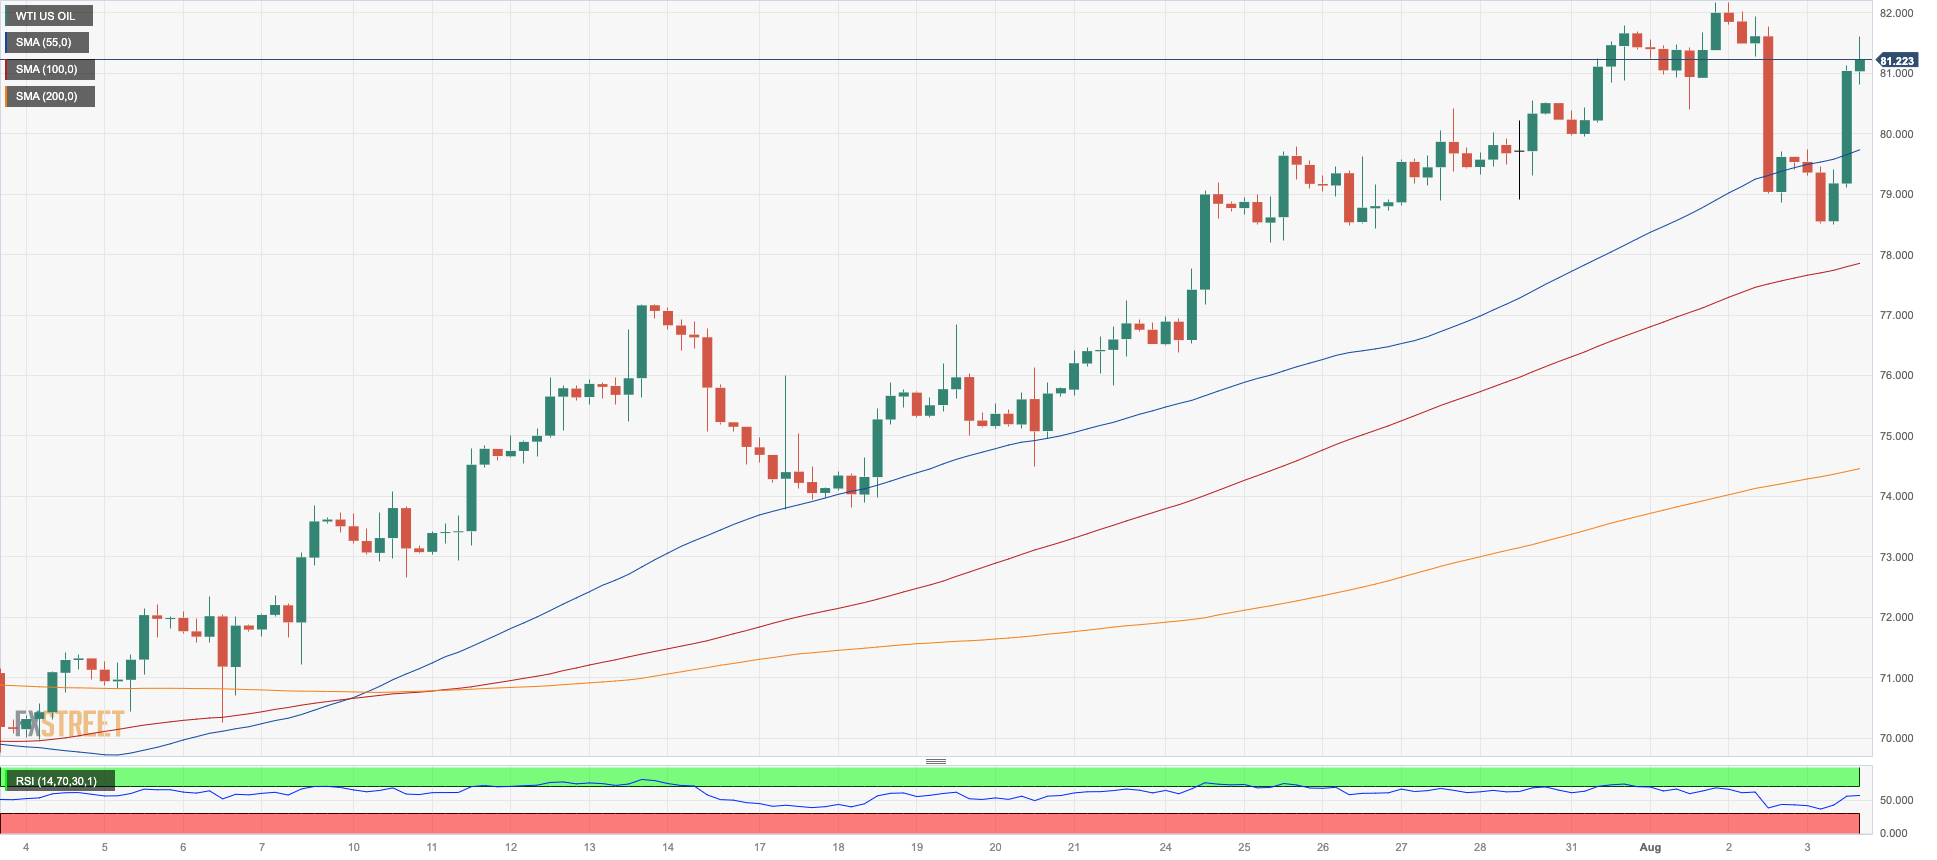
CRUDE WTI
WTI prices staged a significant recovery on Thursday, recouping much of the previous day's losses. Indeed, oil prices advanced towards the $82.00 mark per barrel as traders adopted a more positive tone.
The rally in oil prices came after Saudi Arabia said it would extend its voluntary reduction in oil output into September (and likely beyond), while Russia announced it would trim oil exports by 300,000 barrels per day in September.
At the same time, the drop in US crude oil stockpiles reported by the EIA on Wednesday and hopes of a recovery in the Chinese economy and continued resilience of the US economy supported oil prices and the narrative of tight supply.
If WTI prices soar over the July high of $82.39 (August 2), they might target the 2023 top of $83.49 (April 12) ahead of the November 2022 peak of $93.73 (November 7). Having said that, initial support is seen at the key 200-day SMA at $76.56, seconded by the weekly low of $73.89 (July 17) and the temporary 100-day and 55-day SMAs at $73.83 and $73.23, respectively. If WTI falls below this region, the June low of $66.86 (June 12) and the 2023 low of $63.61 (May 4) may become important. Below there, the December 2021 bottom of $62.46 (December 2) may provide support before the critical round level of $60 is reached.
Resistance levels: $82.39 $83.08 $83.49 (4H chart)
Support levels: $78.66 $74.47 $73.81 (4H chart)
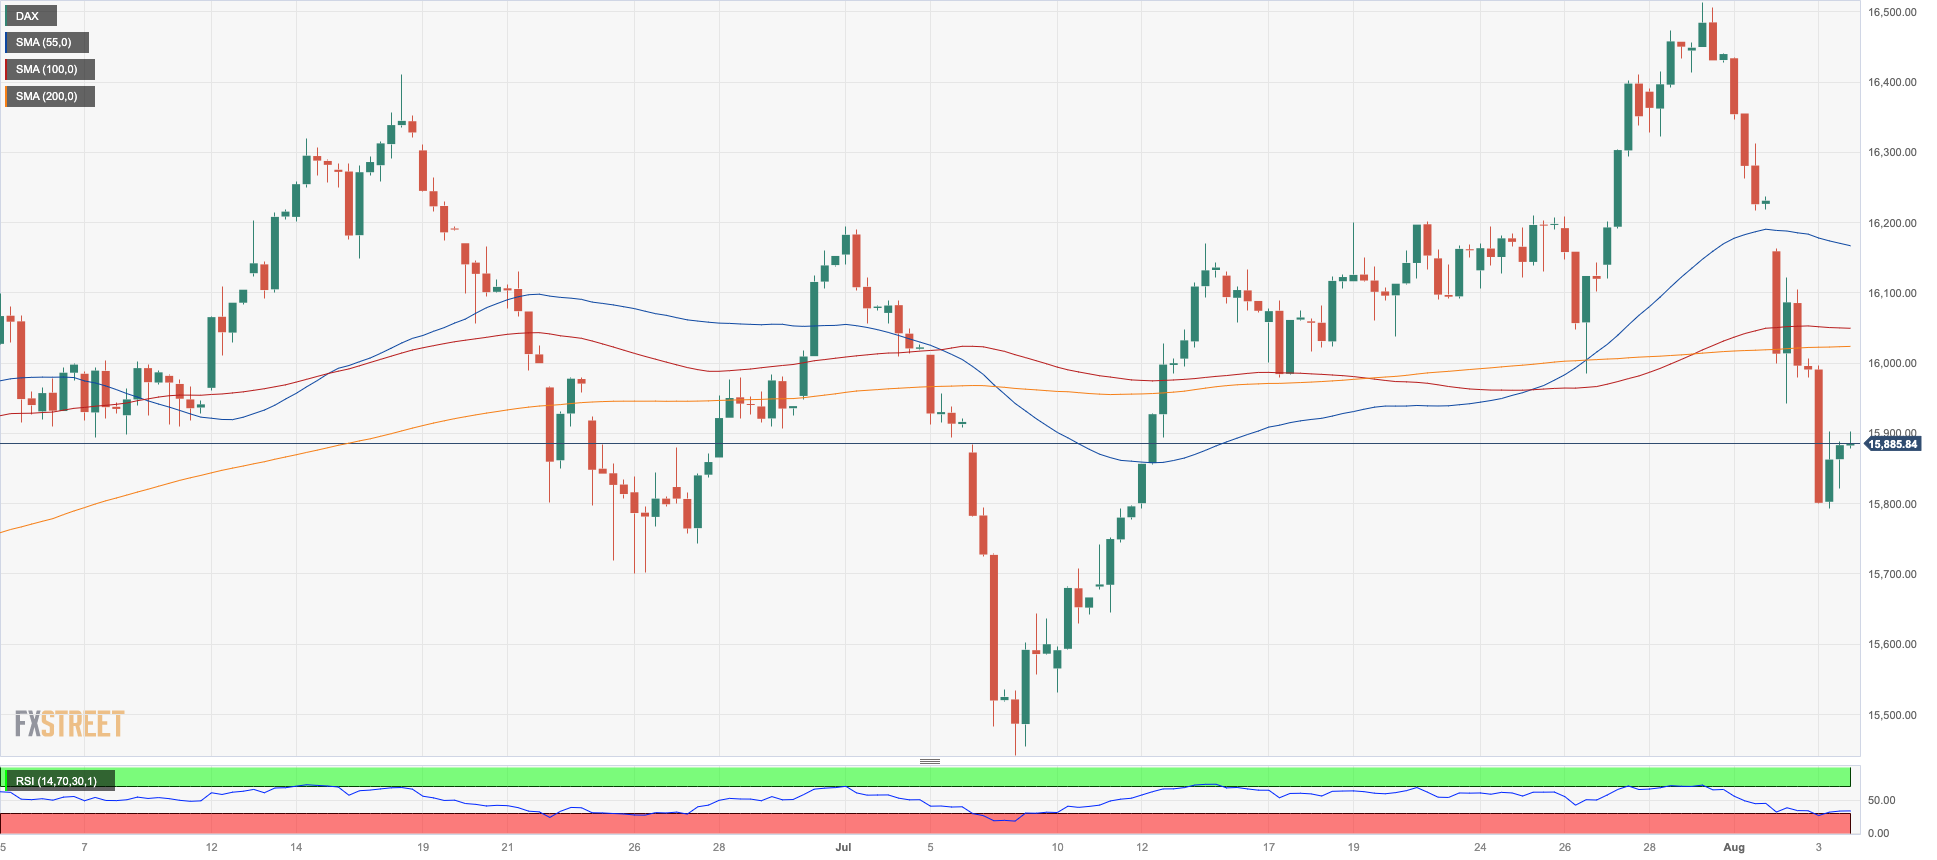
GER40
Germany’s stock reference DAX40 clinched its fourth consecutive daily pullback on Thursday, in line with the broad-based sour sentiment in the rest of the European equities markets.
In fact, the index retreated further on the back of discouraging prints from the services sector in the euro area, which further fanned the flames of the idea that a potential recession could be brewing in the region.
In addition, the BoE hiked rates by 25 bps and left the door open to further tightening in the near-term future, although decisions on the matter will depend mostly on inflation data.
The new daily drop in the index came as opposed to further strength in the 10-year bund yields, which climbed to three-week highs near 2.60%, broadly in line with their US counterpart.
For the DAX40, the record high of 16528 (July 31) appears immediately to the upside. In contrast, the weekly low at 15807 (August 3) comes ahead of the July low of 15456 (July 7) and is followed by the critical 200-day SMA at 15227. If this zone is broken, a move to the March low of 14458 (March 20) before the December 2022 low of 13791 (December 20) is probable. The daily RSI fell further to the 42 region.
Best Performers: Zalando SE, Beiersdorf AG, Merck
Worst Performers: Infineon, Dr Ing hc Porsche Prf, BMW ST
Resistance levels: 16020 16136 16528 (4H chart)
Support levels: 15807 15456 14809 (4H chart)
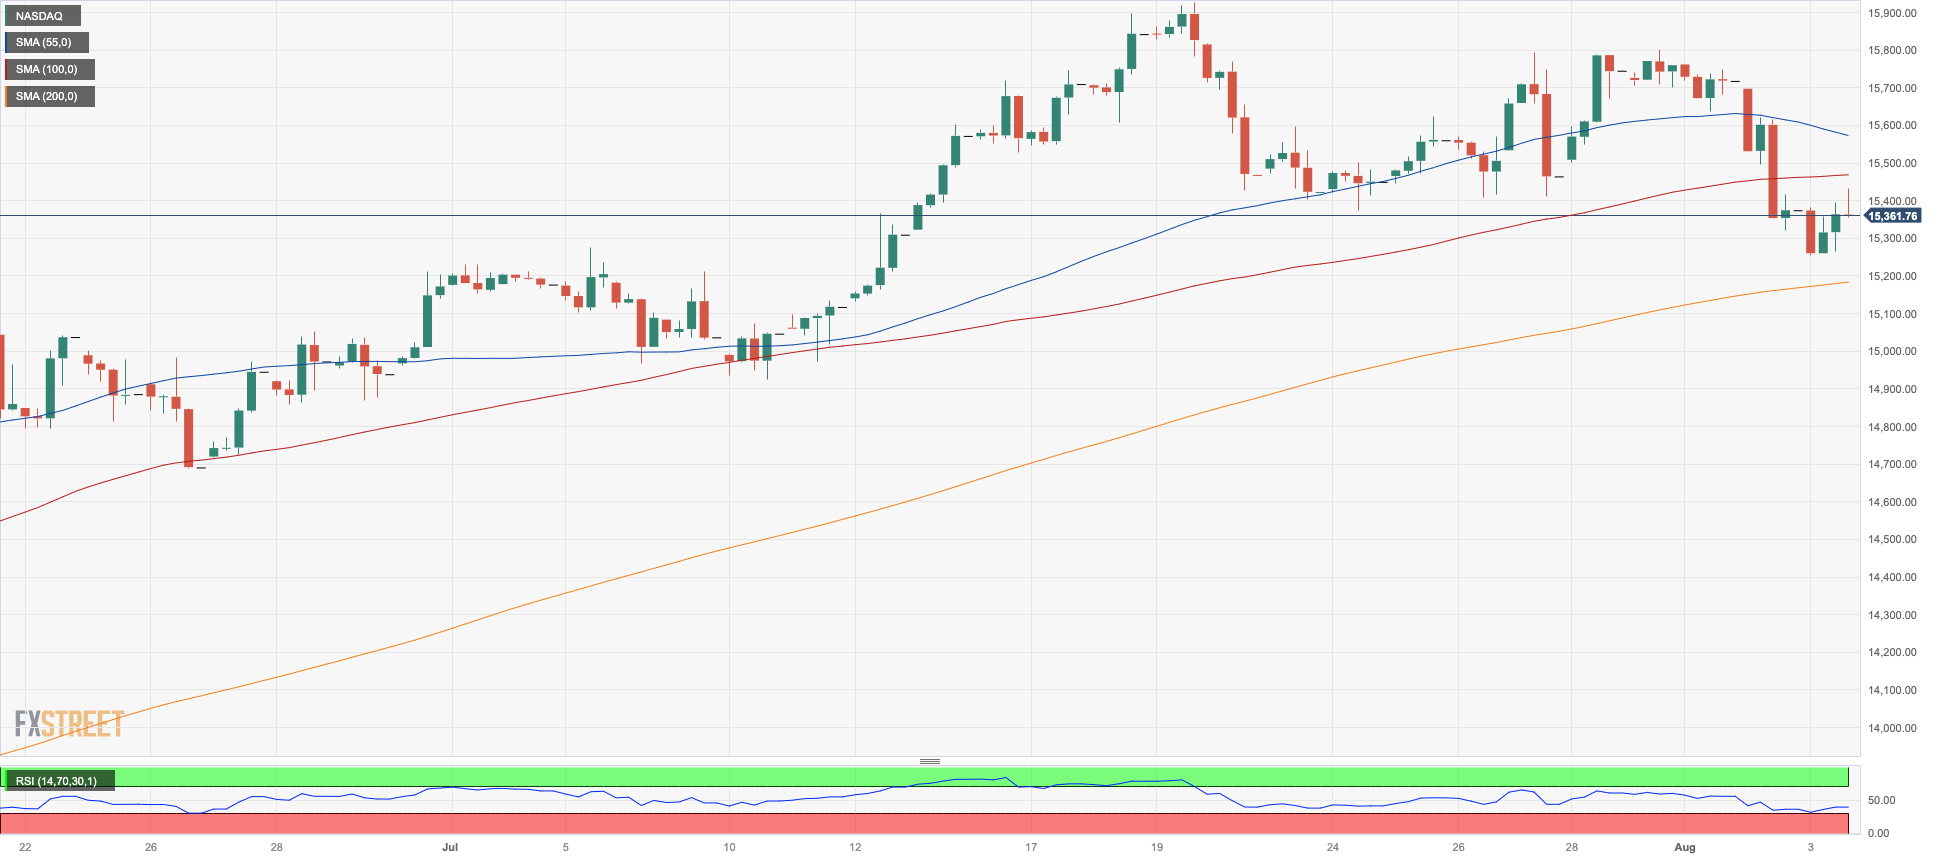
NASDAQ
The tech sector saw strong demand and a rebound in the Nasdaq 100 index following two consecutive days of losses on Thursday, as investors eagerly awaited the release of earnings reports from Amazon and Apple, two major players in the e-commerce and smartphone industries respectively.
This positive sentiment was further boosted by a decline in the value of the US dollar towards the end of the trading day, which may have contributed to a generally positive outlook among traders.
Additionally, there is speculation that the Federal Reserve may soon conclude its period of monetary tightening, which also helped to support investor confidence in the tech sector.
The resumption of the bullish bias should lift the Nasdaq 100 to the weekly high of 15803 (July 31) ahead of its 2023 top of 15932 (July 19), which is immediately followed by the round 16000 mark. In comparison, the weekly low of 15270 (August 3) provides initial support ahead of the July low of 14924 (July 10), while the weekly lows of 14687 (June 26) and 14283 (June 7) are orientated farther south. A breach of the latter might lead to a decline to another weekly low of 13520 (May 24), which is previous to the May low of 12938 (May 4) and the April low of 12724 (April 25) and appears to be supported by the vicinity of the critical 200-day SMA (12809). The daily RSI ticked a tad higher to the 52 zone.
Top Gainers: MercadoLibre, Constellation Energy, Cognizant A
Top Losers: PayPal Holdings Inc, Qualcomm, ANSYS
Resistance levels: 15795 15932 16017 (4H chart)
Support levels: 15270 14924 14687 (4H chart)
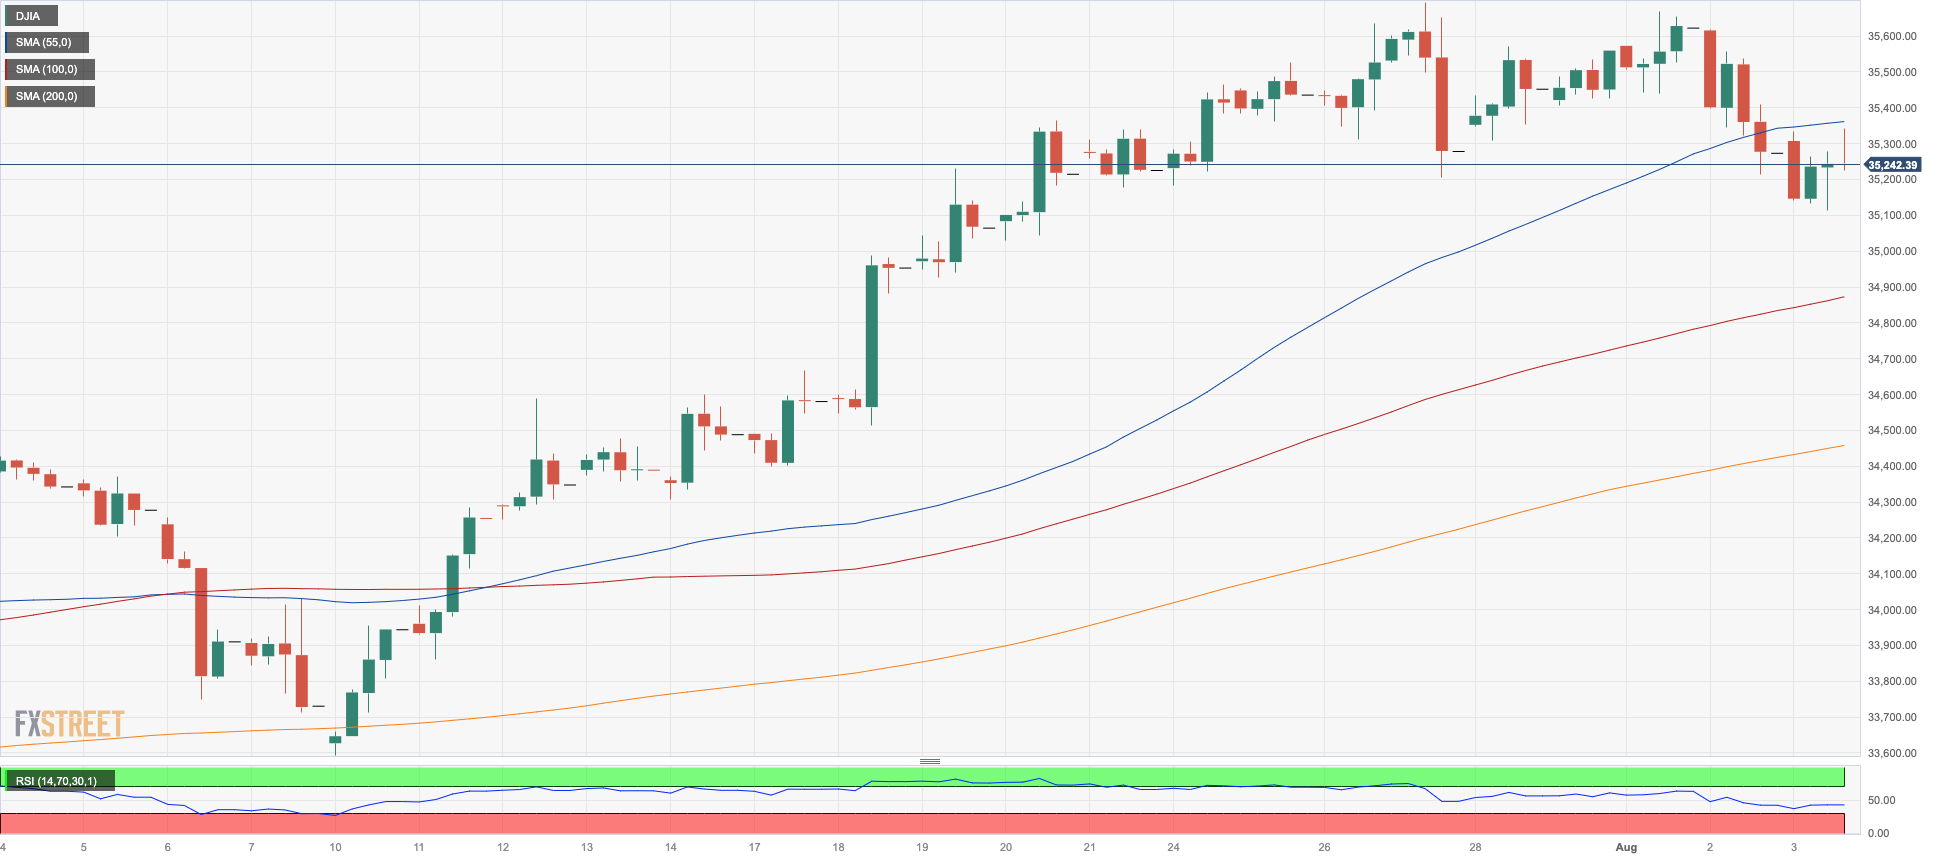
DOW JONES
Stocks included in the Dow Jones index initially faced some weakness but managed to overcome it and moved into positive territory, all while market participants became more cautious in their approach.
Investors showed prudence as they awaited the release of earnings reports from major companies like Apple and Amazon, which were scheduled for later in the North American trading session.
Additionally, concerns regarding the recent credit rating downgrade of the US by Fitch seemed to have already been processed and taken into account by the market.
On the whole, the Dow Jones rose 0.06% to 35303, the S&P500 advanced 0.02% to 4514, and the tech-heavy Nasdaq Composite gained 0.19% to 14001.
For the Dow Jones, the 2023 high of 35679 (August 1) is now visible to the upside. If the index can break above this barrier, it may achieve a high of 35824 in February 2022 (February 9) before reaching its all-time high of 36952 on January 5, 2022. The index, on the other hand, will not hit the first support level until it reaches the intermediate 55-day SMA at 34147. Further south, the July low of 33705 (July 10) looks to be supported by the transitory 100-day SMA at 33724. The 200-day SMA at 33487 is aligned with the May low of 32586 (May 25) and the 2023 bottom of 31429 (March 15). The daily RSI looked side-lined above 60.
Top Performers: Dow, Intel, Chevron
Worst Performers: Salesforce Inc, Honeywell, 3M
Resistance levels: 35679 35824 36513 (4H chart)
Support levels: 35122 34721 33705 (4H chart)
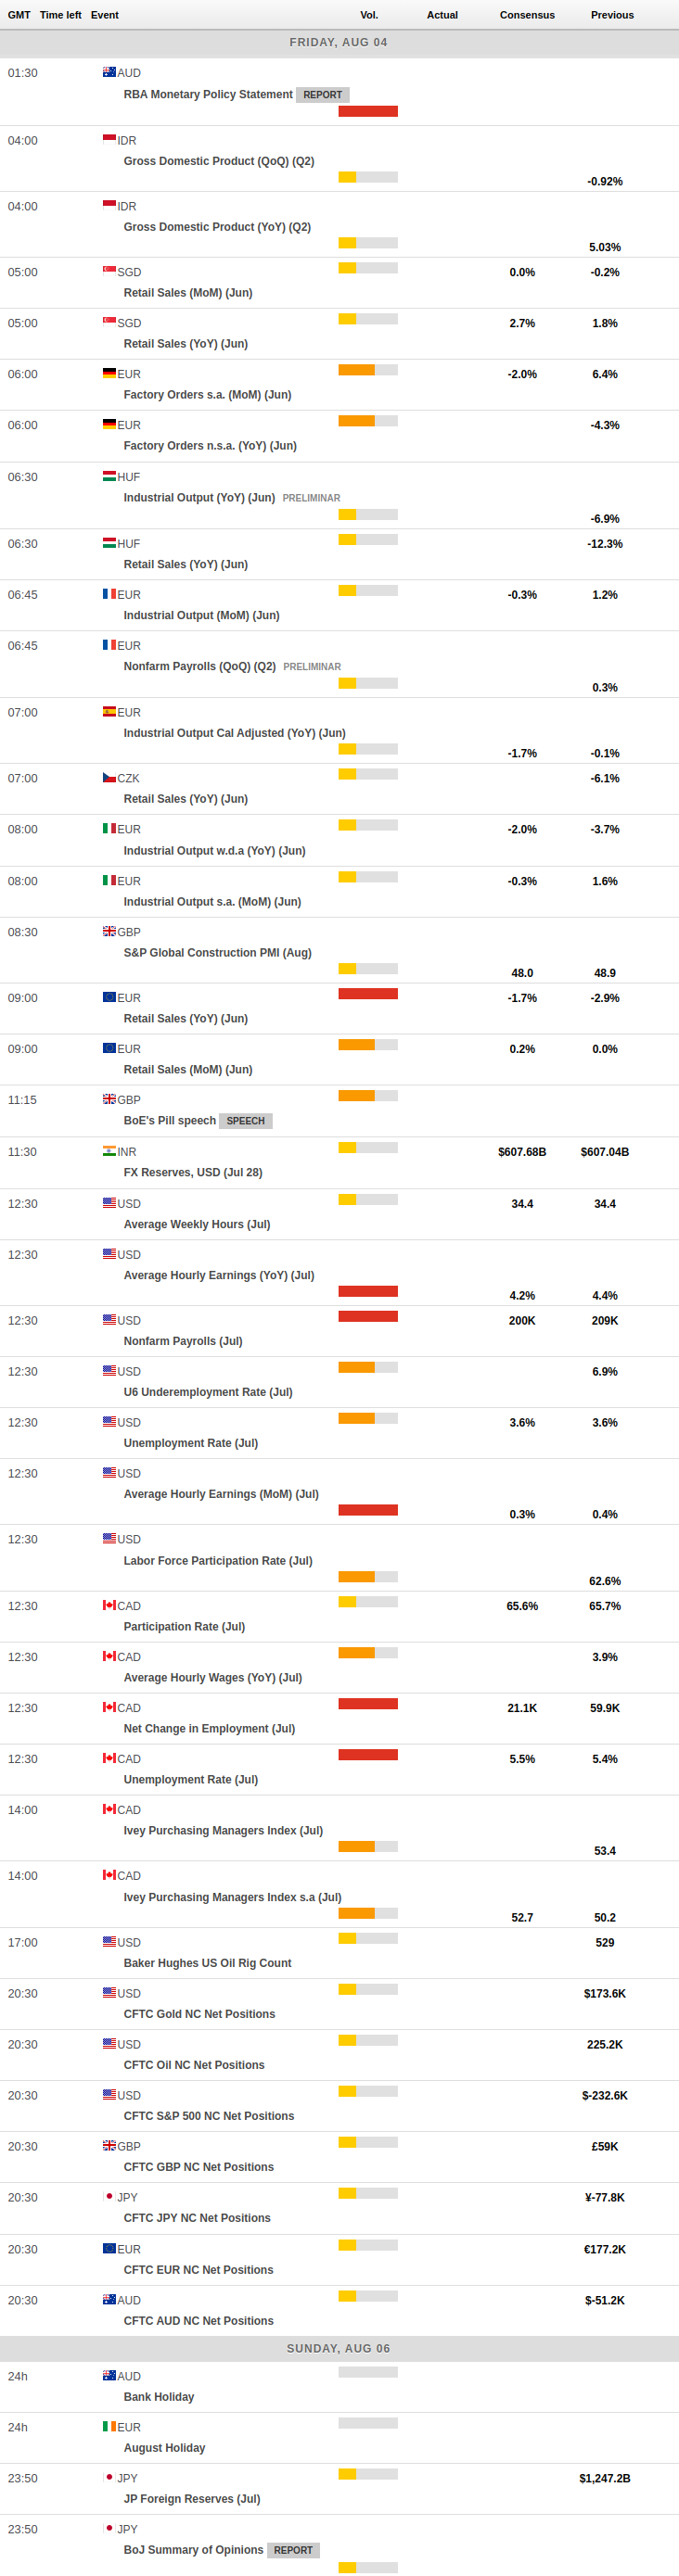
MACROECONOMIC EVENTS
All Information & Updates provided by:

All information relating to the financial markets available on this page has been prepared and issued by FXStreet (Forexstreet SL, Spain, Reg: B62498233) on the basis of publicly available information and all information believed to be reliable and does not conflict with Kuwaiti local laws, and all necessary care has been taken to before the company to ensure that the facts mentioned are correct from the source.
NCM Investment nor any of its directors or employees shall in any way be held responsible for the contents of this news, and the information contained on this page is intended only to provide clients with publicly available information and should not be construed as investment advice, report or analysis and/or constitute an offer or invitation to buy or sell financial instruments of any kind.
RISK WARNING: Forex and CFDs are highly risky leveraged products, as losses can exceed deposits. Please ensure you understand all the risks and take independent advice if necessary. NCM will segregate the clients based on the criteria of the regulator and its bylaws. NCM does not provide any advisory service; the material published does not constitute advice or a recommendation for a transaction in any financial instrument. NCM accepts no responsibility for any use of the content presented and any consequences of that use. Anyone acting on the information provided does so at their own risk.