
- Contact Us:
-

-

-

-


Daily Market Updates
07 Aug 2023
USDJPY
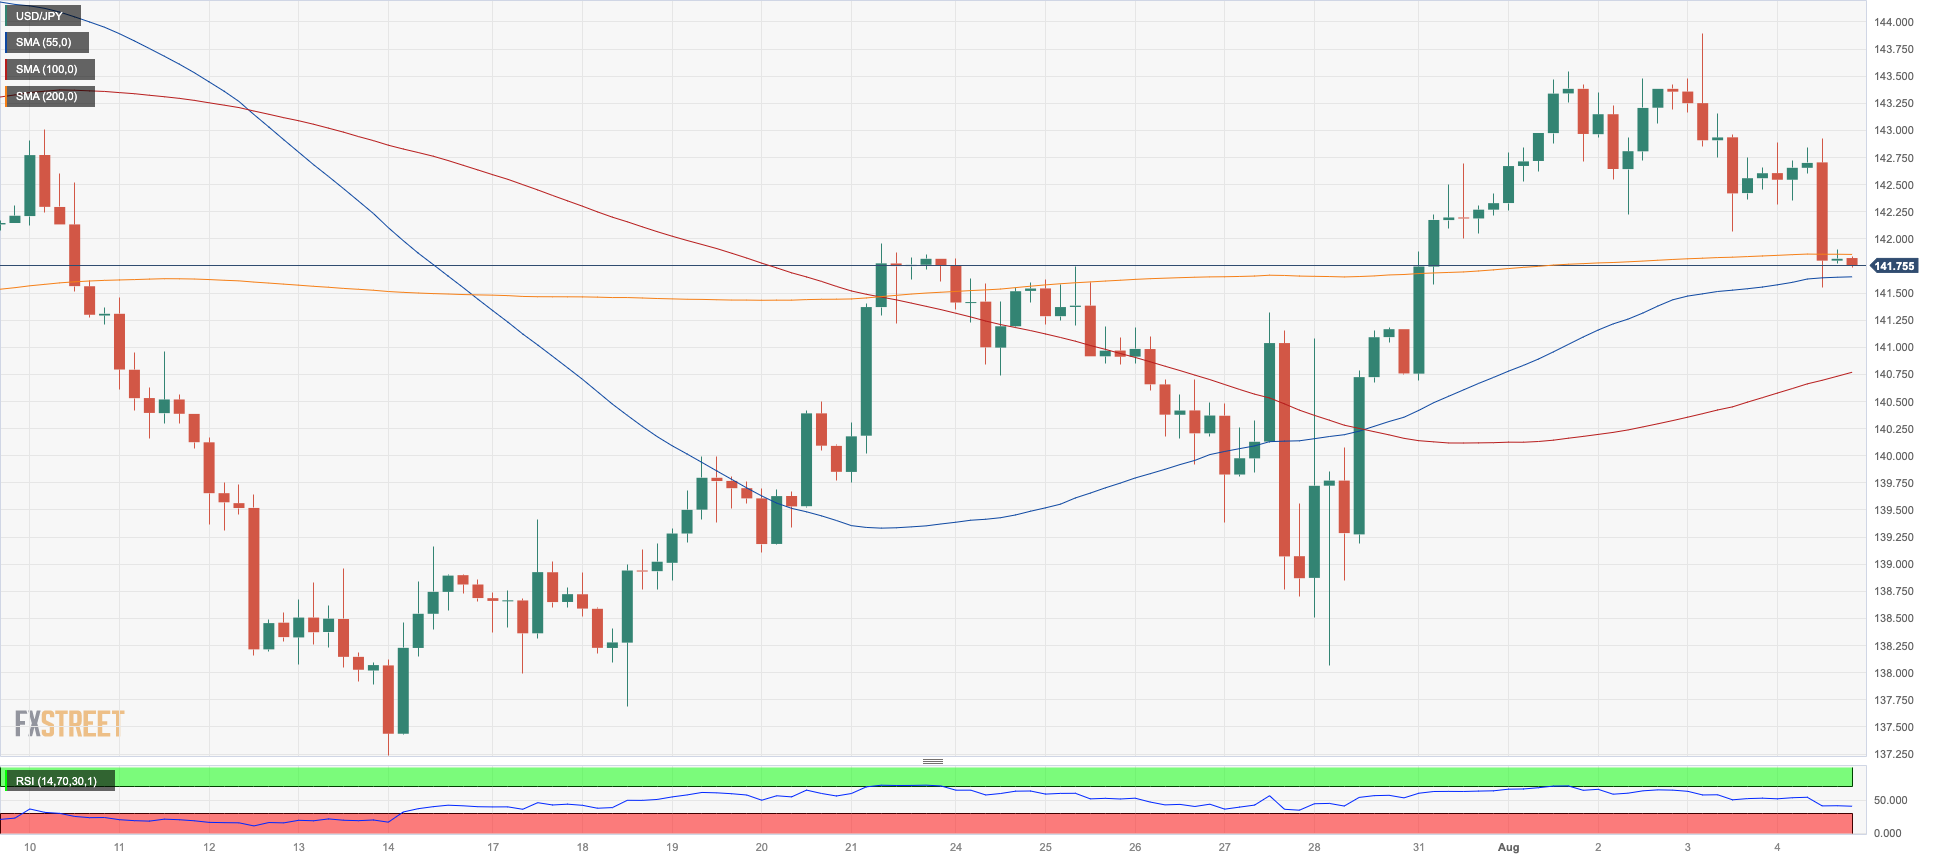
The sudden and significant reversal of the greenback and the corresponding decrease in US bond yields resulted in a further decline in USD/JPY on Friday.
This downward trend persisted for three consecutive trading sessions, with the pair reaching a four-day low of approximately 141.50 by the end of the week.
The retracement in the dollar and yields was particularly pronounced after the release of the Nonfarm Payrolls report in July, which showed that the US economy had added fewer jobs than initially anticipated (187K jobs).
There were no data releases in the “Land of the Rising Sun” on Friday.
Despite the kink on the daily basis, the risks for USD/JPY seem to remain to the upside in the short term. That said, initial resistance lies at the August high of 143.88 (August 3) ahead of the 2023 top of 145.07 (June 30) and the 2022 peak of 151.94 (October 21). On the downside, the 55-day SMA at 141.09 offers provisional support prior to the weekly low of 138.05 (July 28) and the July low of 137.23 (July 14). The breakdown of the latter exposes a probable move to the significant 200-day SMA of 136.56 ahead of the weekly low of 133.01 (26 April), the minor support of 132.01 (13 April) and the round level of 130.00. On the daily chart, the RSI dropped below 52.
Resistance levels: 143.88 144.65 145.07 (4H chart)
Support levels: 141.55 140.66 138.05 (4H chart)
GBPUSD
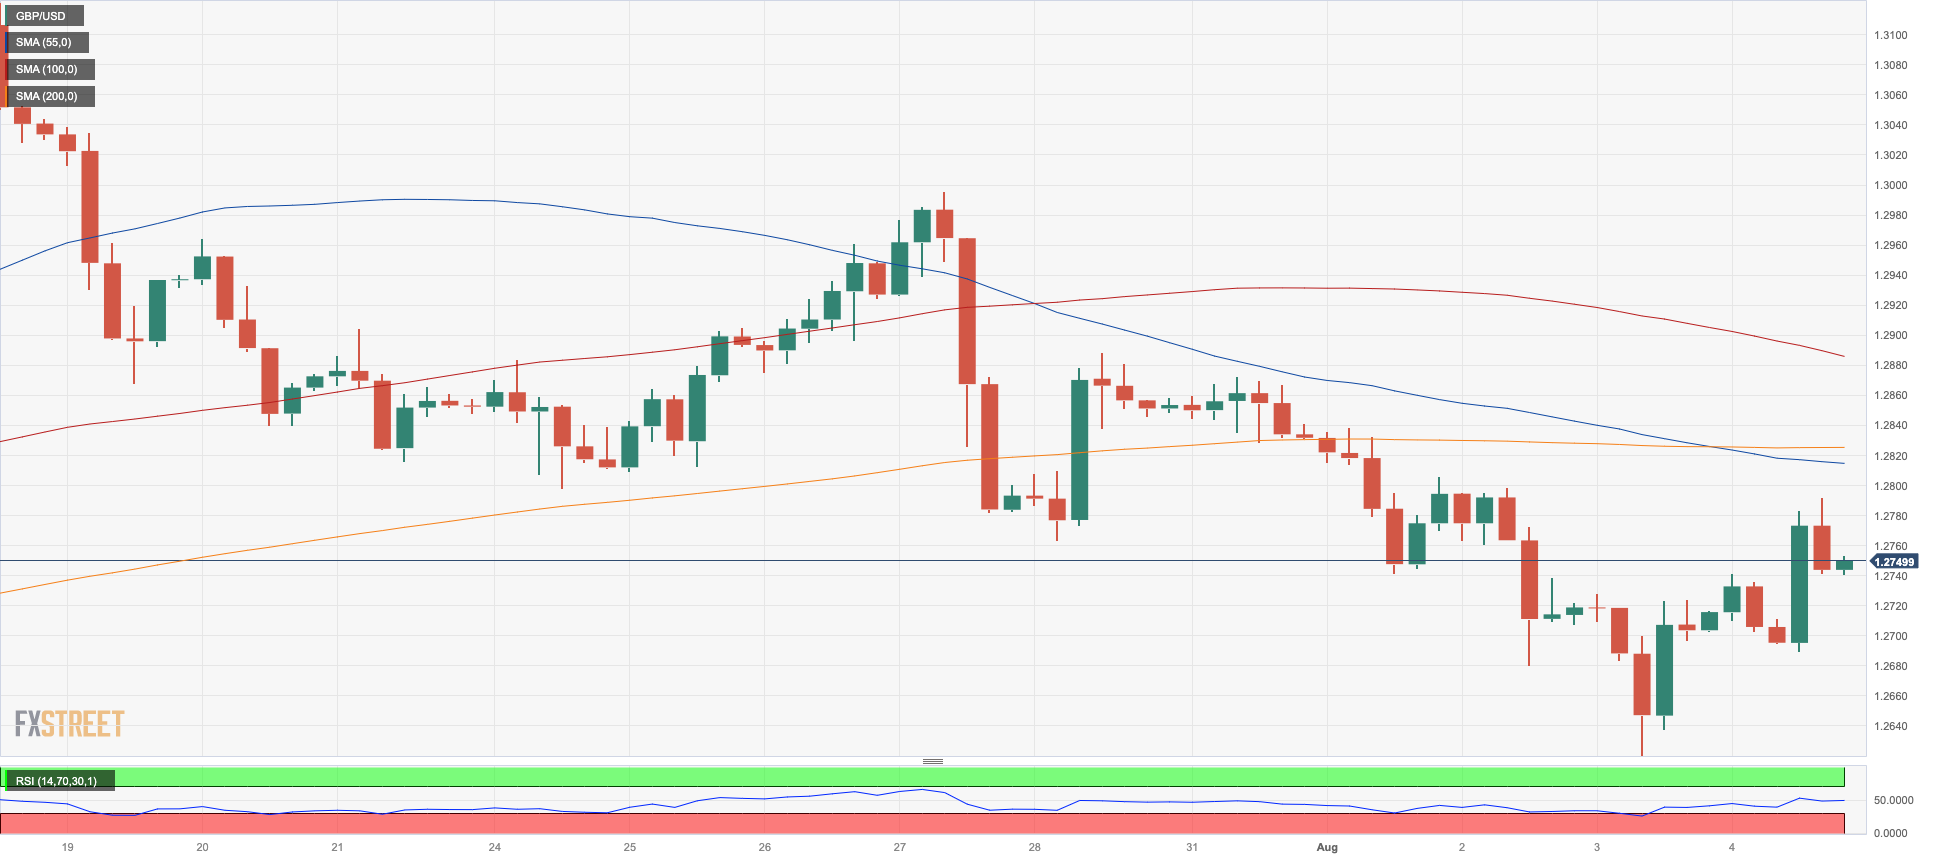
GBP/USD finally found some relief from the severe weekly fall, advancing to two-day highs in levels just shy of 1.2800 the figure at the conclusion of the week.
Gains in the pound were driven by a renewed bullish tone in the risk complex in response to the sharp post-NFP dip in the greenback, which brought the USD Index (DXY) down below the 102.00 threshold.
Following the BoE event on Thursday, where the central bank hiked its policy rate by 25 bps, Chief Economist H. Pill mentioned that the main concern lies in the possibility of inflation persisting in the UK. He noted that the current interest rates in the UK have reached a level that could be considered restrictive and added that the implementation of higher interest rates has been effective in controlling inflation and managing wage growth. He emphasized that if the MPC chooses to keep interest rates at this restrictive level, it will have an ongoing impact on inflation. Moreover, he stated that maintaining these restrictive rates could also put downward pressure on economic activity and overall price levels.
In the UK calendar, the S&P Global/CIPS Construction PMI improved to 51.7 in July (from 48.9). In addition, New Car Sales increased 28.3% in the year to July.
If bears regain the upper hand, GBP/USD may retest the monthly low of 1.2620 (August 3), which is above the weekly low of 1.2590 (June 29) and appears supported by the transitory 100-day SMA of 1.2583. From here, the 2021-2023 trend line emerges around 1.2490 ahead of the June low of 1.2368 (June 5) and the May low of 1.2308 (May 25), both of which look to be supported by the proximity of the important 200-day SMA (1.2315). On the flip side, the weekly high of 1.2995 (July 27) is inhibiting the accomplishment of the 2023 top of 1.3142 (July 14). Further north aligns the weekly peaks of 1.3146 (April 14, 2022) and 1.3298 (March 15, 2022). The daily RSI rose past the 44 mark.
Resistance levels: 1.2792 1.2821 1.2888 (4H chart)
Support levels: 1.2620 1.2591 1.2368 (4H chart)
AUDUSD
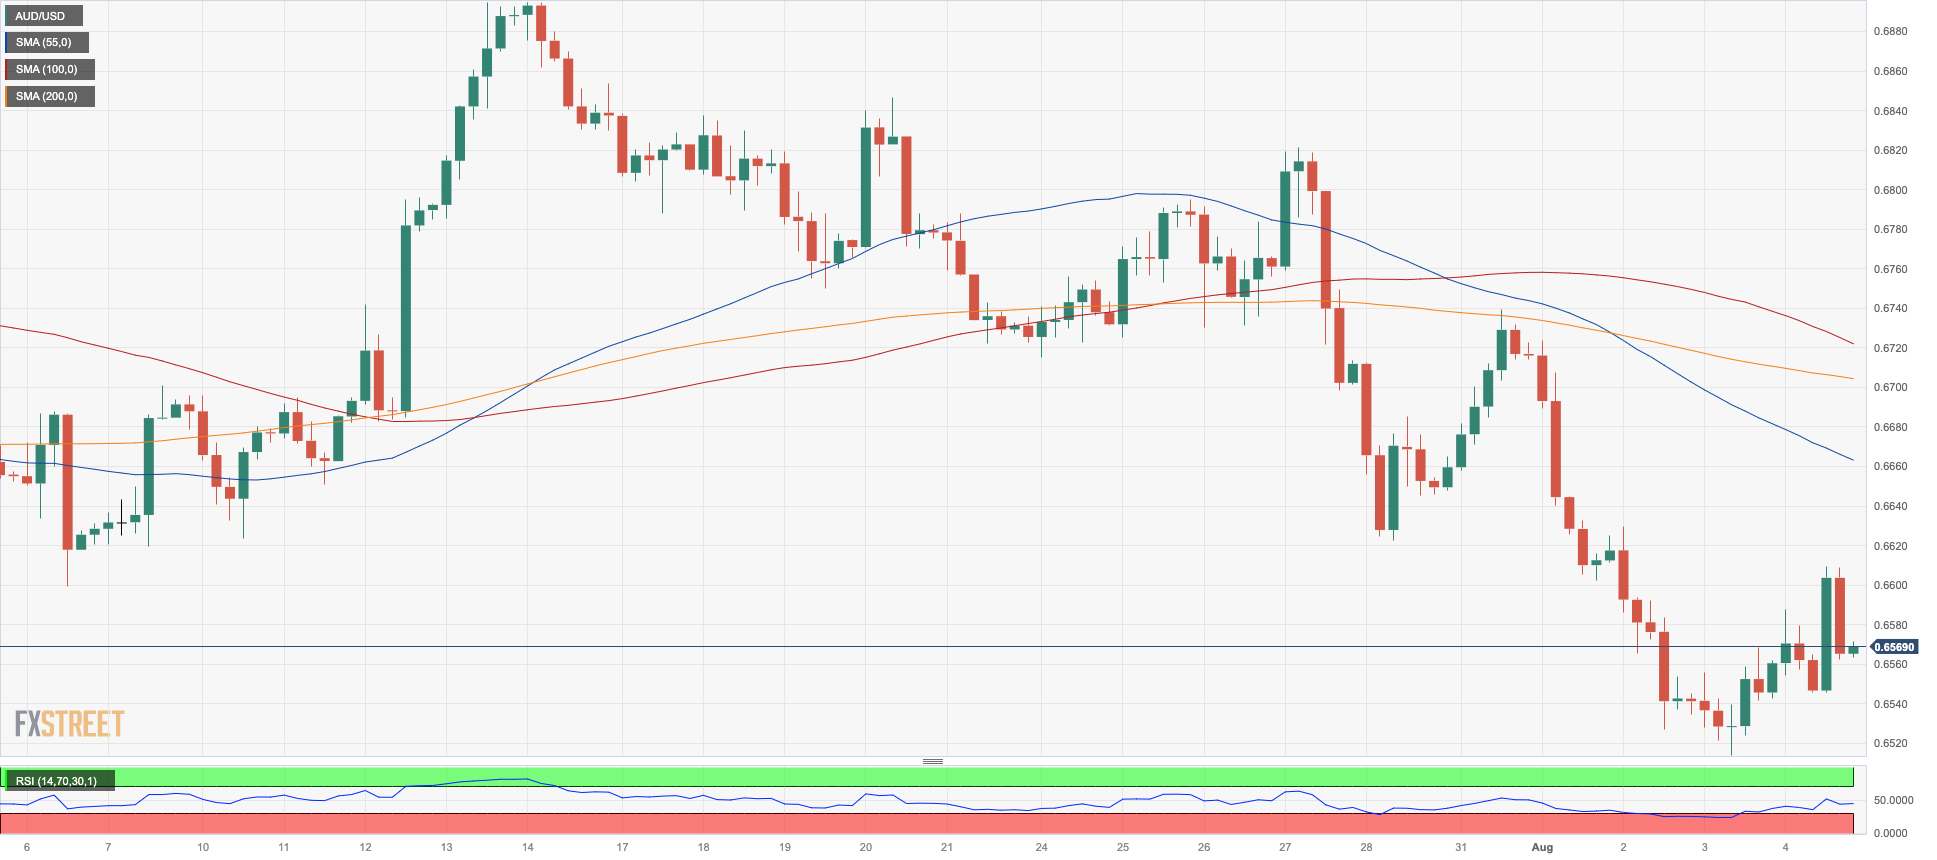
Further recovery in the risk complex sponsored the second consecutive daily advance in AUD/USD, this time briefly surpassing the key 0.6600 the figure at the end of the week.
In fact, the Aussie dollar managed well to maintain optimism in the second half of the week against the backdrop of renewed weakness around the greenback and despite the mixed performance in the commodity space and disheartening results from the Chinese docket published earlier in the week.
The only event of note in the Australian calendar was the release of the RBA’s Statement on Monetary Policy (SoMP), which showed hawkish undertones. On this, the inflation forecasts for the end of 2024 and June 2025 have been slightly revised upwards. In addition, the Board has reiterated its intention to maintain the gains made in the labour market while discussing the decision to pause in July and August. The SoMP has also highlighted a few uncertainties, such as the uncertain outlook of China, the potential for persistent inflation, particularly in the services sector, and the possibility of a significant decline in goods prices.
If the recovery in AUD/USD gathers impulse, the pair could then revisit the key 200-day SMA at 0.6732 prior to the July high of 0.6894 (July 13), which appears shortly followed by the June top of 0.6899 (June 16). Breaking through this sector will allow the price to go to the important 0.7000 level, ahead of the weekly top of 0.7029 (February 14) and the 2023 peak of 0.7157. (February 2). By contrast, a drop below the August low of 0.6514 (August 3) could pave the way for a potential test of the 2023 bottom of 0.6458 (May 31). Below this level, the November 2022 low of 0.6272 occurs (November 3) ahead of the 2022 low of 0.6179 (October 13). The daily RSI advanced to the 39 zone.
Resistance levels: 0.6608 0.6669 0.6739 (4H chart)
Support levels: 0.6514 0.6458 0.6386 (4H chart)
GOLD
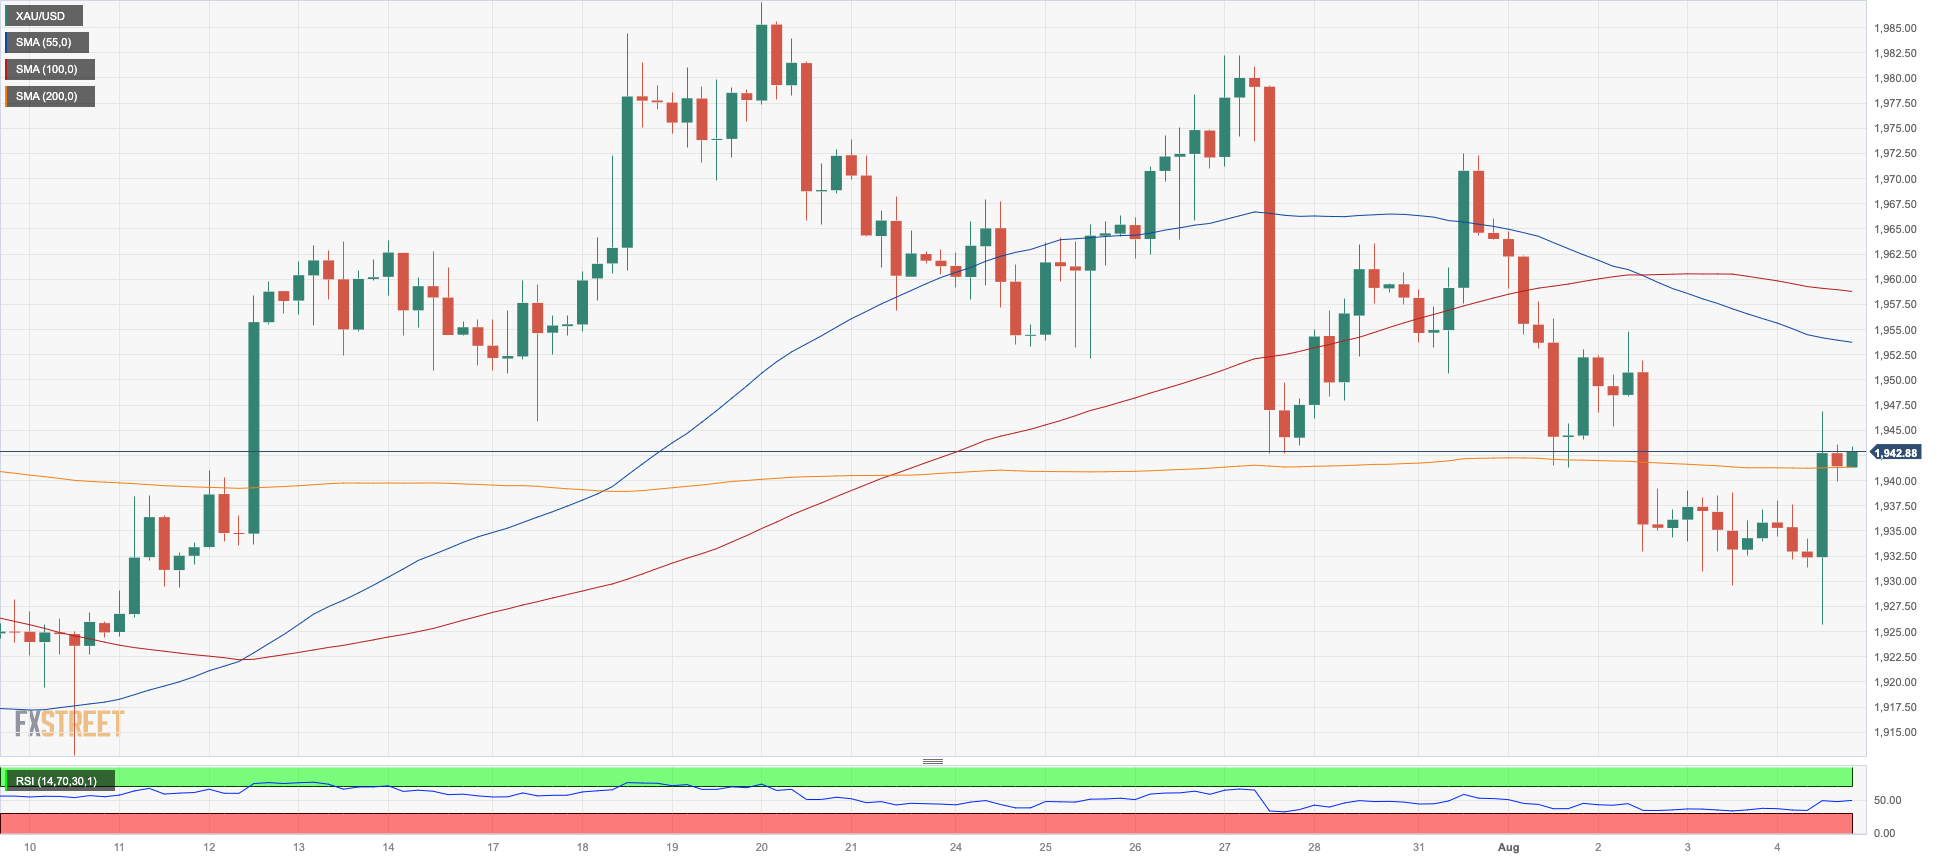
On Friday, gold prices bounced back after experiencing three consecutive sessions of losses and approached the $1950 per troy ounce mark once again. This price region also happened to align with the temporary 55-day SMA.
The greenback’s corrective movement gained momentum after the announcement of the US Nonfarm Payrolls for July, while US bond yields also decreased markedly, giving away part of the recent strong increase.
For the time being, further declines in gold prices should not be ruled out, with the immediate focus on the August low of $1924 (August 4), which comes before the round level of $1900 and the June low of $1893 (June 29), which appears to be supported by the 200-day SMA. The 2023 low of $1804 (February 28) and the crucial support level of $1800 are located south of here. A continuation of the bullish trend, on the other hand, might bring gold prices back to the July high of $1987 (July 20). A break over this level might lead to a surge towards the critical level of $2000, and above that, it could reveal the way to the 2023 top of $2067 (May 4) followed by the 2022 high of $2070 (March 8) and the all-time peak of $2075 (August 7 2020).
Resistance levels: $1946 $1954 $1972 (4H chart)
Support levels: $1924 $1912 $1893 (4H chart)
CRUDE WTI
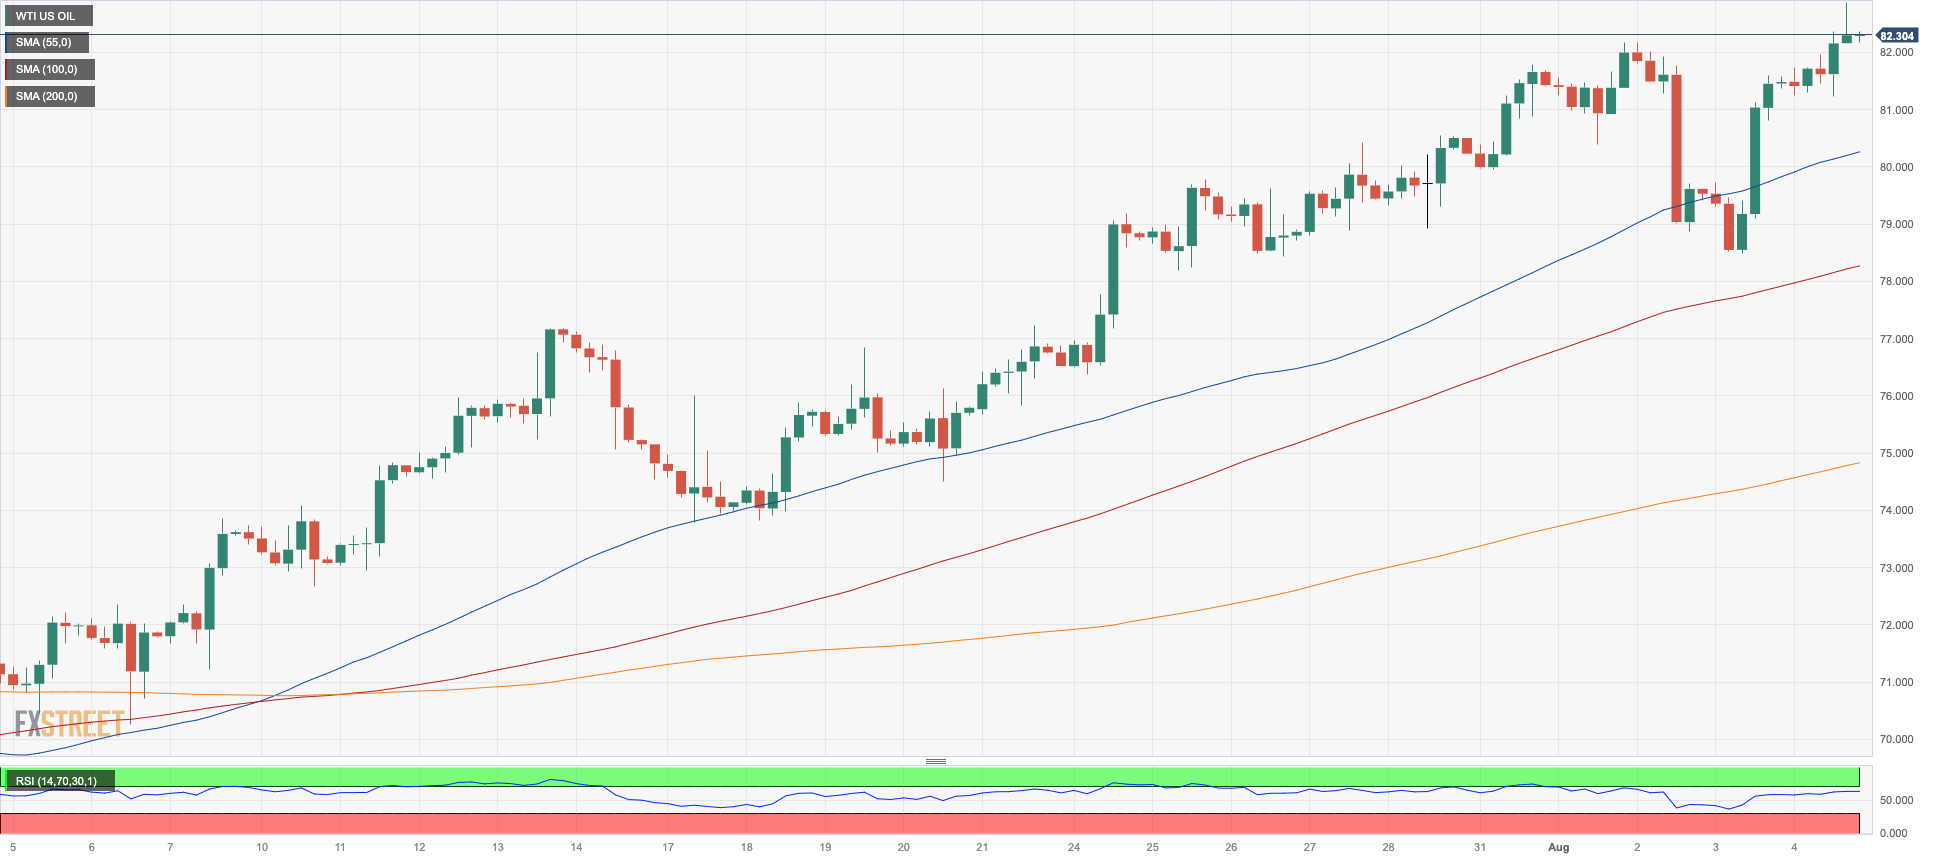
The surge in crude oil prices continued without any signs of slowing down on Friday. The price of a barrel of the American benchmark for high-quality light crude oil flirted with its highest point of the year, surpassing the $83.00 mark. This price increase marked the sixth consecutive week of gains for the oil market.
Once again, the main driving force behind this continuous upward momentum in oil prices was the ongoing narrative of limited supply. This factor overwhelmingly influenced the market, causing the commodity's price to increase by nearly 24% since its low point in late June when it was around $67.00.
Notably, Saudi Arabia and Russia announced their decision to extend oil output cuts and exports until September. This move further contributed to the positive sentiment among traders, alongside the resilience demonstrated by the US economy. Also adding to the daily uptick, driller Baker Hughes reported a drop of 4 oil rigs in the week to August 4, taking the US total active oil rigs to 525.
However, there was a slightly moderating factor in play. The July US Nonfarm Payrolls data indicated that the job market remained robust, potentially reinforcing the idea that the Federal Reserve might maintain its restrictive stance for a longer duration.
Next on the upside for WTI emerges the 2023 high of $83.49 (April 12) ahead of the November 2022 peak of $93.73. (November 7). Having said that, the critical 200-day SMA at $76.55 is considered as initial support, followed by the weekly low of $73.89 (July 17), which appears reinforced by the temporary 100-day and 55-day SMAs at $73.97 and $73.43, respectively. If WTI goes below this region, it could then challenge the June low of $66.86 (June 12) prior to the 2023 low of $63.61 (May 4). Below there, the December 2021 bottom of $62.46 (December 2) may give support before reaching the key round level of $60.
Resistance levels: $83.49 $88.5 $90.08 (4H chart)
Support levels: $78.66 $74.47 $73.81 (4H chart)
GER40
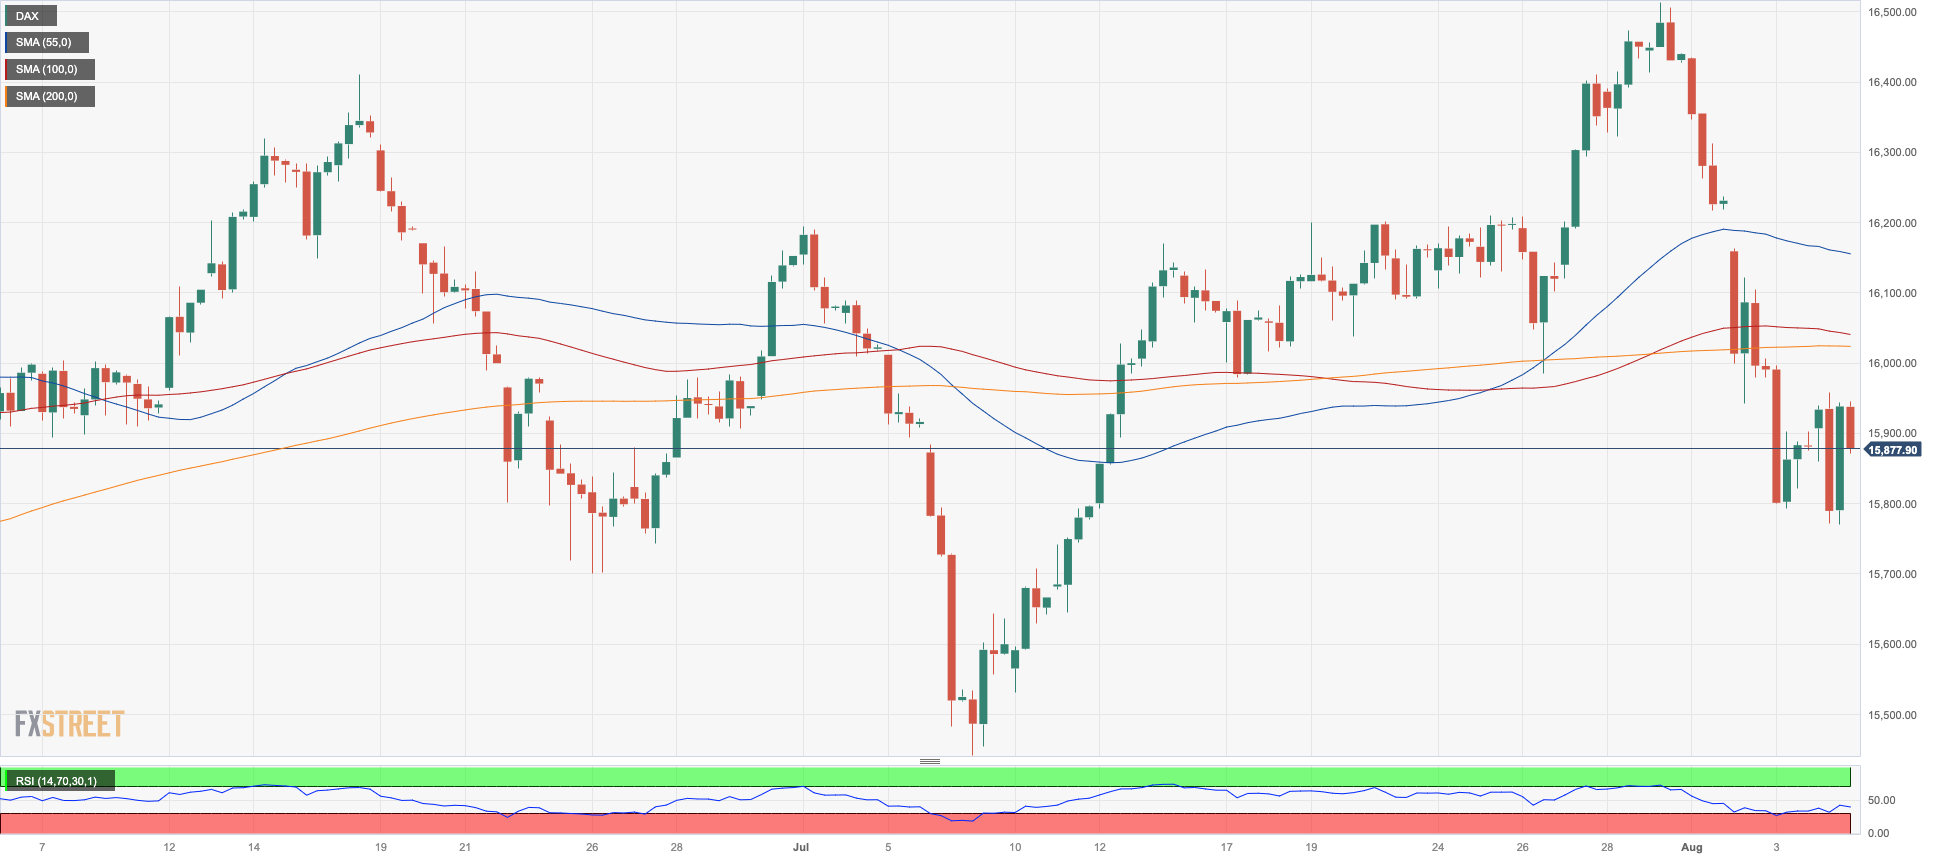
The benchmark DAX40, which represents German stocks, managed to partially reverse its four-day negative streak on Friday.
However, despite this daily recovery, the index experienced its first week of losses in the last four weeks. Various factors contributed to this, including disappointing earnings, a slowdown in certain economic indicators in the region, and Fitch's downgrade of the US rating. These factors had a negative impact on market sentiment throughout the week.
Nonetheless, Friday brought a more positive tone, driven by investors' belief that the US economy could ultimately achieve a "soft landing". Additionally, positive financial results from US giants Apple and Amazon, a still strong labour market in the US, and solid economic data from Germany all contributed to the overall optimism in Europe.
Within Germany specifically, Factory Orders expanded by 7% on a monthly basis in June, New Car Registrations increased by 18.1% compared to the previous year up to July, and the Construction PMI slightly eased to 41.0 during the last month.
The DAX40's record high of 16528 (July 31) appears to the upside right away. In comparison, the August low of 15784 (August 4) precedes the July low of 15456 (July 7) and is followed by the crucial 200-day SMA of 15242. If this zone is breached, the market is likely to descend to the March low of 14458 (March 20) before the December 2022 low of 13791 (December 20). The daily RSI regained the smile and surpassed 44.
Best Performers: Rheinmetall AG, Daimler Truck Holding, Siemens AG
Worst Performers: Commerzbank, Sartorius AG VZO, Qiagen
Resistance levels: 16022 16146 16528 (4H chart)
Support levels: 15784 15456 14809 (4H chart)
NASDAQ
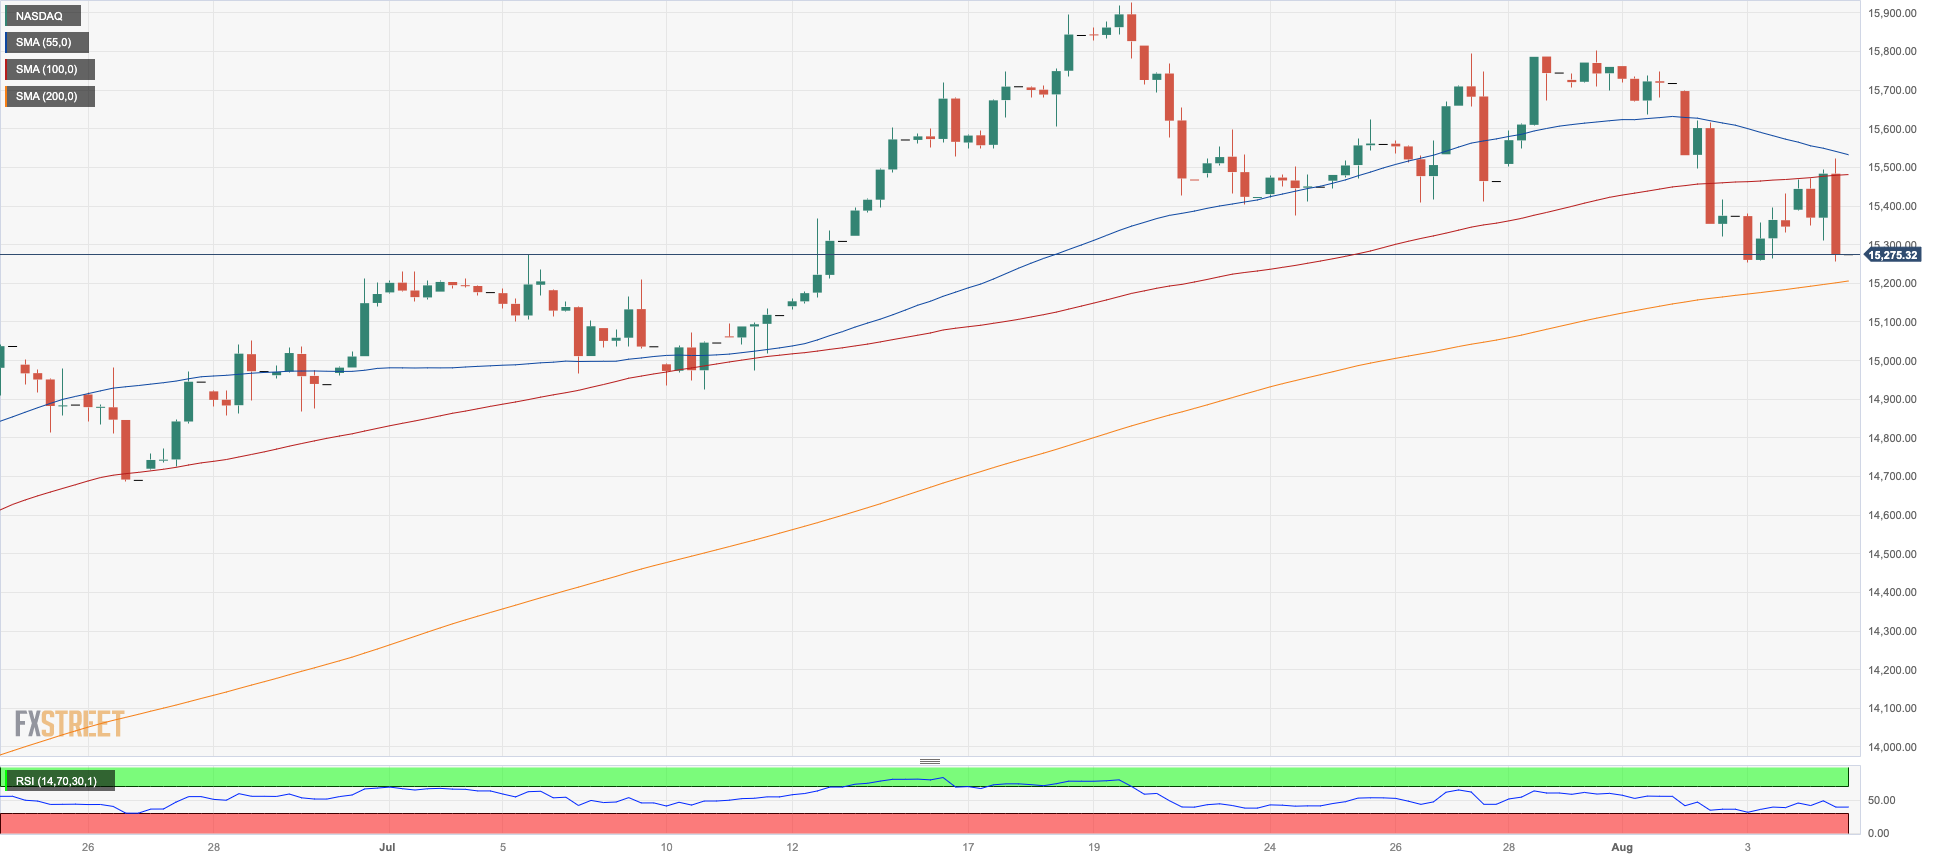
On Friday, US technology stocks continued their downward trend for the fourth consecutive session. Although the index experienced a daily decline, it seems to have found strong support around the 15300 level for now.
Similar to other US indices, the Nasdaq 100 faced renewed and significant selling pressure shortly after reaching its daily highs. The decline in the stock price of Apple, a major iPhone manufacturer, also contributed to the overall pullback, as did the late rebound in the value of the dollar.
The revival of the positive bias could propel the Nasdaq 100 to its weekly high of 15803 (July 31), which is quickly followed by the 2023 top of 15932 (July 19) and the round 16000 milestone. In comparison, the August low of 15270 (August 3) provides early support ahead of the July low of 14924 (July 10), while the weekly lows of 14687 (June 26) and 14283 (June 7) are more southerly. A breach of the latter might result in another weekly low of 13520 (May 24), which is prior to the May low of 12938 (May 4) and the April low of 12724 (April 25) and looks to be supported by the proximity of the crucial 200-day SMA (12853).
Top Gainers: Atlassian Corp Plc, Warner Bros Discovery, Amazon.com
Top Losers: Fortinet, Palo Alto Networks, Microchip
Resistance levels: 15795 15932 16017 (4H chart)
Support levels: 15258 14924 14687 (4H chart)
DOW JONES
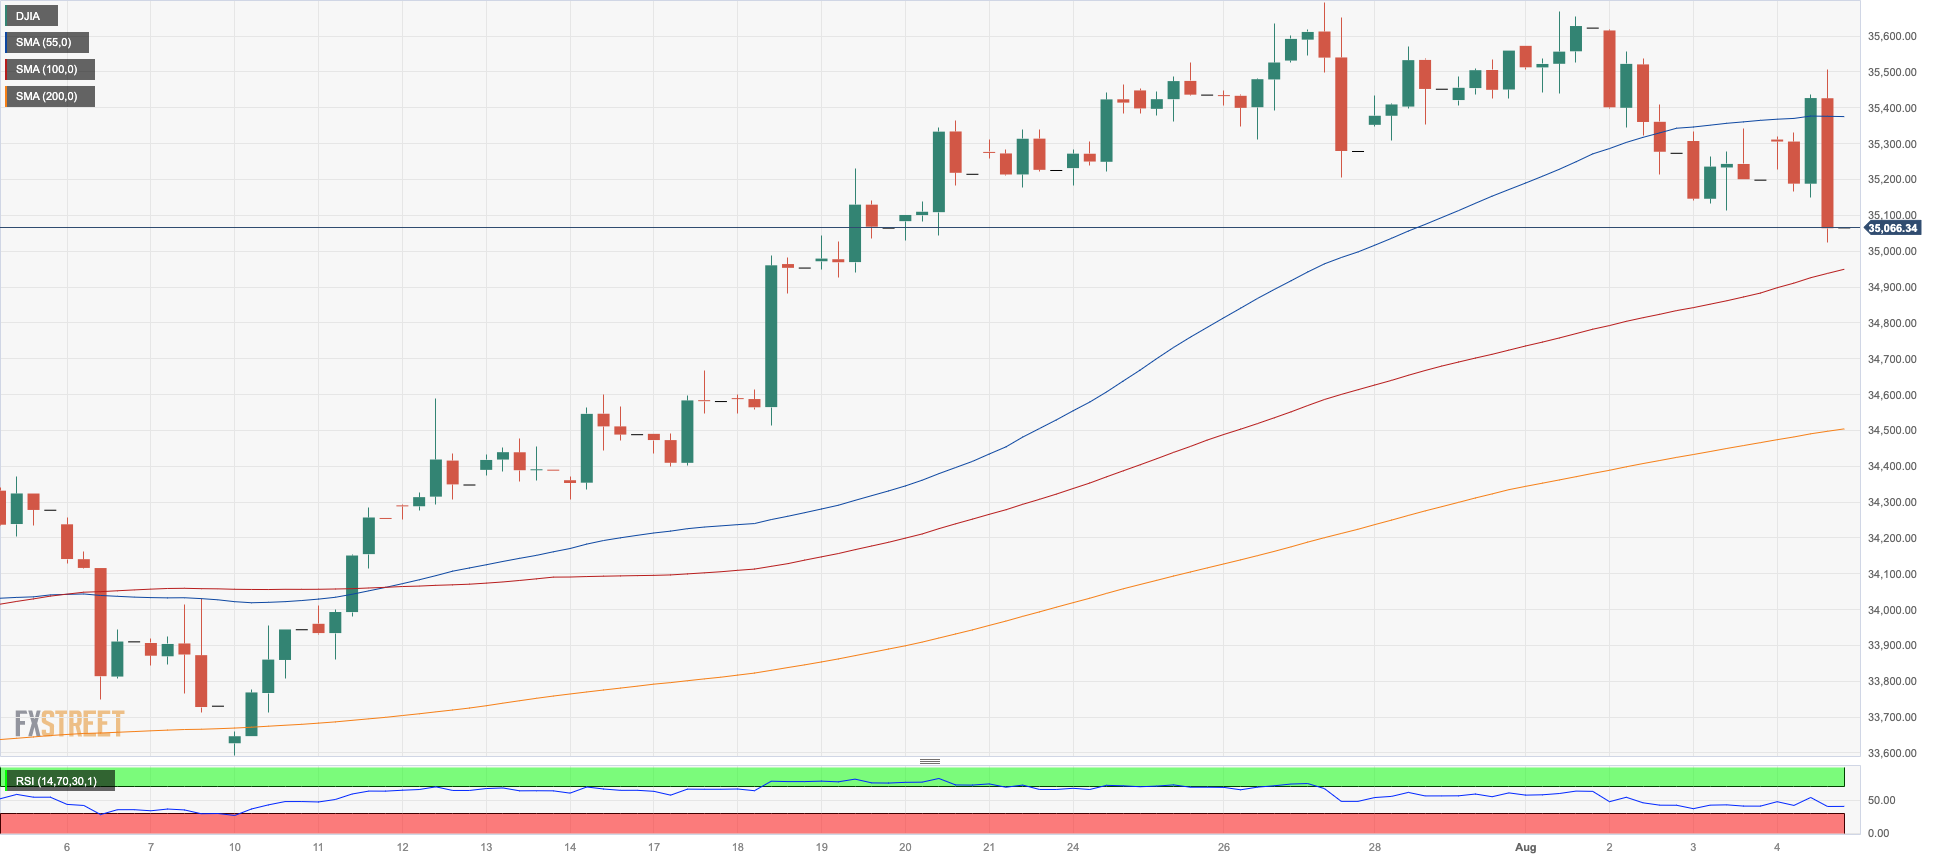
US stocks represented by the Dow Jones initially gained ground but eventually fell back into negative territory by the end of the week. As a result, the index concluded its first week of losses following three consecutive advances.
In reality, the Dow was unable to maintain its earlier recovery and declined to new lows in the 35000 range, as the US dollar strengthened and yields across the US bond market declined, while Apple shares dropped strongly.
Meanwhile, market participants analyzed the Nonfarm Payrolls data, which showed an increase of 187K jobs. They remained cautious due to the still strong condition of the labor market, which could morph into further inflationary pressures that might potentially lead to further tightening measures by the Federal Reserve.
All in all, the Dow Jones dropped 0.43% to 35065, the S&P500 retreated 0.53% to 4478, and the tech-benchmark Nasdaq Composite went down 0.36% to 13909.
If the Dow Jones could break above the 2023 high of 35679 (August 1), it might dispute the February 2022 top of 35824 (February 9) before hitting an all-time peak of 36952 (January 5, 2022). However, the index will not reach the first support level until it reaches the intermediate 55-day SMA at 34183. Further south, the transitory 100-day SMA at 33756 appears to be supporting the July low of 33705 (July 10). The 200-day SMA of 33511 comes before the May low of 32586 (May 25) and the 2023 low of 31429. (March 15). The daily RSI slipped back to the 55 zone.
Top Performers: Amgen, Intel, Walt Disney
Worst Performers: Apple, Caterpillar, 3M
Resistance levels: 35679 35824 36513 (4H chart)
Support levels: 35033 34774 33705 (4H chart)
MACROECONOMIC EVENTS

All Information & Updates provided by:

All information relating to the financial markets available on this page has been prepared and issued by FXStreet (Forexstreet SL, Spain, Reg: B62498233) on the basis of publicly available information and all information believed to be reliable and does not conflict with Kuwaiti local laws, and all necessary care has been taken to before the company to ensure that the facts mentioned are correct from the source.
NCM Investment nor any of its directors or employees shall in any way be held responsible for the contents of this news, and the information contained on this page is intended only to provide clients with publicly available information and should not be construed as investment advice, report or analysis and/or constitute an offer or invitation to buy or sell financial instruments of any kind.
RISK WARNING: Forex and CFDs are highly risky leveraged products, as losses can exceed deposits. Please ensure you understand all the risks and take independent advice if necessary. NCM will segregate the clients based on the criteria of the regulator and its bylaws. NCM does not provide any advisory service; the material published does not constitute advice or a recommendation for a transaction in any financial instrument. NCM accepts no responsibility for any use of the content presented and any consequences of that use. Anyone acting on the information provided does so at their own risk.