
- Contact Us:
-

-

-

-


Daily Market Updates
08 Aug 2023
USDJPY
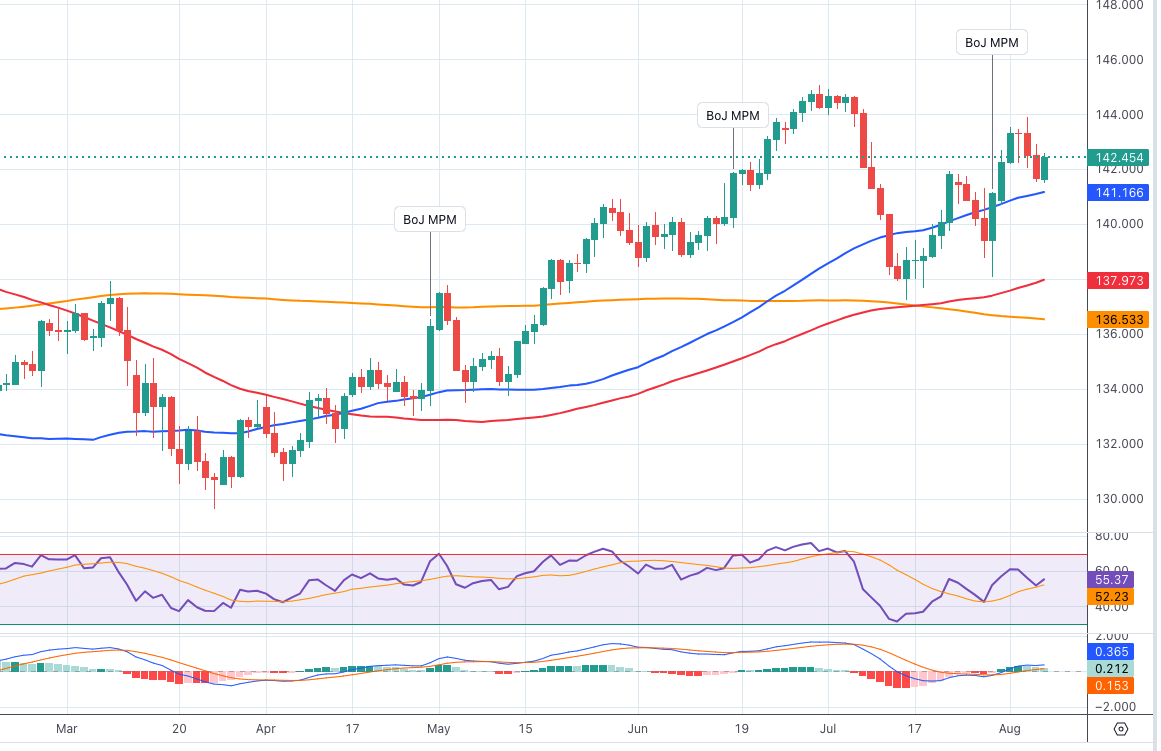
Starting the week on a positive note, USD/JPY exhibited decent gains, breaking through the barrier at 142.00 and reversing at the same time three consecutive sessions of losses.
The improvement in the greenback’s performance, combined with a modest recovery in US yields across the 10-year/30-year segment, strengthened the upward bias in the pair. This development prompted the pair to redirect its attention towards the possibility of reaching the peak observed in August, situated around the 144.00 level (August 3).
Turning to the economic indicators in Japan, the preliminary data for the month of June reveals that the Coincident Index saw an enhancement to 115.2, while the Leading Economic Index experienced a slight dip to 108.9.
Next on the upside for USD/JPY appears the August high of 143.88 (August 3), followed by the 2023 top of 145.07 (June 30) and the 2022 peak of 151.94 (October 21). On the contrary, the 55-day SMA at 141.16 provides interim support before the weekly low of 138.05 (July 28) and the July low of 137.23 (July 14). The breach of the latter reveals a likely drop to the key 200-day SMA of 136.53, prior to the weekly low of 133.01 (April 26), minor support of 132.01 (April 13), and the round level of 130.00. On the daily chart, the RSI edged higher past the 55 yardstick.
Resistance levels: 142.92 143.88 144.65 (4H chart)
Support levels: 141.50 140.88 138.05 (4H chart)
GBPUSD
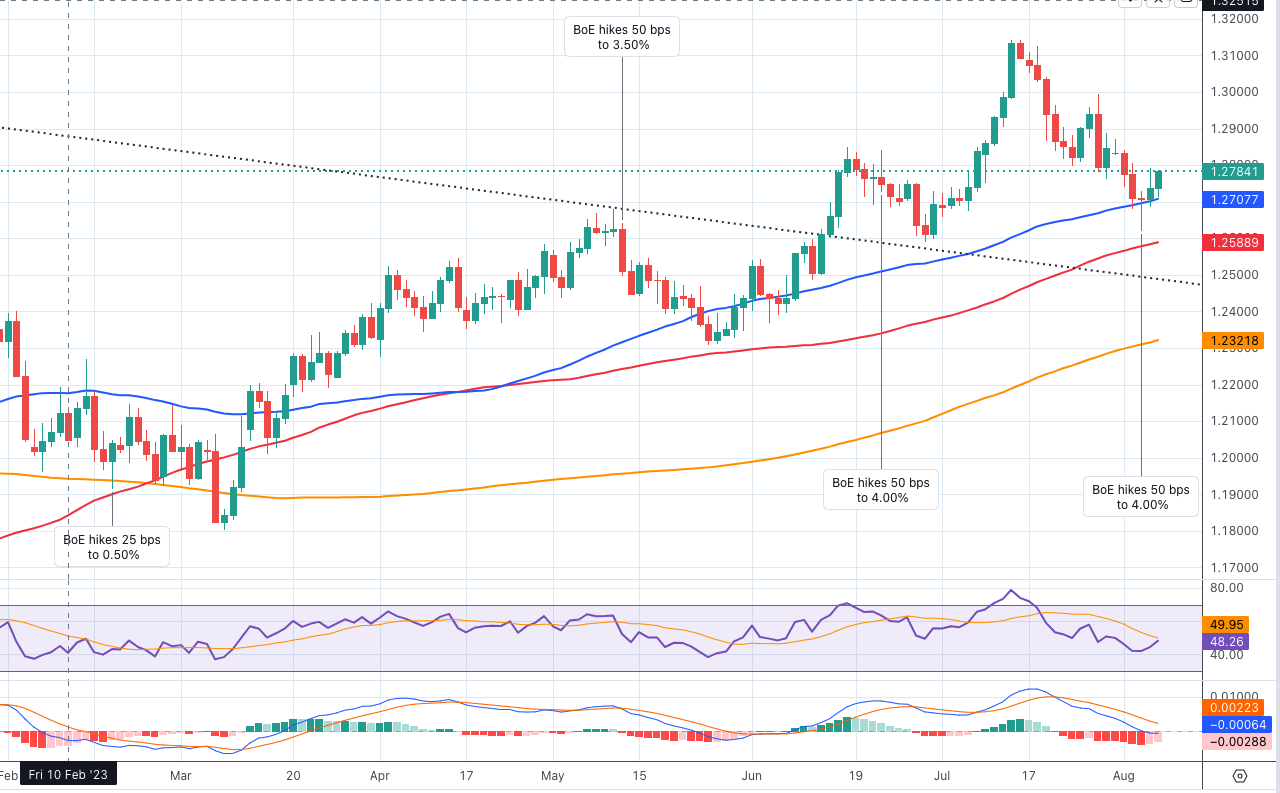
Despite the greenback's positive start to the week, GBP/USD managed to extend Friday's gains and flirted with the 1.2790 zone on Monday.
Indeed, Cable climbed for the second session in a row, extending its recovery from the post-BoE fall to the 1.2620 zone (August 3), accompanied by an equally robust recovery in UK 10-year gilt yields to about 4.50 percent at the start of the week.
Data-wise across the Channel, house prices tracked by Halifax dropped by 0.3% MoM in July and 2.4% from a year earlier.
In case the recovery becomes more serious, GBP/USD is expected to challenge the weekly high of 1.2995 (July 27) ahead of the 2023 top of 1.3142 (July 14). Further north, the weekly peaks of 1.3146 (April 14 2022) and 1.3298 (March 15 2022) are in place. On the downside, the monthly low of 1.2620 (August 3) comes first prior to the weekly low of 1.2590 (June 29) and the interim 100-day SMA of 1.2588. From here, the 2021-2023 trendline near 1.2480 stands out, ahead of the June low of 1.2368 (June 5) and the May low of 1.2308 (May 25), both of which seem to be supported by the proximity of the important 200-day line SMA (1.2321). The RSI on the daily chart rose to the boundaries of 48.
Resistance levels: 1.2792 1.2821 1.2888 (4H chart)
Support levels: 1.2620 1.2591 1.2368 (4H chart)
AUDUSD
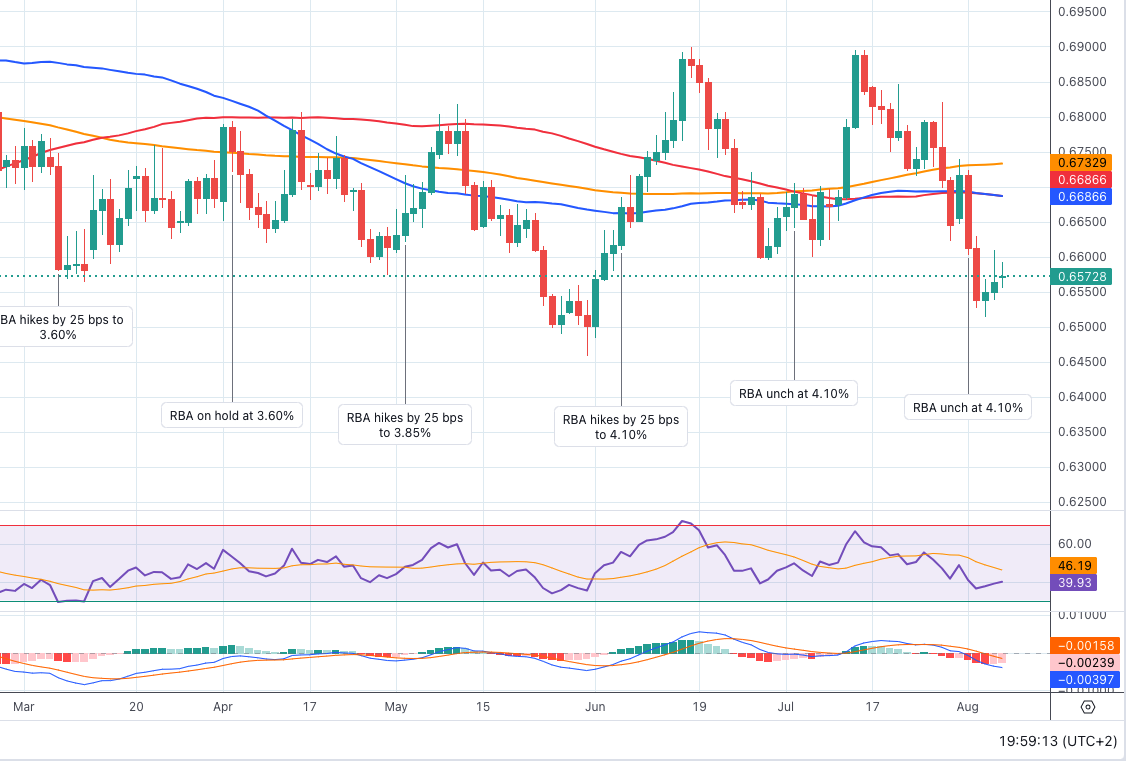
The Australian dollar got off to an inconclusive start against the greenback this week, hovering around 0.6570.
In fact, the Aussie dollar lacked direction on Monday amid weakness in the buck and mixed signals from commodity markets. On this, copper prices extended Friday's decline while iron ore managed only a feeble rebound.
There were no significant economic data releases from Australia to start the week, leaving the Aussie dollar without much catalyst.
If the rebound in AUD /USD gains momentum, the pair could retarget the important 200-day SMA at 0.6732 before reaching the July high of 0.6894 (July 13), which is just ahead of the June top of 0.6899 (June 16). A breakout of this sector would allow the price to target the important 0.7000 level, prior to the weekly peak of 0.7029 (February 14) and the 2023 high of 0.7157 (February 2). On the other hand, a fall below the August low of 0.6514 (August 3) could pave the way for a possible test of the 2023 low of 0.6458 (May 31). Below this level, the November 2022 low at 0.6272 occurs (November 3), before the 2022 low at 0.6179 (October 13). The RSI on the daily chart remained flattish around the 40 area.
Resistance levels: 0.6609 0.6700 0.6739 (4H chart)
Support levels: 0.6514 0.6458 0.6386 (4H chart)
GOLD
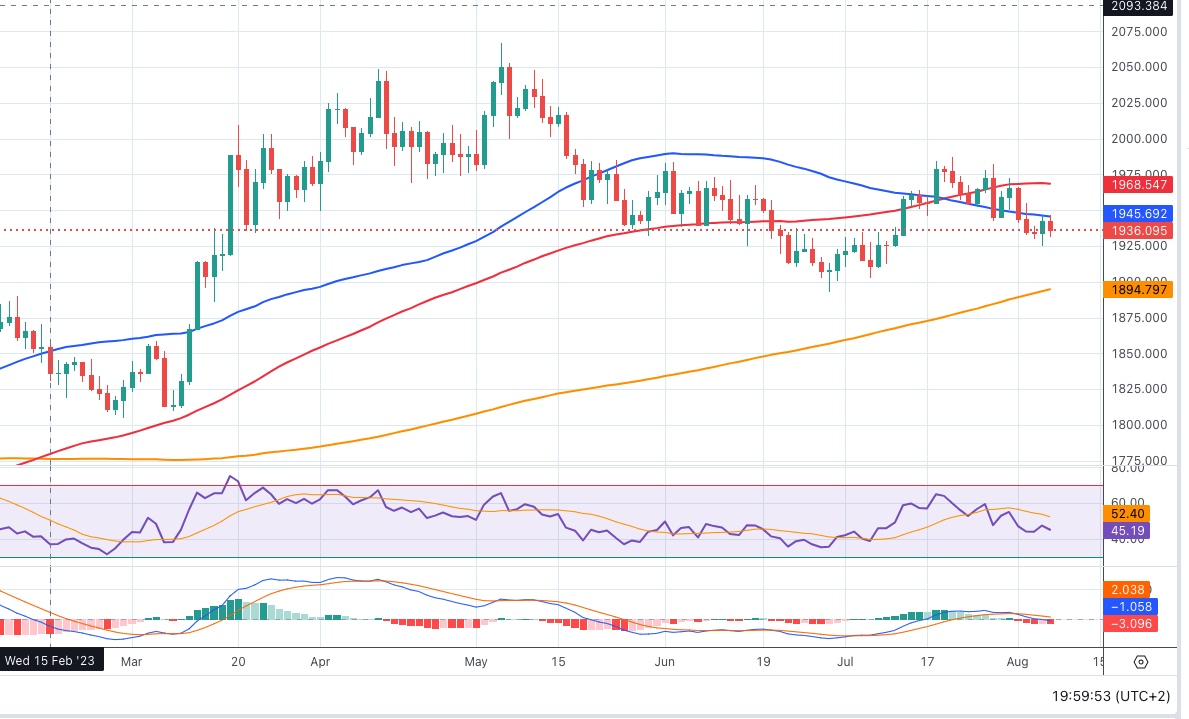
The week began with a negative tone as the prices of the yellow metal declined, reversing the decent increase seen on Friday, and refocused on the downward trend. On Monday, there was a brief test of the $1930 region per troy ounce.
The recovery of the greenback, which had experienced losses in the previous two sessions, added pressure on the precious metal, while the moderate increase in US yields across the board also contributed to the daily decline in bullion.
Looking ahead, the performance of gold is expected to closely follow the release of US inflation figures, specifically tracked by the CPI, which are scheduled to be released later in the week. There is growing anticipation of a lower inflation reading and increasing speculation that the Federal Reserve might conclude its interest rate hiking cycle sooner rather than later.
Further drops in gold prices should not be ruled out for the time being, with the immediate focus on the August low of $1924 (August 4), which comes before the round level of $1900, and the June low of $1893 (June 29), which looks to be supported by the 200-day SMA ($1894). South of here is the 2023 low of $1804 (February 28) and the critical support level of $1800. A continuation of the positive trend, on the other hand, might return gold prices to the July high of $1987 (July 20). A break above this level might trigger a surge towards the crucial level of $2000, and above that, it could show the path to the 2023 high of $2067 (May 4) prior to the 2022 peak at $2070 (March 8) and the all-time top of $2075 (August 7 2020).
Resistance levels: $1954 $1972 $1982 (4H chart)
Support levels: $1924 $1912 $1893 (4H chart)
CRUDE WTI
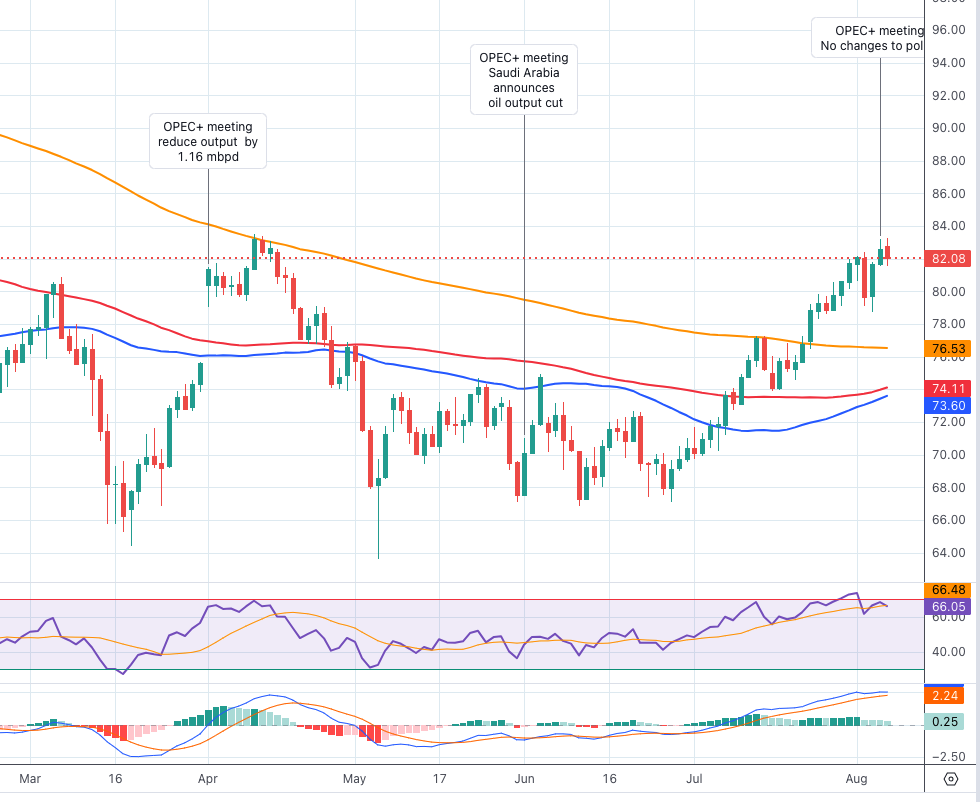
The price of West Texas Intermediate (WTI) oil has retreated slightly from its recent multi-week surge, falling to the $81.50 region on Monday.
This pullback appears to be driven by profit-taking and a strengthening greenback. Despite this, the commodity remains well-supported by the narrative of tight supply, which is in turn underpinned by announcements of oil output cuts by Saudi Arabia and a reduction of Russian crude oil exports.
The American Petroleum Institute (API) and the Energy Information Administration (EIA) are set to release their reports on US crude oil supplies for the week ending August 4 on Tuesday and Wednesday, respectively.
The 2023 high of $83.49 (April 12) is next on the upside for WTI, followed by the November 2022 top of $93.73 (November 7) and the August 2022 peak of $97.65 (August 30). Instead, the key 200-day SMA of $76.53 is seen as initial support, followed by the weekly low of $73.89 (July 17), which looks to be strengthened by the interim 100-day and 55-day SMAs of $74.11 and $73.60, respectively. If WTI falls below this region, it may dispute the June low of $66.86 (June 12) before falling to the 2023 low of $63.61 (May 4). Below there, the December 2021 bottom of $62.46 (December 2) may provide support before the critical round level of $60 is reached.
Resistance levels: $83.49 $88.5 $90.08 (4H chart)
Support levels: $78.66 $74.47 $73.81 (4H chart)
GER40
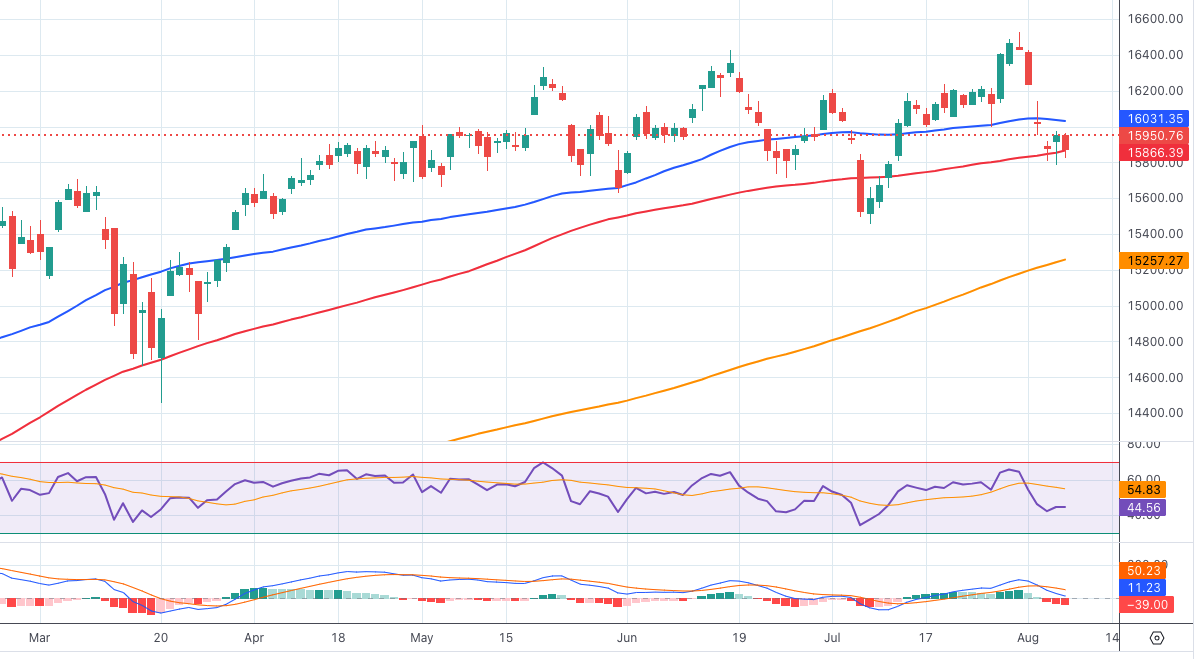
At the start of the week, the DAX40, which monitors the performance of German stocks, exhibited a session marked by uncertainty. This continued a beginning phase of consolidation that was taking place just below the significant benchmark of 16000.
The upcoming release of earnings reports, coupled with the anticipated publication of inflation data from both the US and China later in the week, appear to have influenced investors to engage in trade with a sense of caution.
Shifting focus to the German money market, the yields on the 10-year bund experienced a rebound, edging close to the level of around 2.60%. This movement came after a decline observed on Friday.
The DAX40's record high of 16528 (July 31) immediately emerges to the upside. In comparison, the August low of 15784 (August 4) comes before the July low of 15456 (July 7) and is immediately followed by the critical 200-day SMA of 15257. If this zone is violated, the market is anticipated to fall to the March bottom of 14458 (March 20) before falling to the December 2022 low of 13791 (December 20) and the 2022 low of 11862 (September 28). The everyday RSI receded marginally to the sub-45 area.
Best Performers: Rheinmetall AG, Bayer, Infineon
Worst Performers: Siemens Energy AG, Commerzbank, Sartorius AG VZO
Resistance levels: 16024 16146 16528 (4H chart)
Support levels: 15784 15456 14809 (4H chart)
NASDAQ
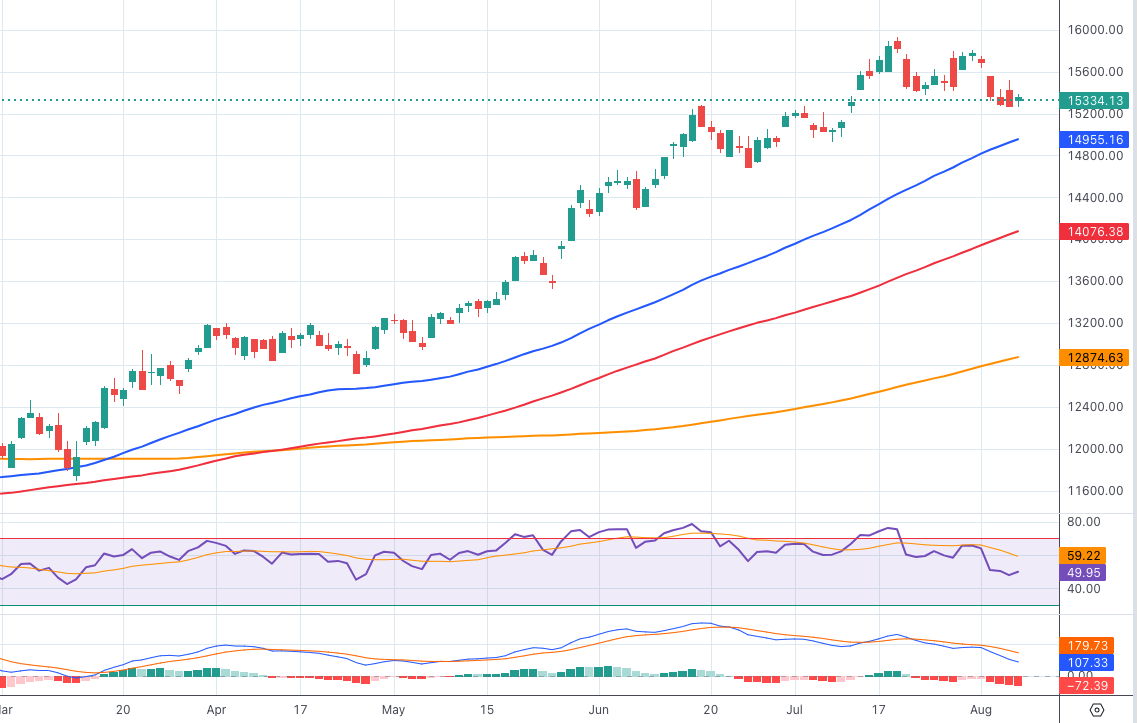
The Nasdaq 100, like other US stock market indices, experienced a slight increase at the start of the new trading week.
This was driven by growing speculation that the Fed may conclude its tightening measures earlier than expected. Additionally, there was increasing optimism regarding lower inflation rates in the upcoming US economic data release, as well as positive expectations for corporate earnings reports.
These factors collectively contributed to a positive sentiment in the US tech sector on Monday and supported the daily upward movement in the Nasdaq 100 index.
The Nasdaq 100 may return to its weekly high of 15803 (July 31), followed by the 2023 high of 15932 (July 19) and the round 16000 level if the bullish bias returns in a more serious fashion. In contrast, there is an immediate support at the August low at 15258 (August 4) seconded by the interim 55-day SMA at 14955 and prior to the July low of 14924 (July 10). The loss of the latter exposes the weekly lows of 14687 (June 26), 14283 (June 7) and 13520 (May 24). Down from here comes the May low of 12938 (May 4) ahead of the 200-day SMA at 12874 and the April low of 12724 (April 25).
Top Gainers: Monster Beverage, Booking, Amgen
Top Losers: Moderna, Lucid Group, Atlassian Corp Plc
Resistance levels: 15795 15932 16017 (4H chart)
Support levels: 15258 14924 14687 (4H chart)
DOW JONES
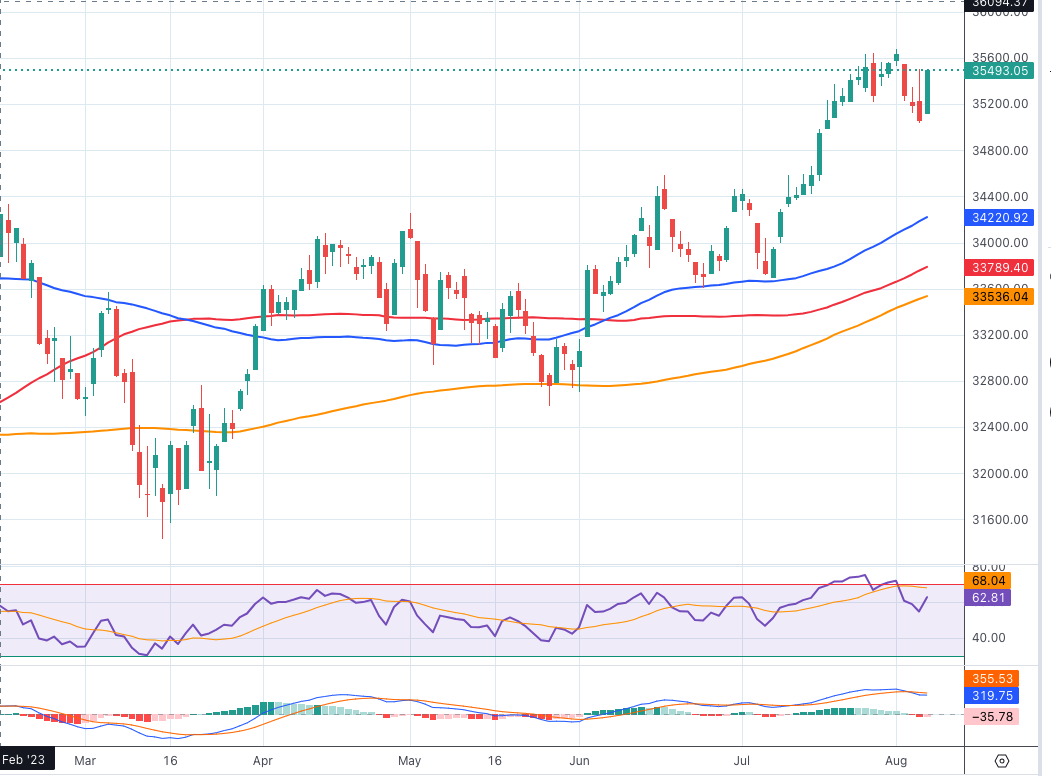
US equities measured by the Dow Jones kicked off the week in a positive mood and set aside three consecutive sessions with losses, regaining at the same time the 33500 region.
Optimism among market participants prevailed on Monday ahead of the release of further corporate earnings reports, while hopes of extra consolidation of the disinflationary trend in the US economy also added to the upbeat mood prior to the release of the US CPI on Thursday.
Overall, the Dow Jones rose 1.09% to 35446, the S&P500 advanced 0.71% to 4509, and the tech-focused Nasdaq Composite gained 0.27% to 13948.
If the Dow Jones can break above the 2023 high of 35679 (August 1), it may challenge the February 2022 top of 35824 (February 9) before reaching an all-time high of 36952 (January 5, 2022). The index will not hit the first support level, however, until it reaches the transitory 55-day SMA at 34218. Further south, the 100-day SMA at 33788 looks to be maintaining the July low of 33705 (July 10) ahead of the 200-day SMA of 33535 and the May low of 32586 (May 25). The loss of the latter exposes a potential test of the 2023 low of 31429 (March 15). The daily RSI leapt past 61.
Top Performers: Amgen, Boeing, UnitedHealth
Worst Performers: Apple, Verizon, Intel
Resistance levels: 35679 35824 36513 (4H chart)
Support levels: 35033 34774 33705 (4H chart)
MACROECONOMIC EVENTS

All Information & Updates provided by:

All information relating to the financial markets available on this page has been prepared and issued by FXStreet (Forexstreet SL, Spain, Reg: B62498233) on the basis of publicly available information and all information believed to be reliable and does not conflict with Kuwaiti local laws, and all necessary care has been taken to before the company to ensure that the facts mentioned are correct from the source.
NCM Investment nor any of its directors or employees shall in any way be held responsible for the contents of this news, and the information contained on this page is intended only to provide clients with publicly available information and should not be construed as investment advice, report or analysis and/or constitute an offer or invitation to buy or sell financial instruments of any kind.
RISK WARNING: Forex and CFDs are highly risky leveraged products, as losses can exceed deposits. Please ensure you understand all the risks and take independent advice if necessary. NCM will segregate the clients based on the criteria of the regulator and its bylaws. NCM does not provide any advisory service; the material published does not constitute advice or a recommendation for a transaction in any financial instrument. NCM accepts no responsibility for any use of the content presented and any consequences of that use. Anyone acting on the information provided does so at their own risk.